 2018, Vol. 29


b Collaborative Innovation Center of Atmospheric Environment and Equipment Technology, Jiangsu Engineering Technology Research Center of Environmental Cleaning Materials(ECM), Nanjing University of Information Science and Technology, Nanjing 210044, China;
c School of Basic Science, China Pharmaceutical University, Nanjing 211198, China
More than four decades after the pioneering work on photocatalytic H2 evolution by Honda and Fujishima in 1972, the potential technology has been extensively explored for solving the emerging energy crisis and environmental issues. Photocatalytic water-splitting by solar energy is one of the promising ways in the potential application for solving these issues. To effectively utilize the solar energy, the photocatalyst with an optical band gap of >1.23 eV is required for the thermodynamically driving photocatalytic water-splitting reaction. Moreover, the corresponding conduction band edge should be more negative than that of the proton reduction potential (-0.41 V vs. NHE (normal hydrogen electrode)) and the valence band edge more positive than that of the water oxidation potential (+0.82 V vs. NHE) [1-3]. Usually the materials possessing small band gap exhibit lower stability under irradiation, while those with wide band gap are more stable but are restricted by their limited or no absorption in the visible region. Titanium dioxide (TiO2) is one typical n-type wide band gap semiconductor widely studied for solar energy conversion applications [4-6]. However, the wide band gap (3.2 eV) and rapid electron-hole recombination lead to low hydrogen production efficiency of TiO2. Numerous research efforts have been made to successfully develop a visible-light sensitive TiO2 catalyst with the appropriate energy band positions. The research approaches have included the incorporation of nitrogen [7], doping of other materials [8-10], the surficial anchoring of chromophoric dyes [11], controlled growth of nano-TiO2 [12], construction of TiO2 heterojunction composites [13-18] and many other methods [19-27].
Since the composite structure of semiconductor always shows better performance than a single component structure, much more researches have been made to synthesize composites with tunable morphology and compositions. Ru/TiO2 nanorods [28] and Mo doped TiO2 showed higher activities in their oxygen reductive reaction (ORR) properties. N-dope TiO2, MoS2 coated TiO2 [29], g-C3N4/TiO2 [30], Au doped TiO2 nanobowl and high pressure/high temperature/hydrogen-treated TiO2 (HPT-TiO2) nanotube arrays show the enhanced activities for H2 generation without any traditional cocatalyst [31, 32]. Moreover, heterostructured structures from TiO2 nanorod@nanobowl (NR@NB) arrays were also constructed for photoelectrochemical (PEC) water splitting study [33]. The corresponding synergistic effect leads to more complex conjunction of ternary structure. MoS2/CdS/TiO2 [34], CdS/Cu2S cosensitized TiO2 branched nanorods [35] are therefore constructed for the better photocatalytic activities.
CdS is a typical direct band gap material with suitable Eg value (2.4 eV). Reported works on CdS/TiO2-derivates were conducted to show the enhancement of absorption in the visible region and their corresponding photocatalytic properties, which was explained by the synergistic effect of introduced components [36-40]. Nevertheless, the mechanism of the synergistic effect, as well as the confinement effect in some tubular structures remained to be further investigated.
Reported herein are the controlled synthesis, characterization of CdS-decorated titanate nanotubes and nanoribbons and detailed investigation of the synergistic and confinement effects on their corresponding activities in H2 generation under visible light irradiation. The CdS nanoparticles embedded in sodium titanate nanotubes showed not only the synergistic effect but also the confinement effect on better photoactivities in H2 generation than that of surficial doping of CdS on titanate nanotubes and nanoribbons.
During our experimental procedures, all chemicals are analytic grade from Sinopharm Chemical Reagent Co., Ltd. and used without any purification. For the preparation of CdS-embedded titanate nanotubes (CdS-ETNTs), a two-step method is applied. In the first step, tubular nanostructures of sodium titanate were prepared following the reported method [41] with a little modification. 2 g of P25 (Degussa Chemical Co., Ltd., Germany) was transferred into an 80 mL poly-tetrafluoroethylene autoclave containing 50 mL of 10 mol/L NaOH solution. The mixture was sonicated for 14 h, followed by the hydrothermal treatment at 140 ℃ for 48 h. After naturally cooled down to room temperature, the precipitate was collected and washed with deionized water until the pH value was about 7. The white powder was dried at 70 ℃ to obtain sodium titanate nanotubes (TNTs). In the second step, 0.5 g of TNTs was immersed in 50 mL of 2.0 mol/L Cd(CH3COO)2 solution and sonicated for 4 h. The precipitate was immersed in deionized water for 12 h before filtration. Then 50 mL of 0.2 mol/L thiourea (NH2CSNH2) solution was introduced to the precipitate with stirring for 30 min. The reaction was carried out at 70 ℃ for 120 min and then the product was filtered and purified by immersion in deionized water for 24 h. The resulting yellowish powder was obtained by drying at 90 ℃ overnight as CdS-ETNTs.
As for preparation of CdS-doped titanate nanotubes (CdS-DTNTs), 13.5 mL of tetrabutyl titanate was slowly added dropwise into the 40 mL of 10 mol/L NaOH solution with controlled temperature at 40 ℃. Then the mixture was transferred to an 80 mL polytetrafluoroethylene autoclave and reacted at 150 ℃ for 24 h. Titanate nanotubes were also obtained with smaller inner diameter. The details of the workup and doping CdS are similar as that of CdS-ETNT. The corresponding composite was CdS doped titanate nanotubes and named as CdS-DTNTs.
In the preparation of CdS-doped titanate nanoribbons (CdS-DTNRs), the procedure was only modified in the reaction temperature and time. 13.5 mL of tetrabutyl titanate was added dropwise into the 40 mL of 10 mol/L NaOH solution at 40 ℃, which was further reacted in a 80 mL polytetrafluoroethylene autoclave at 200 ℃ for 24 h. After reaction, the precipitate was collected, washed with deionized water and dried at 60 ℃. 0.5 g Titanate nanoribbons were added into 50 mL solution containing 0.02 mol/L Cd(NO3)2 and 0.05 mol/L glutathione under continuously stirring for 24 h. The formed solution was sealed in an 80 mL autoclave for 24 h reaction at 100 ℃. Yellow powder of CdS doped titanate nanoribbons was collected after the typical workup and marked as CdS-DTNR.
After experiments, X-ray diffraction (XRD) characterization was performed on a Rigaku X-ray powder diffractometer (Cu Kα target, λ = 0.15406 nm, 40 kV, 20 mA). High resolution transmission electron microscopy (HRTEM) analysis was conducted on JEM-2010 (Japan Electronics Co., Ltd.). UV–vis diffuse reflectance spectroscopy (DRS) analysis was recorded on a Shimadzu UV-2450 spectrophotometer. Brunauer-Emmett-Teller (BET) measurement was conducted with Quanta Chrome NOVA1000.
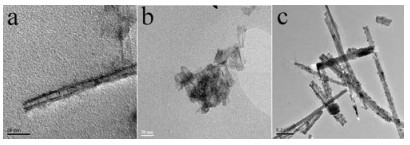
Photocatalytic hydrogen production performance was performed on a self-made vacuum quartz-glass reactor (350mL). A solution containing 0.15 g of photocatalyst, 20 mL of H2O, 10 mL of 0.35 mol/L Na2SO3, 10 mL of 0.25 mol/L Na2S and 5 mL of 0.1 mg/mL H2PtCl6·6H2O was added into the reactor for photoactivity evaluation. The reaction was maintained at room temperature (20–25 ℃) with cooling water under vacuum. A 300W Xe lamp was used with filter cut-off (λ > 400 nm) from Beijing Changtuo Technology to give the light intensity of 5 mW/cm2. The produced gas was quantitatively evaluated by gas chromatography (Huaai chromatography 9160 with thermal conductivity detector (TCD), 5A molecular sieve packed column and argon as carrier gas). CdS decorated sodium titanate composites were based on the structural difference of the titanate structures as shown in Fig. 1. After the top-down construction of sodium titanate nanotubes with P25, the titanate nanotubes with bigger inner diameter were shown in Fig. 1a. However, titanate nanotubes from tetrabutyl titanate under almost the same hydrothermal condition revealed the smaller inner diameter (Fig. 1b). The diameter of CdS-ETNTs is about 10 nm, and the length is about several micrometers in Fig. 1a. Moreover, the wall thickness of the single layer is about 1 ~ 2 nm and CdS nanoparticles were located on the inner wall of nanotubes marked by red arrows with a size about 3 ~ 4 nm. For the morphology of CdS-DTNTs as shown in Fig. 1b, the tubular nanostructures are much smaller than that from the up-down approach in Fig. 1a and agglomerated together. Therefore, CdS nanoparticles are accumulated on the surface of these smaller nanotubes marked by red arrow in Fig. 1b. Sodium titanate nanoribbons (TNRs) were obtained at higher reaction temperature using the bottom-up procedure and CdS doped TNRs were synthesized with the almost similar approach except that the glutathione (GSH) was applied as the sulfur sources. As shown in Fig. 1c, CdS nanoparticles were uniformly dispersed on the nanoribbons with a size of 10 ~ 15 nm, and no CdS nanoparticles were peeled off from TNRs through electron microscopic observation, it might be inferred that excess GSH in the experimental design modified the surface of TNRs to form strong interactions with CdS nanoparticles.

|
Download:
|
| Fig. 1. TEM images of (a) CdS-ETNTs, (b) CdS-DTNTs and (c) CdS-DTNRs. | |
XRD measurements were performed to investigate the phase structure of composites. As shown in Fig. 2, CdS-ETNTs, CdS-DTNTs and CdS-DTNRs showed the characteristic peaks of sodium titanate (Na2TinO2n+1) including Na2Ti3O7, Na2Ti4O9 and Na2Ti9O19 structures (with JCPDS Nos. 31-1329, 33-1294, and 33-1293, respectively). However, no TiO2 phase was founded in XRD patterns in accordance with the experimental design.

|
Download:
|
| Fig. 2. XRD patterns of CdS-ETNTs, CdS-DTNTs and CdS-DTNRs. (●: Na2Ti3O7 JCPDS No. 31-1329, ◆: Na2Ti4O9 JCPDS No. 31-1294, *: Na2Ti9O19 JCPDS No. 31-1293). | |
Although the mass fraction of CdS in CdS-ETNTs was found to be 13.44% by inductively coupled plasma (ICP) detection, no obvious characteristic peaks of CdS were indexed in XRD measurement, which was possibly explained by the fact that CdS nanoparticles were embedded in the inner structure of sodium titanate nanotubes. Comparably, CdS nanoparticles in CdS-DTNTs and CdS-DTNRs were located on the surface of titanate nanostructure and the mass fractions of CdS were found to be 8.32% and 12.72% by ICP determinations, respectively. Therefore, the lower content of CdS in the composites led that no characteristic peaks of CdS were observed in the XRD measurements.
Elemental composition and chemical state were examined by X-ray photoelectron spectroscopy (XPS) analysis (Fig. S1 in Supporting information) with the two representatives, e.g., nanotubes and nanoribbons structures. From the overall spectra, Ti, Cd, S and O elements were observed in accordance with our experimental design. The signal of C element mainly came from the hydrocarbon contamination in the instrument. The binding energy of C 1s is about 286.4 eV (usually the reference binding energy of C 1s is 284.6 eV), indicating the charge effect. Moreover, the electric displacement is about 1.8 eV.
From the high resolution XPS analysis of CdS-ETNTs and CdS-DTNRs, the binding energy of O 1s orbitals are located at 531.6 eV. Moreover, the Ti 2p orbitals can be fitted to two peaks of Ti 2p3/2 and Ti 2p1/2 orbitals with the corresponding binding energy 459 eV and 464.8 eV, respectively. As for Cd and S elements in CdS-ETNTs and CdS-DTNRs, two peaks of Cd 3d5/2 and Cd 3d3/2 were obtained by XPSpeak4.1 software with the binding energies being 406.4 eV and 413.2 eV, respectively. The two splitting peaks of S 2p3/2 and S 2p1/2 were obtained and the binding energies were 161.9 eV and 163.1 eV, respectively. Comparably, the distance (△) between Cd 3d5/2 and Cd 3d3/2 and that between S 2p3/2 and S 2p1/2 was 6.6 eV and 1.2 eV, respectively, which was in accordance with the reported literature [18]. Further investigation illustrated that the molar ratio of Cd to S was 1.2:1 in CdS-ETNTs. Therefore, the mass fraction of CdS in CdS-ETNTs was calculated to be 3.55% by XPS analysis, which was relatively lower than 13.44% by ICP analysis. The results also indicated that the CdS nanoparticles entered the internal of the sodium titanate nanotubes through TEM observations. In addition, the molar ratio of Cd to S in CdS-DTNRs was 1:1 and the mass fraction of CdS was 12.14%, which was almost the same with the value (12.72%) measured by ICP.
From the isothermal adsorption-desorption curves in Fig. S2 (Supporting information), specific surface areas and pore size distributions of three different samples are revealed. CdS-ETNTs exhibited hysteresis loops of H3 type at relative higher-pressure range (0.4-1.0), where the adsorption capacity was still increasing. It could be explained as the model of slit-type pore structures by accumulation of flaky particles [31]. CdS-DTNTs showed the adsorption-desorption isotherm of type Ⅳ. The capillary condensation occurred in mesopores at relative higher relative pressure and capillary evaporation happened at another different pressure, which led to a typical hysteresis loop of type Ⅳ isotherm. As for CdS-DTNRs, no obvious hysteresis loop of adsorption-desorption isotherm was observed, indicating that no pore structure existed. The specific surface areas of CdS-ETNTs, CdS-DTNTs and CdS-DTNRs were 287, 230 and 30 m2/g, respectively, which were consistent with the electron microscopic observation and larger than those from reported work [42]. The corresponding BarrettJoyner-Halenda (BJH) pore size distributions of CdS-ETNTs, CdS-DTNTs and CdS-DTNRs were plotted in Fig. S2b, indicating the nature of the morphological differences of CdS-decorated titanate nanostructures.
Shown in Fig. S3a (Supporting information) are the UV–vis absorption spectra of CdS-decorated titanate nanostructures. In the visible and ultraviolet regions, all the samples have two absorption edges, indicating the coexistences of two kinds of semiconductor materials. The absorption edge of the UV region is attributed to the absorption of the titanate structures. Moreover, introduction of CdS nanoparticles enhances the good absorptive capacities in visible regions. Specifically, the visible absorption edge is about 440 nm for CdS-ETNTs. Compared with CdS-DTNTs and CdS-DTNRs, a blue shift occurs, which could be explained by the quantum size effect aroused by the embedded CdS in nanotubular structures. The absorption edges of both CdS-DTNTs and CdS-DTNRs are close to 500 nm near that of bulk CdS, which might be attributed to the accumulation of CdS nanoparticles on the surface of sodium titanate nanostructures. As shown in Fig. S3b (Supporting information), fluorescence emission spectra of CdS-ETNTs, CdS-DTNTs and CdS-DTNRs at 398 nm excitation were recorded with similar photoluminescence (PL) peaks.
At high energy region (λ = 525 nm), the photoluminescence peak resulted from the recombination of photo-generated electron-hole pairs from CdS nanoparticles. The corresponding PL peaks at low energy region (λ = 580 nm) can be attributed to the excitation of electron donors or the shallow trapping of electronhole pairs, which usually implies certain internal features or surface defects of CdS nanocrystals [32]. The intensities of fluorescence emission spectra follow the certain order, i.e., CdS-ETNTs < CdS-DTNTs < CdS-DTNRs, revealing the general relationship between photocatalytic capacity and fluorescence spectrum intensity [10].
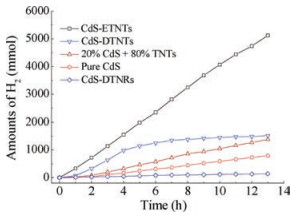
Photocatalytic activities of H2 production are evaluated to reveal the synergistic effects as shown in Fig. 3. CdS-ETNTs reveal the best photocatalytic activities, i.e., a cumulative hydrogen production of 5118μmol in 13 h and an average rate of 402 μmol/h hydrogen generation. The H2 production performance of CdS-DTNTs is comparatively lower than that of CdS-ETNTs because of the relatively smaller BET surface area, which also explains the lowest photocatalytic activities of CdS-DTNRs in H2 generation.

|
Download:
|
| Fig. 3. H2 evolution curves from CdS-ETNTs, CdS-DTNTs, 20 wt% CdS and 80 wt% TNTs mixtures, pure CdS and CdS-DTNRs. | |
Pure CdS nanoparticles, together with physical mixtures of 20 wt% CdS and 80 wt% TNTs are applied to evaluate the performance of the photocatalytic H2 generation. Except for CdS-DTNRs, CdS-decorated titanate nanostructures show higher photoactivities than that of pure CdS. Moreover, the mixture of 20 wt% CdS and 80 wt% TNTs was used to evaluate the synergistic effect of decorated CdS nanoparticles. Apparently, CdS-ETNTs reveal almost 3.8 and 10 times higher than that of the physical mixtures and pure CdS, respectively. As for CdS-DTNTs, from the H2 generation curves in Fig. 3, the photocatalytic activities remained similar with that of CdS-ETNTs at the beginning of 4 h and decreased apparently after that. The reason is possibly due to CdS bleaching from the surface of the titanate nanostructures, suggesting the synergistic effect of the decorated CdS. The performance of the physical mixture of 20 wt% CdS and 80 wt% TNTs further confirmed the synergistic effect instead of physical blending. Moreover, CdS nanoparticles inside the TNTs in CdS-ETNTs, revealed the confinement effect, which results in the small size distribution, quickly transformation of photoexcited electrons to sodium titanate nanotubes and the inhibition of recombination of photoexcited electron-hole pairs. As for CdS-DTNTs, the bleached CdS nanoparticles after 4 h decreased their synergistic effect, leading that the photoexcited electrons hardly transfered to the conduction band of titanate nanostructures. Therefore, their corresponding photoactivities in H2 generation decreased.
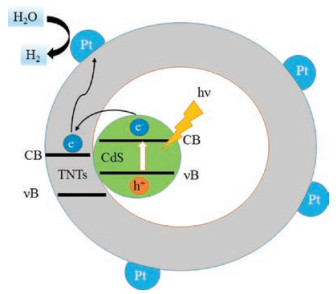
Shown on Fig. 4 is a schematic diagram of Pt-supported CdS-ETNTs in photocatalytic hydrogen production process. The internal CdS is excited by visible light irradiation to generate electron-hole pairs. Because of the confinement effect in the tubular structures, the small CdS particles facilitate the photo-generated carriers' migration and restrain the recombination of photoexcited electron-hole pairs. Moreover, the suitable matching of the conducting band between CdS and sodium titanate promotes the facile transformation of the photoexcited electrons to the surface of sodium titanate nanotubes, which helps to generate H2 in water solution.

|
Download:
|
| Fig. 4. Illumination of H2 evolution mechanism of CdS-ETNTs. | |
Meanwhile, the additional S2- and SO32- ions were used as the hole scavengers and acted as the introduced origin of the S defects on the surface to suppress photocorrosion. The proposed mechanism keeps in accordance with the best photocatalytic activity of H2 evolution from CdS-ETNTs nanostructures.
In conclusion, CdS-ETNTs, CdS-DTNTs and CdS-DTNRs were synthesized based on the alkaline hydrothermal and ion-exchange methods through up-down and bottom-up approaches. The microstructure, electronic structures and surface properties were investigated by TEM, XRD, UV-vis, BET, XPS and ICP measurements. Their corresponding photocatalytic activities of H2 generation by water splitting were explored. The H2 evolution performance of CdS-ETNTs was superior among these CdS-decorated titanate nanostructures. The confinement effect of the tubular structures led to uniform CdS nanoparticles with much smaller size distribution in the sodium titanate nanotubes. The corresponding synergistic effect was also explored by comparing the H2 production performance with that from pure CdS and the physical blending of 20 wt% CdS and 80 wt% TNTs. The results properly revealed that the surface properties, specific nanostructures and the known synergistic effect simultaneously affected their photocatalytic properties, which guided us to achieve better experimental design in H2 generation.
AcknowledgmentsThe work was financially supported by the Natural Science Foundation of China (No. 81660708), Natural Science Foundation of Jiangsu Province of China (Nos. BK20150692, BK20171389), the Key Project of Science and Technology of Tibet (No. 2015XZ01G70), the Key Project of Tibet Tibetan Medicine Bureau (No. 2017005) and open fund by Jiangsu Engineering Technology Research Center of Environmental Cleaning Materials (No. KHK1507), a Project Funded by the Priority Academic Program Development of Jiangsu Higher Education Institutions (PAPD).
Appendix A. Supplementary dataSupplementary data associated with this article can be found, in the online version, at https://doi.org/10.1016/j.cclet.2017.11.030.
| [1] |
A. Kudo, Y. Miseki, Chem. Soc. Rev. 38 (2009) 253-278. DOI:10.1039/B800489G |
| [2] |
M. Kitano, M. Hara, J. Mater. Chem. 20 (2010) 627-641. DOI:10.1039/B910180B |
| [3] |
F.E. Osterloh, Chem. Mater. 20 (2008) 35-54. DOI:10.1021/cm7024203 |
| [4] |
Y. Zhao, N. Hoivik, K. Wang, Nano Energy 30 (2016) 728-744. DOI:10.1016/j.nanoen.2016.09.027 |
| [5] |
C.T. Dinh, T.D. Nguyen, F. Kleitz, T.O. Do, ACS Nano 3 (2009) 3737-3743. DOI:10.1021/nn900940p |
| [6] |
M. Ge, C. Cao, J. Huang, et al., J. Mater. Chem. A 4 (2016) 6772-6801. DOI:10.1039/C5TA09323F |
| [7] |
C. Liu, L. Zhang, R. Liu, et al., J. Alloys Compd. 656 (2016) 24-32. DOI:10.1016/j.jallcom.2015.09.211 |
| [8] |
R. Dong, Q. Zhang, W. Gao, A. Pei, B. Ren, ACS Nano 10 (2016) 839-844. DOI:10.1021/acsnano.5b05940 |
| [9] |
Y. Li, X. Wei, B. Zhu, et al., Nanoscale 8 (2016) 11284-11290. DOI:10.1039/C6NR02430K |
| [10] |
Y. Liu, Q. Yao, X. Wu, et al., Nanoscale 8 (2016) 10145-10151. DOI:10.1039/C6NR01702A |
| [11] |
F. Sauvage, F. Di Fonzo, A.L. Bassi, et al., Nano Lett. 10 (2010) 2562-2567. DOI:10.1021/nl101198b |
| [12] |
Y. Liu, S. Shen, F. Ren, et al., Nanoscale 8 (2016) 10642-10648. DOI:10.1039/C5NR05594F |
| [13] |
M. Kulmas, L. Paterson, K. Hoeflich, et al., Adv. Funct. Mater. 26 (2016) 4882-4889. DOI:10.1002/adfm.201505524 |
| [14] |
X. Lu, X. Li, J. Qian, et al., J. Alloys Compd. 661 (2016) 363-371. DOI:10.1016/j.jallcom.2015.11.148 |
| [15] |
L. Pan, S. Wang, J. Xie, et al., Nano Energy 28 (2016) 296-303. DOI:10.1016/j.nanoen.2016.08.054 |
| [16] |
J.J. Plata, J. Graciani, J. Evans, J.A. Rodriguez, J. Fernandez Sanz, ACS Catal. 6 (2016) 4608-4615. DOI:10.1021/acscatal.6b00948 |
| [17] |
J. Li, X. Liu, Z. Sun, L. Pan, J. Colloid Interface Sci. 463 (2016) 145-153. DOI:10.1016/j.jcis.2015.10.055 |
| [18] |
R. Ostermann, D. Li, Y.D. Yin, J.T. McCann, Y.N. Xia, Nano Lett. 6 (2006) 1297-1302. DOI:10.1021/nl060928a |
| [19] |
Q. Wu, F. Huang, M. Zhao, et al., Nano Energy 24 (2016) 63-71. DOI:10.1016/j.nanoen.2016.04.004 |
| [20] |
R. Asahi, T. Morikawa, T. Ohwaki, K. Aoki, Y. Taga, Science 293 (2001) 269-271. DOI:10.1126/science.1061051 |
| [21] |
X.Z. Li, F.B. Li, Environ. Sci. Technol. 35 (2001) 2381-2387. DOI:10.1021/es001752w |
| [22] |
F. Dong, W.R. Zhao, Z.B. Wu, Nanotechnology 19 (2008) 365607. DOI:10.1088/0957-4484/19/36/365607 |
| [23] |
J.Q. Yan, G.J. Wu, W.L. Dai, N.J. Guan, L.D. Li, ACS Sustain. Chem. Eng. 2 (2014) 1940-1946. DOI:10.1021/sc500331k |
| [24] |
M.G. Wang, Y.M. Hu, J. Han, et al., J. Mater. Chem. A 3 (2015) 20727-20735. DOI:10.1039/C5TA05839B |
| [25] |
L. Wu, J.C. Yu, X. Fu, J. Mol, Catal. A Chem. 244 (2006) 25-32. DOI:10.1016/j.molcata.2005.08.047 |
| [26] |
J.H. Li, S.B. Lv, Y.B. Liu, et al., J. Hazard. Mater. 262 (2013) 482-488. DOI:10.1016/j.jhazmat.2013.09.002 |
| [27] |
Y.B. Liu, J.H. Li, B.X. Zhou, et al., Chem. Commun. 47 (2011) 10314-10316. DOI:10.1039/c1cc13388h |
| [28] |
N.P. Thuy-Duong, S. Luo, D. Voychok, et al., ACS Catal. 6 (2016) 407-417. DOI:10.1021/acscatal.5b02318 |
| [29] |
L. Zheng, S. Han, H. Liu, P. Yu, X. Fang, Small 12 (2016) 1527-1536. DOI:10.1002/smll.v12.11 |
| [30] |
X. Wei, C. Shao, X. Li, et al., Nanoscale 8 (2016) 11034-11043. DOI:10.1039/C6NR01491G |
| [31] |
N. Liu, V. Haeublein, X. Zhou, et al., Nano Lett. 15 (2015) 6815-6820. DOI:10.1021/acs.nanolett.5b02663 |
| [32] |
X. Wang, R. Long, D. Liu, et al., Nano Energy 24 (2016) 87-93. DOI:10.1016/j.nanoen.2016.04.013 |
| [33] |
W. Wang, J. Dong, X. Ye, et al., Small 12 (2016) 1469-1478. DOI:10.1002/smll.v12.11 |
| [34] |
M. Sun, Y. Wang, Y. Fang, S. Sun, Z. Yu, J. Alloys Compd. 684 (2016) 335-341. DOI:10.1016/j.jallcom.2016.05.189 |
| [35] |
L. Tang, Y. Deng, G. Zeng, et al., J. Alloys Compd. 662 (2016) 516-527. DOI:10.1016/j.jallcom.2015.11.206 |
| [36] |
M. Hodos, E. Horv'ath, H. Haspel, et al., Chem. Phys. Lett. 399 (2004) 512-515. DOI:10.1016/j.cplett.2004.10.064 |
| [37] |
H. Li, B.L. Zhu, Y.F. Feng, et al., J. Solid State Chem. 180 (2007) 2136-2142. DOI:10.1016/j.jssc.2007.05.013 |
| [38] |
A. Kukovecz, M. Hodos, Z. K'onya, I. Kiricsi, Chem. Phys. Lett. 411 (2005) 445-449. DOI:10.1016/j.cplett.2005.06.073 |
| [39] |
M. Xiao, L. Wang, Y. Wu, X. Huang, Z. Dang, Nanotechnology 19 (2008) 245. |
| [40] |
Y.B. Liu, H.B. Zhou, B.X. Zhou, et al., Int. J. Hydrog. Energy 36 (2011) 167-174. DOI:10.1016/j.ijhydene.2010.09.089 |
| [41] |
A. Nakahira, T. Kubo, C. Numako, Inorg. Chem. 49 (2010) 5845-5852. DOI:10.1021/ic9025816 |
| [42] |
J. Huang, Y. Cao, Q. Huang, et al., Cryst. Growth Des. 9 (2009) 3632-3637. DOI:10.1021/cg900381h |