 2018, Vol. 29


b Minzu University of China, Beijing 100081, China;
c School of Life Sciences, Beijing University of Chinese Medicine, Beijing 100029, China
Dalbergia odorifera T. Chen (Leguminosae) is a species of Dalbergia, which is endemic in Hainan province, China. It is also known as Hainan Huanghuali wood. Its distinctive color and texture make it used to make furniture and artware [1-4]. Meanwhile, it is also highly desirable owing to the medicinal applications of D. odorifera [5-7]. D. odorifera has been widely used since Ming Dynasty.Due to the over-exploitation, D.odorifera is now threatened with extinction. In addition, the strong market demand and slow growth for D. odorifera is making fake production. D. stevensonii is particularly similar to D. odorifera in appearance and anatomy characteristics. It is difficult to distinction them through traditional methods due to their similar wood anatomy. Furthermore, these two species are all listed in the Appendix? of Convention on International Trade in Endangered Species (CITES) of Wild Fauna and Flora. Thus, it is important to discriminate D. odorifera from the counterfeit by adopting rapid and accurate methods.
Traditional wood identification method was mainly conducted from the perspective of anatomy and physics and it was less commonly carried out in terms of chemistry. However, wood, as a matter of fact, contains plenty of chemical information, especially extractives containing a lot of aliphatic compounds, terpenoids and aromatic compounds. The extractives of different wood species in the structure or content have a significant difference [8]. Previous studies have shown that differentiation based on the qualitative evaluation of the ethanol-benzene extractives is more promising than the evaluation of the spectroscopic data of the whole wood [9-12]. This identification method based on chemical analysis is also known as chemotaxonomy [8, 13].
Two-dimensional correlation infrared (2D-IR) spectroscopy was proposed by Noda in 1986 [14]. And it now has been successfully applied in the analysis of polymers, biological molecules and materials, traditional Chinese medicine, etc. It can reveal tiny differences among similar samples [15, 16]. A trilevel infrared spectroscopic identification was established [17-21], which was used to distinguish wood species for the first time in 2008 [22], and then extractives were studied by Fourier transform infrared (FTIR) spectroscopy, second derivative infrared (SD-IR) spectroscopy and 2D-IR spectroscopy [12, 23, 24]. As a rapid and effective analysis method of chemical taxonomy, the IR spectra have highly characteristic in the qualitative aspects of functional groups. Gas chromatography-mass spectrometry (GC/MS), as a way of analyzing chemical components, is based on matching properties for chemical identification. The concentration information and the spectrum information of each component in the system can be obtained. Previous studies have demonstrated that GC/MS is an effective way for wood classification and identification based on characteristic component of extractives through the chemical analysis [12, 25, 26]. Nuclear magnetic resonance (NMR) as an analysis method of compounds structure, the molecular structure information can be a very intuitive response. Meanwhile, it is not affected by sample polarity and volatile. NMR has been widely used in identification of traditional Chinese medicine, while it can be also applied in analysis in extracts of wood [27].
This paper aims to explore FTIR, NMR and GC/MS to profiling and identification D. odorifera and D. stevensonii and may provide a means for identification of extremely similar species accurately and effectively. Their ethanol-benzene extractives were analyzed.
D. odorifera and D. stevensonii were provided by Research Institute of Wood Industry, Chinese Academy of Forestry, China. The heartwoods were dried and ground into powder according to the crusher with BJ-300A. The wood powder with a dimension between 40 and 60 meshes was collected for extraction. Successive extraction was done in a Soxhlet apparatus. Then, benzene-alcohol solvents in the extractives were removed under reduced pressure for further analysis.
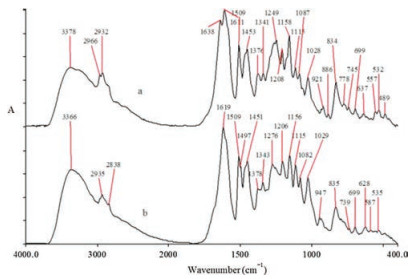
The major functional groups of substances removed from the heartwood of the two species by ethanol-benzene solvent have been used to distinguish the differences. Fig. 1 shows the FTIR spectra of the extractives by ethanol-benzene solvent under a room temperature. FTIR spectrum were obtained by spectrum GX FTIR spectrometer, PerkinElmer, equipped with a DTGS detector at room temperature.

|
Download:
|
| Fig. 1. FTIR spectra of ethanol-benzene extractives of D. odorifera (a) and D. stevensonii (b). | |
In the region of 3600–2800 cm-1, all spectra show a strong, broad O-H stretching band around 3378 cm-1 and methylene stretching band around 2932 cm-1. C-H stretching band around 2966 cm-1 due to antisymmetric C-H stretching vibration of methyl can only be found in the case of D. odorifera.
Within the region of 1800–800 cm-1, bands around 1638, 1249, 921 and 886 cm-1 are assigned to C=O stretching of flavones, asymmetric C-O-C stretch, C-H out-of-plane bending of alkene and C-O stretching are unique for D. odorifera respectively. In contrast, aromatic skeletal stretching at 1497 cm-1 and O-H outof-plane bending at 947 cm-1 appear in D. stevensonii. Detailed peak positions and assignments of the extractives are listed in Table S1 (Supporting information) [9, 12, 28].
Fig. 2 shows the SD-IR spectra of the ethanol-benzene extractives of D. odorifera and D. stevensonii. The SD-IR spectra were acquired after 13 points smoothing of the original spectra by applying the derivative function of the spectrum to Window software (PerkinElmer Corporation). Generally, the second derivative spectrum can enhance the apparent resolution and amplify subtle differences in ordinary IR spectra. It can separate some overlapped peaks, which are not visible in the original spectra. As shown in Fig. 2, bands around 1510, 1208 and 1158 cm-1 are typical for the two species, which is assigned to the C-C stretch within ring skeleton, saturated ester groups or vinyl/phenyl acetate and saturated ester C-O stretch. The peaks of D. odorifera at 1452 cm-1 (skeletal C-C stretching) and 1158 cm-1 (saturated ester C-O stretch) is more intensive than original spectra. Middle intense peaks at 1475 cm-1 (CH2 scissoring) and 1180 cm-1 (saturated ester C-O stretch) can be observed in the spectra of D. odorifera, while D. stevensonii is visible at 1473 cm-1. This spectrum is not observed in the original spectra. Moreover, the peaks at 1381 cm-1 and 1291 cm-1 of D. stevensonii are also not visible in the original spectra.

|
Download:
|
| Fig. 2. SD-IR spectra in the range of 1600–1000 cm-1: D. odorifera (a) and D. stevensonii (b). | |
The 2D-IR spectroscopy can considerably enhance the resolution of spectrum and provide more information by means of thermal perturbation of the samples. Previous studies demonstrated that this method is useful and can identify differences more remarkably and convincingly for complex compounds. 2D-IR correlation spectra were generated by the treatment of the series of dynamic spectra with 2D-IR correlation analysis software developed by Tsinghua University, Beijing, China.
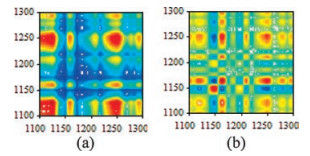
Fig. 3 shows 2D-IR spectra of the ethanol-benzene extractives in the range of 1100–1300 cm-1 from 50 ℃ to 120 ℃. In synchronous spectrum, the auto-peaks on the diagonal line show the selfcorrelativity and susceptibility of some normal vibration of functional group with the increasing temperature. All spectra show that a middle cross auto-peak at 1208 cm-1 is assigned to saturated ester groups or vinyl/phenyl acetate, a strong auto-peak at 1250 cm-1 due to asymmetric C-O-C stretching which is possibly attributable to the phenolic compound, and a weak peaks at 1292 cm-1 belongs to C-O stretching of long-chain fatty acids.In addition, D. odorifera has three auto-peaks at 1148, 1121 and 1162 cm-1 and one cross-peaks at 1279 cm-1, while D. stevensonii has a strong auto-peak at 1123 cm-1, a middle auto-peak at 1158 cm-1 and a weak cross auto-peaks at 1277 cm-1.

|
Download:
|
| Fig. 3. Synchronous 2D-IR correlation spectra in the range of 1100–1300 cm-1: D. stevensonii (a) and D. odorifera (b). | |
1H NMR spectrum and 1H NMR spectrum with D2O of extractives of the two species are listed in Fig. S1 (Supporting information). The ethanol-benzene extractives were dissolved in 1 mL DMSO-d6 (deuterated ratio 99.9%), and then were transferred into a capacity of 5 mL nuclear magnetic tube, they were exchanged twice in 0.5 mL D2O continuously. 1H NMR spectrum and 13C NMR spectrum were recorded with a Bruke-Avance 600 nuclear magnetic resonance spectrometer at 25 ℃ respectively.
In the low field region (δH 10.0 ~ 14.0) of 1H NMR spectrum, phenol hydroxyl signals in D. odorifera appeared at about δH 10.5 ~11.0, 11.8 ~ 12.4 and 12.6 ~13.6. Although the extracts of D. stevensonii also showed similar hydroxyl signals in this area, the intensity of which was smaller than that of D. odorifera. The extracts of D. stevensonii also showed hydroxyl signals around δH 9.50, while no signals appeared in the spectrum of D. odorifera. D2O was added into the two samples and then the 1H NMR of them were recorded 12 hours later. Lively hydrogen has a displacement and signal disappears after placed 12 h, which can be used to ensure the types of certain signals. Compared with their original spectra, both samples showed changes in δH 9.5-13.6. The integral area of signals in δH 10.5–13.6 of D. odorifera decreased, while the integral area of signals in those fields of D. stevensonii almost disappeared, showing that the hydroxyl protons in D. stevensonii exchanged easier than those in D. odorifera. Thus, it could be proposed that some intermolecular or intramolecular hydrogen bonds existed in hydroxyl protons in D. odorifera. There were a large number of aromatic signals in δH 6.00 ~ 7.80 in both D. odorifera and D. stevensonii. The coupling relationship of aromatic signals in D. odorifera were more like ortho AB system, while those of D. stevensonii were more like ortho relationship, indicating the two types of substitution on the benzene in the two trees were different. In the oxygenated proton region, D. odorifera and D. stevensonii showed similar signals of proton on oxygenated carbons at δH 4.15, 4.40, 4.50, 4.92, 5.90, as well as signals at δH 3.80 ~ 4.00, which were methoxy on benzene. At δH 2.50 ~ 3.00, D. odorifera showed signals which are coupled with methyl groups at δH 1.00 ~ 1.70, attributing to terpenoids and steroids in the tree. However, there was no signal in those regions of D. stevensonii.
As shown in the 13C NMR spectrum (Fig. S2 in Supporting information), there were strong carbonyl signals at δC 198 in the sample of D. odorifera, while the carbonyl of D. stevensonii appeared weakly at δC 191. Moreover, only D. odorifera showed ester carbonyl at δC 175 and 180. There were more types of aromatic carbon signals δC 110 ~150 in D. odorifera than in D. stevensonii. In δC 80.0 ~110, D. odorifera showed more oxygenated carbons than D. stevensonii. Finally, methyl carbon signals δC 14.0 ~ 30.0 appeared in the spectra of D. odorifera, while only weak signals at δC 18.8 and 30.0 appeared in the spectra of D. stevensonii. The 13C NMR data were consistent with the 1H NMR. In summary, phenylpropanoids in D. odorifera should have carbonyls, and its phenolic hydroxyls were stable. Carbonyls of phenylpropanoids in D. stevensonii were smaller in quantity. The phenolic hydroxyls in D. stevensonii were larger in quantity and easy to exchange with other hydrogen in the solvent. The substance causing the chemical shift are listed in Table 1.
|
|
Table 1 The substance caused the chemical shift by NMR. |

The identified compounds and their relative content of extractives are listed in Table 2. The GC/MS analysis was conducted on a 7890A gas chromatograph (Agilent Technologies, Santa Clara, CA, U.S.A.) linked to a 5975C mass selective detector (Agilent Technologies, Santa Clara, CA, U.S.A.) and the silica capillary column (30 m, 0.25 mm i.d., 0.25 μm film thickness). Peak assignment was accomplished by library spectra (NIST 2008).
|
|
Table 2 Chemical composition of extractives analyzed by GC/MS. |

Their chemical compositions of extract mainly include fatty acids, terpenes, phytosterols, esters, tannins, flavonoids, hydrocarbon, carbohydrates, and the main components of extractives are aromatic, aliphatic and terpenes compounds [6, 10]. D. odorifera and D. stevensonii have six identical chemical compositions. The relative content of the same composition is different. The main components of D. odorifera is 1, 6, 10-dodecatrien-3-ol, 3, 7, 11- trimethyl, (E)-, while D. stevensonii is 6H-benzofuro[3, 2-c][1] benzopyran-3-ol, 6a, 11a-dihydro-9-me, (6aR-cis)-. The previous study has shown that D. odorifera mainly contain flavonoids and phenols [29-32], which can be demonstrated by 4H-1-benzopyran-4-one, 2, 3-dihydro-5, 7-dihydroxy-2phenyl-, (S)-, 6H-benzofuro[3, 2-c][1]benzopyran-3-ol, 6a, 11a-dihydro-9-me, (6aR-cis)- and 4'-methoxy-5, 7-dihydroxy isoflavone. Moreover, the following compositions are specific for D. odorifera: triacetin, naringenin, 4'-methoxy-5, 7-dihydroxy isoflavone and 2-propen-1-one, 1-one, 1- (2, 6-dihydroxy-4-methoxyphenyl)-3-phenyl-, (E)-. Scientific theory basis was provided for wood chemical classification and identification by analyzing and comparing characteristic compositions of fingerprint.
Three-level FTIR spectroscopy, NMR and GC/MS are all suitable techniques to analyze the structure characteristics of the compounds, which canbeused todistinguish D. odorifera from D. stevensonii based on their ethanol-benzene extractives. With implementing the three-level infrared spectroscopy analysis step by step, the two species can be quickly and effectively distinguished via the difference of functional groups. The bands at 1638, 1249, 921 and 886 cm-1 are specific for D. odorifera, which can be used for identification.Moreover, theband at1148 cm-1 is strongandunique for D. odorifera in 2D-IR. The GC/MS data show that D. odorifera can be differentiated from D. stevensonii mainly based on the four additional components, though many compositions are common. Serving as a supplement and development, NMR can provide detailed connection information of the compound skeleton and the functional groupsbyboth 1HNMR spectrum and 13CNMR spectrum, which can also be a useful tool for wood identification. 1H NMR spectrum at δ 1.00 ~ 1.70, 2.5 ~ 3.0 and 9.5 and 13C NMR spectrum at δ 175, 180 canbeused todifferentiateD. odorifera from D. stevensonii. These three methods are complementary to each other, which may be an important means to differentiate the quite similar species more accurately and effectively.
AcknowledgmentThis work was supported by the National Natural Science Foundation of China (No. 31670564).
Appendix A. Supplementary dataSupplementary data associated with this article can be found, in the online version, at https://doi.org/10.1016/j.cclet.2017.11.007.
| [1] |
M.A. Barrett, J.L. Brown, A.D. Yoder, Nature 499 (2013) 29. |
| [2] |
H.L. Huang, F.S. Li, H.D. Huang, Agric. Sci. Technol. 16 (2015) 2042-2539. |
| [3] |
M. Yu, K. Liu, L. Zhou, L. Zhao, S.Q. Liu, Holzforschung 70 (2015) 127-136. |
| [4] |
P.J. McClure, G.D. Chavarria, E. Espinoza, Rapid Commun. Mass Spectrom. 29 (2015) 783-788. DOI:10.1002/rcm.7163 |
| [5] |
H. Wang, W.H. Dong, W.J. Zuo, et al., Fitoterapia 95 (2014) 16-21. DOI:10.1016/j.fitote.2014.02.013 |
| [6] |
H. Wang, W.L. Mei, Y.B. Zeng, et al., Phytochem. Lett. 9 (2014) 168-173. DOI:10.1016/j.phytol.2014.06.008 |
| [7] |
B. Sun, A. Huang, Y. Wang, J. Liu, J. Nat. Fibers 12 (2014) 1-11. |
| [8] |
A. Kilic, P. Niemz, Eur. J. Wood Prod. 70 (2012) 79-83. DOI:10.1007/s00107-010-0489-8 |
| [9] |
E.M.A. Ajuomg, M.C. Breese, Eur. J. Wood Prod. 56 (1998) 139-142. DOI:10.1007/s001070050285 |
| [10] |
E.M.A. Ajuong, M. Redington, Wood Sci. Technol. 38 (2004) 181-190. DOI:10.1007/s00226-004-0236-6 |
| [11] |
C.W. Choi, Y.H. Choi, M.R. Cha, et al., Appl. Biol. Chem. 52 (2009) 375-379. |
| [12] |
S.N. Wang, F.D. Zhang, A.M. Huang, Q. Zhou, Holzforschung 70 (2016) 503-510. DOI:10.1515/hf-2015-0125 |
| [13] |
M. Ek, G. Gellerstedt, G. Henriksson, Wood Chemistry and Wood Biotechnology, Walter de Gruyter GmbH & Co. KG, Berlin, 2009.
|
| [14] |
I. Noda, J. Am. Chem. Soc. 111 (1989) 8116-8118. DOI:10.1021/ja00203a008 |
| [15] |
M.Y. Li, S.C. Cheng, D. Li, et al., Chin. Chem. Lett. 26 (2015) 221-225. DOI:10.1016/j.cclet.2014.11.024 |
| [16] |
M.C. Popescu, J. Froidevaux, P. Navi, C.M. Popescu, J. Mol. Struct. 1033 (2013) 176-186. DOI:10.1016/j.molstruc.2012.08.035 |
| [17] |
S.Q. Sun, Q. Zhou, J.B. Chen, Infrared Spectroscopy for Complex Mixtures:Applications in Food and Traditional Chinese Medicine, 10th. Chemical Industry Press, Beijing, 2011.
|
| [18] |
X.H. Liu, C.H. Xu, S.Q. Sun, et al., Spectrochim. Acta A Mol. Biomol. Spectrosc. 97 (2012) 290-296. DOI:10.1016/j.saa.2012.06.013 |
| [19] |
A.C. Meilan, A.M. Goodman, M.G. Baron, J.G. Rodriguez, Cellulose 23 (2016) 901-913. DOI:10.1007/s10570-015-0848-z |
| [20] |
B.H. Xu, G.J. Zhang, S.Q. Sun, et al., J. Mol. Struct. 1018 (2012) 88-95. DOI:10.1016/j.molstruc.2011.12.017 |
| [21] |
W.S. Gary, Vib. Spectrosc. 4 (1992) 123-124. DOI:10.1016/0924-2031(92)87024-A |
| [22] |
A.M. Huang, Q. Zhou, J.L. Liu, B.H. Fei, S.Q. Sun, J. Mol. Struct. 833- 834 (2008) 160-166. |
| [23] |
S. Luo, Y.Q. Wu, J. Huang, Biobased Mater. Sci. Eng. 10 (2012) 156-160. |
| [24] |
F.D. Zhang, C.H. Xu, M.Y. Li, A.M. Huang, S.Q. Sun, J. Mol. Struct. 1069 (2014) 89-95. DOI:10.1016/j.molstruc.2014.01.085 |
| [25] |
J. Font, N. Salvado, S. Buti, J. Enrich, Anal. Chim. Acta. 598 (2007) 119-127. DOI:10.1016/j.aca.2007.07.021 |
| [26] |
J. Zeng, X.L. Zhang, Z.M. Guo, et al., J. Chromatogr. A 1218 (2011) 1749-1755. DOI:10.1016/j.chroma.2011.01.079 |
| [27] |
E. Duquesnoy, V. Castola, J. Casanova, Carbohyd. Res. 343 (2008) 893-902. DOI:10.1016/j.carres.2008.01.001 |
| [28] |
R. M. Silverstein, F. X. Webster, D. J. Kiemle, Spectrometric Identification of Organic Compounds, John Wiley Inc. & Sons, Hoboken, 2005.
|
| [29] |
T. Ogata, S. Yahara, R. Hisatsune, R. Konishi, T. Nohara, Chem. Pharm. Bull. 38 (1990) 979-987. |
| [30] |
Y. Goda, M. Katayama, K. Ichikawa, et al., Chem. Pharm. Bull. 40 (1992) 2452-2457. DOI:10.1248/cpb.40.2452 |
| [31] |
R.X. Liu, M. Ye, H.Z. Guo, K.S. Bi, D. Guo, Rapid Commun. Mass Spectrom. 19 (2005) 1557-1565. |
| [32] |
R.X. Liu, W. Wang, Q. Wang, K.S. Bi, D. Guo, Biomed. Chromatogr. 20 (2006) 101-108. DOI:10.1002/bmc.535 |