 2018, Vol. 29


b Department of Hematology, Longgang District People's Hospital, Shenzhen 518172, China;
c School of Chemistry and Pharmaceutical Sciences, Qingdao Agriculture University, Qingdao 266109, China
Ciprofloxacin (CIP, 1-cyclopropyl-6-fluoro-1, 4-dihydro-4-oxo-7-(1-piperazinyl)-3-quinolinecarboxylic acid) is a synthetic second-generation chemotherapeutic agent, and has been approved for exclusive use to treat severe and life threatening bacterial infections [1]. Clomipramine (CLO, 3-(3-chloro-10, 11-dihydro-5Hdibenzo[b, f]-azepin-5-yl)-N, N-dimethylpropan-1-amine) is a psychiatric medication used to treat and relief symptoms of depressive, obsessive-compulsive disorders by correcting chemical imbalances of neurotransmitters in the brain [2]. Fexofenadine (FEX, (±)-4-[1-hydroxy-4-(4-hydroxydiphenylmethyl)-1-piperidinyl]-butyl]-a, a-dimethyl benzene acetic acid) is a non-cardiotoxic second-generation histamine H1-receptor antagonist in piperidine-class drugs used to treat hay fever symptoms [3, 4]. In various cases, e.g., the process of manufacturing, it is of great significance to quantify pharmaceuticals [5]. There are numerous analytical methods to determine the purity and concentration of pharmaceuticals. In general, HPLC [6, 7], LC–MS [8, 9] and GC–MS[10] offer excellent selectivity and sensitivity. However, they require expensive instrumentation that requires technical expertise, not readily available for many laboratories in resource-limited settings [5]. Methods such as capillary electrophoresis [1, 11, 12], spectrophotometry [5, 13-15], electrochemical sensor [16, 17] and titration [2, 18, 19], are alternatives. Among them titration methods are attracting great interest due to their intrinsic simplicity, speed and cost-effectiveness [18, 20].
To identify titration endpoints, electrochemical techniques are often used because they are sensitive, affordable and function independently of light absorption properties of the solution to be measured [2, 3, 18, 19, 21-25]. However, in traditional contact electrochemical models, electrode deterioration is unavoidable resulting in erratic measurements because the working electrodes are in direct contact with the titration solution [21]. Therefore, a rinse step must be incorporated into the titration procedure lengthening analysis time, which can be significant for multiple samples.
As the field of analytical chemistry evolves, the simplicity of the analytical procedure is a primary quality on which analytical methods are judged. Towards this end, we have constructed an electrical micro-titration system that employed a developed capacitively coupled contactless conductivity detector (C4D) to monitor the reaction process in real time [26]. In this strategy, a disposable glass reaction cell was used to load titrand. Upon addition of titrant, the ionic strength and/or mobility of components in the solution changed, causing a change in conductivity that was monitored by the C4D to form a V-shaped titration curve. The endpoint was easily identified from the peak of the curve. Because the reaction solutions were isolated from the working electrodes, the system was simple and cost-effective because it eliminated the requirements for detector exchange or renewal between different measurements, and involved no auxiliary chemicals. As a proof of principle, we applied this method to determine CIP·HCl in tablet formulations and found good agreement with those obtained using a reference method [27].
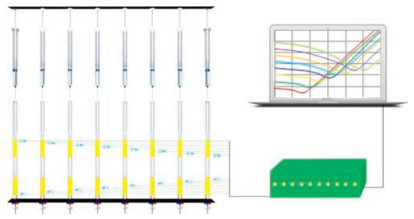
In practical terms, multichannel tools are easily applied to batch measurements. Thus, nowadays we developed further a C4D-based eight-channel electronic titrator (8-CET) to facilitate highthroughput titrations [28]. In this paper, we determined the capacity of the 8-CET for measuring ciprofloxacin, clomipramine and fexofenadine hydrochlorides by employing both AgNO3 and NaTPB as titrants.
The developed 8-CET was composed of a delivery system, a custom-made 8-channel C4D and a stirring device (Scheme 1). The delivery system and C4D were both fully software controlled to achieve automatic titrant delivery and monitoring of titrations. Disposable glass tubes (OD = 5.0 mm, ID = 4.0 mm) were used as reaction cells. Typically, in each reaction cell 1.5 mL titrand was loaded via a micro-syringe; then an oval mini magnetic rotor (2.8 mm in length) was placed in it; eight reaction cells were inserted into the head stage of the 8-channel C4D simultaneously; the operator clicked the START button on the touch screen to run the delivery; at the same time the apparent conductivity of solution in each reaction cell was monitored with a special software for the 8-CET. The output data was commonly saved as text files for further processing with Microsoft Excel to form titration curves. The endpoints were identified from the peaks of the V-shaped titration curves. The time span was defined as the elapsed time from the beginning of the monitoring to the endpoint [27, 28]. The concentrations of the titrands were obtained according to the consumption of titrants, which were calculated from the elapsed time. At the end of one batch measurement, the used reaction cells were removed and the next batch was inserted directly, without any treatment operation of working electrodes. Other experimental details can be found in Supporting information.

|
Download:
|
| Scheme 1. The structure and working principle of the 8-CET. | |
Conductometric technique can be used to monitor titrations in which the conductivity of the solutions varies before and after endpoints [29]. During the titrations using AgNO3 solution as titrant, the formation of AgCl precipitates alters the number of ions present in the solution and in turn changes the conductivity (as shown in Eqs. (1)–(3)). After the endpoint, the addition of excess titrant increases the concentration of ions, causing an increase of the conductivity [27, 30].

|
(1) |

|
(2) |

|
(3) |
When 50.0 mmo/L AgNO3 solution was used as titrant to titrate against standard CIP·HCl solutions at different concentrations simultaneously, typical graphs of apparent conductivity versus titration time are shown in Fig. 1A. These V-shaped titration curves show that different elapsed times result from the different initial concentrations of titrands. Excel software was used to identify inflection points. The user experience in this method is much better than identifying the endpoint with graphical method on screen or paper [25, 29, 30]. The consumption of titrant increases linearly with the initial concentration of titrands across the range of concentrations measured (Fig. 1B). This illustrates that under these conditions quantitative measurements can be performed. It is convenient to obtain a calibration curve because eight solutions at different concentration can be measured simultaneously. Further calculation shows that it is a stoichiometric reaction. Thus, the measurement is an absolute method, in principle, which means no calibration curve is required as long as the titrant concentration is well standardized and the delivery rate is accurately calibrated.

|
Download:
|
| Fig. 1. (A) Typical titration curves of a bath CIP·HCl solutions at different concentrations obtained with the 8-CET, using 50.0 mmol/L AgNO3 as titrant. Curves from bottom to top represent standard solutions of 3.0, 4.0, 5.0, 6.0, 7.0, 8.0, 9.0 and 10.0 mmol/L, respectively. (B) Plot of the consumption of titrant versus the initial concentration of CIP·HCl. | |
Over the concentration range of 3.0–10.0 mmo/L, it is suitable to determine CIP·HCl because that measurements give well-defined inflections and stable apparent conductivity values. It is especially worth noting that eight solutions can be measured within 1 min. This efficiency is higher than existing mono-titration methods [1-3, 11-27], as well as some high throughput methods [31-33]. Moreover, a batch of eight solutions at the same concentration, e.g., 3.0 mmo/L, can be measured within 16 s (typical titration curves shown in Fig. S1 in Supporting information), suggesting a higher throughput rate (maximally 30 measurements per min, corresponding to 2 s per measurement). This is superior to the high throughput titration method based on flow ratiometry technique [31]. Moreover, the device and operation of this method are both more evidently simple than that employing flow ratiometry technique. And it does not require any auxiliary chemicals, such as internal indicators. In addition, the measurement speed can be further increased by using a higher titrant concentration, e.g., 100.0 mmo/L AgNO3. However, this increase of speed is at the expense of precision.
When batches standard CLO·HCl and FEX·HCl solutions were titrated with 50.0 mmo/L AgNO3, typical graphs of apparent conductivity versus titration time were similar to that obtained above. Stoichiometric titrations were also obtained. It is found that the optimum concentration ranges for measuring these two pharmaceuticals are 4.5–13.0 mmo/L and 2.5–11.5 mmo/L, respectively. Lower concentrations lead to unstable readings and more time is needed to obtain stable conductivity values. Higher concentrations lead to deviant stoichiometry. For all of the measurements, eight solutions per batch can be completed within 1 min (data not shown).
We next examined the applicability of the proposed highthroughput titration method for the assay of CIP·HCl, CLO·HCl and FEX·HCl in pure form. Different standard concentration solutions of the three pharmaceuticals were analyzed in batch. And the results are summarized in Table S1 (Supporting information). We obtained recoveries of 97.6%–102.0% with standard deviations (SD) 0.046 and relative standard deviations (RSD) 1.0%. For ruggedness evaluation, a comparison between the results obtained by three operators was performed. The RSD % values of a 5.0 mmol/L standard CLO·HCl solution measured in the same laboratory under the same analysis conditions are 0.4%, 0.4% and 0.3%. These results reveal that the high-throughput titration by employing the 8-CET is a suitable analytical tool for measuring CIP·HCl, CLO·HCl and FEX·HCl in pure form.
NaTPB can be used as titrant for conductometric measurements of CIP through ion-associate complex formation [18]. It is possible that stronger basic secondary amine group in the molecule of CIP is transferred to the cationic ion and reacts with the TPB ion. The molar ratio of CIP: TPB is 1:1 [34]. Therefore, the precipitation reaction may be represented by Eq. (4). CLO [2] and FEX [15] also react with TPB in aqueous solution to form 1:1 ion-associate complex precipitation. The reactions are represented by Eqs. (5) and (6), respectively. Therefore, conductometric titrations can also be used to measure CIP, CLO and FEX.

|
(4) |

|
(5) |

|
(6) |
When the 50.0 mmol/L standard NaTPB solution was used to titrate against a batch of standard CIP·HCl solutions at different concentrations, typical graphs of apparent conductivity versus titration time were similar to that obtained with AgNO3 titrant (Fig. 2A). Fig. 2B shows that the consumption of titrant increases linearly with the initial concentration of titrand. Results of further experiments showed that the optimum concentration ranges for measuring standard CIP·HCl using NaTPB was 2.5–8.5 mmol/L. For all experiments, a batch of eight solutions was measured within half an hour. By contrast, this is less efficient than that using AgNO3 as titrant. To analyze a batch of 3.0 mmol/L CIP·HCl solutions, maximally 36 measurements per hour could be completed. The 50.0 mmol/L standard NaTPB solution was also used to titrate against CLO·HCl and FEX·HCl solutions with the same conditions and parameters. Similar graphs of apparent conductivity versus titration time were obtained for these stoichiometric titrations. The optimum concentration ranges for measuring CLO·HCl and FEX·HCl are 3.0–12.0 mmol/L and 2.0–9.5 mmol/L, respectively (data not shown).

|
Download:
|
| Fig. 2. (A) Typical titration curves of a bath CIP·HCl solutions at different concentration obtained with the 8-CET, using 50.0 mmol/L NaTPB as titrant. From bottom to top represent standard solutions of: 2.5, 3.0, 3.5, 4.0, 4.5, 5.0, 5.5 and 6.0 mmol/L, respectively. (B) Plot of the consumption of titrant versus the initial concentration of CIP·HCl. | |
Using NaTPB titrant, the applicability of the proposed highthroughput titration method for the assay of CIP·HCl, CLO·HCl and FEX·HCl in pure form was examined. Different standard concentration solutions of the three pharmaceuticals were analyzed in batch; and the results were summarized in Table S2 (Supporting information). We obtained recoveries of 96.8%-102.6% with SD 0.034 and RSD 0.8%. A comparison between the results obtained by three operators was also performed. The obtained RSD% values with a 5.0 mmol/L standard FEX HCl in the same laboratory under the same analysis conditions were 0.5%, 0.4% and 0.4%, respectively, indicating a good ruggedness.
The 50.0 mmol/L AgNO3 solution was used to titrate against CIP·HCl, CLO·HCl and FEX·HCl in pharmaceutical formulations from tablets using the 8-CET. Graphs of apparent conductivity versus titration time are the same as that obtained by titrating standard reagents (data not shown); and the results of the measurements are summarized in Table S3 (Supporting information).
The micro-titration method for determining CIP·HCl in pharmaceutical formulation with mono-channel C4D, commonly a measurement took more than 4 min due to the lack of stirring [27]. In this strategy, the speed is increased more than 100-fold. Moreover, the accuracy and precision are satisfactory (SD 1.83; RSD 0.9%; recovery 96.7%–98.7%). For the measurements of CLO·HCl and FEX·HCl, good recoveries and low standard deviations are obtained. In comparison with traditional titration methods [35], much time and labor can be saved. It is worth noting that for all the cases the values of 'Found' are somewhat greater than the 'Taken' ones. And all recoveries are lower than 100%. This suggests that that an undesired ion or ions also react with the titrant.
The 50.0 mmol/L NaTPB solution was also used to measure CIP·HCl, CLO·HCl and FEX·HCl in pharmaceutical formulations from tablets with the 8-CET. The titration curves were almost the same as that of the standard reagents, indicating that the commonly used additives and excipients in tablets have negligible interference. The results of the measurements are summarized in Table S4 (Supporting information).
Well known that NH4+ and K+ have serious effects on the titration measurement when NaTPB is used as titrant [34]. Our results indicated these ions are absent in all the pharmaceutical formulation samples. Some of the values of 'Found' are higher than the 'Taken' one; while the Recoveries are oscillating about 100%. This is an outstanding difference in comparison with that using AgNO3 titrant. In term of the recovery, titration with NaTPB is superior to AgNO3, though the efficiency is relatively lower.
The conductimetric method described by Issa et al. [18] for determination of CIP·HCl concentrations using NaTPB as titrant obtained good accuracy and precision over the range of 3–25 mg/L. The measurements were completed in 25 min. Here, eight measurements can be completed in 16 min with almost the same recovery and precision. And the optimum measurement range is 1.0–3.3 mg/L. In another study [2], they developed a conductimetric method for measuring CLO·HCl using NaTPB as titrant. Within the range of 3.4–703.0 mg/L, it showed good accuracy (recovery of 99.95%–101.23%) and precision (RSD values of 0.50%– 1.21%). By contrast, with the high throughput method proposed here, we determined CLO·HCl concentrations more efficiently with the same level of accuracy and precision.
Previous conductometric methods for measuring FEX·HCl in pharmaceutical formulations also used NaTPB as titrant. The optimum concentration range was 100–538 mg/L [13]. Statistical treatment of the experimental results indicated that the method was precise (RSD < 3.04%) and accurate (recovery of 99.80%– 100.48%). In contrast, here the optimum concentration range is 1.08–5.11 g/L with an RSD of 0.8%. Apart from the dissolution with water and the filtration with ordinary filter-paper, no auxiliary chemicals or pretreatment operations are involved in the measurements. This may contribute somewhat to the high precision level. In addition, the measurement efficiency of our high throughput method is much higher (more than 100-fold).
By employing the 8-CET, a high throughput method for measuring CIP·HCl, CLO·HCl and FEX·HCl was developed. This method does not require any auxiliary devices or chemicals. When AgNO3 is used for titration, maximally 30 measurements per min can be completed with good accuracy and precision for both standard reagents and pharmaceutical formulations based on the determination of Cl-. When NaTPB is used for titration, maximally 36 measurements per hour can be completed, also with good accuracy and precision for both standard reagents and pharmaceutical formulations, based on the formation of ion-associate complexes. In contrast, the accuracy for pharmaceutical formulations using NaTPB as titrant is obviously better than that using AgNO3 because that the measurement is less effected by coexisting components in the tablets. These capacities of the proposed method make it an alternative for routine quality control analyses. And in principle, higher efficiency can be achieved by constructing an electrical titrator with more channels.
AcknowledgmentsThis work was supported by Special Scientific Research Funds for Central Non-profit Institutes, Yellow Sea Fisheries Research Institute, Chinese Academy of Fishery Sciences (YSFRI-CAFS) (No. 20603022016003), Import of International Advanced Agricultural Science and Technology Plan (948 Project) of Chinese Ministry of Agriculture (No. 2016-X28), Central Public Interest Scientific Institution Basal Research Fund, CAFS (No. 2016RC-BR02), Qingdao National Laboratory for Marine Science and Technology (No. 2015ASKJ02-05) and Key R & D Program of Shandong Province (No. 2016GSF120008).
Appendix A. Supplementary dataSupplementary data associated with this article can be found, in the online version, at https://doi.org/10.1016/j.cclet.2017.11.005.
| [1] |
R.H.O. Montes, M.C. Marra, M.M. Rodrigues, E.M. Richter, R.A.A. Muñoz, Electroanalytical 26 (2014) 432-438. DOI:10.1002/elan.201300474 |
| [2] |
Y.M. Issa, S.H. Mohamed, S.A.H. Elfeky, Arab. J. Chem. 10 (2017) 336-343. DOI:10.1016/j.arabjc.2016.05.004 |
| [3] |
S. Ashour, M. Khateeb, Can. Chem. Tran. 1 (2013) 292-304. |
| [4] |
K. Simpson, B. Jarvis, Drugs 59 (2000) 301-321. DOI:10.2165/00003495-200059020-00020 |
| [5] |
K.A. Rawat, H. Basu, R.K. Singhal, S.K. Kailasa, RSC Adv. 5 (2015) 19924-19932. DOI:10.1039/C4RA16109B |
| [6] |
C. Gonzalez, L. Moreno, J. Small, D.G. Jones, S.F.S. Bruni, Anal. Chim. Acta 560 (2006) 227-234. DOI:10.1016/j.aca.2005.12.040 |
| [7] |
R. Scherer, J. Pereira, J. Firme, M. Lemos, M. Lemos, Indian J. Pharm. Sci. 76 (2014) 541-544. |
| [8] |
S.L. Bonde, R.P. Bhadane, A. Gaikwad, et al., J. Pharm. Biomed. Anal. 90 (2014) 64-71. DOI:10.1016/j.jpba.2013.10.033 |
| [9] |
O. Golovko, O. Koba, R. Kodesova, et al., Environ. Sci. Pollut. Res. 23 (2016) 14068-14077. DOI:10.1007/s11356-016-6487-6 |
| [10] |
C. Fernandes, E.V. Hoeck, P. Sandra, F.M. Lanças, Anal. Chim. Acta 614 (2008) 201-207. DOI:10.1016/j.aca.2008.03.036 |
| [11] |
H. Wu, S.K. Kailasa, J. Yan, C. Chin, H. Ku, J. Ind. Eng. Chem. 20 (2014) 2071-2076. DOI:10.1016/j.jiec.2013.09.034 |
| [12] |
T.A.H. Nguyen, T.N. MaiPham, T.T. Doan, et al., J. Chromatogr. A 1360 (2014) 305-311. DOI:10.1016/j.chroma.2014.07.074 |
| [13] |
E.A. Ali, A.M. Adawy, M.F. El-Shahat, A.S. Amin, Egyptian J. Foren. Sci. 6 (2016) 370-380. DOI:10.1016/j.ejfs.2016.05.007 |
| [14] |
M.J. Saif, J. Anwar, G. Nawaz, J. Anal. Chem. 69 (2014) 509-512. DOI:10.1134/S1061934814060136 |
| [15] |
S. Ashour, M. Khateeb, R. Mahrouseh, Pharm. Anal. Acta S2 (2013) 003.
|
| [16] |
H. Bagheri, H. Khoshsafar, S. Amidi, Y.H. Ardakani, Anal. Methods 8 (2016) 3383-3390. DOI:10.1039/C5AY03410H |
| [17] |
H. Rashedi, P. Norouzi, M.R. Ganjali, Int. J. Electrochem. Sci. 8 (2013) 2479-2490. |
| [18] |
Y.M. Issa, W.F. El-Hawary, A.F. Ahmed, Mikrochim. Acta 134 (2000) 9-14. DOI:10.1007/s006040070046 |
| [19] |
D. G. Watson, Pharmaceutical analysis E-book: A textbook for pharmacy students and pharmaceutical chemists, Elsevier Health Sciences, Edinburg, 2015.
|
| [20] |
M.D. DeGrandpre, T.R. Martz, R.D. Hart, et al., Anal. Chem. 83 (2011) 9217-9220. DOI:10.1021/ac2025656 |
| [21] |
C.M.N.V. Almeida, A.S.L. Rui, J.L.F.C. Lima, et al., Analyst 125 (2000) 333-340. DOI:10.1039/a907917c |
| [22] |
Z. Staniç, J. Stepanoviç, Monatsh. Chem. 141 (2010) 137-142. DOI:10.1007/s00706-009-0246-z |
| [23] |
Z. Staniç, Z. Simiç, J. Solid State Electrochem. 18 (2014) 1823-1832. DOI:10.1007/s10008-014-2405-3 |
| [24] |
S. Peper, A. Ceresa, E. Bakker, E. Pretsch, Anal. Chem. 73 (2001) 3768-3775. DOI:10.1021/ac001475b |
| [25] |
M. Grossi, B. Riccò, Measurement 97 (2017) 8-14. DOI:10.1016/j.measurement.2016.11.014 |
| [26] |
X. Zhang, M. Huang, J. Zhao, et al., Measurement (2017), doi: http://dx.doi.org/10.1016/j.measurement.2017.11.025.
|
| [27] |
X. Zhang, M. Huang, Q. Yang, et al., Chin. Chem. Lett. 28 (2017) 1406-1412. DOI:10.1016/j.cclet.2017.03.019 |
| [28] |
X. Zhang, Q. Yang, M. Huang, et al., Anal. Chim. Acta (under review).
|
| [29] |
W. Hoffmann, Fresenius J. Anal. Chem. 356 (1996) 303-305. |
| [30] |
R.M.Z. Kakhki, S. Heydari, Arab. J. Chem. 7 (2014) 1086-1090. DOI:10.1016/j.arabjc.2011.09.016 |
| [31] |
H. Tanaka, T. Baba, Talanta 67 (2005) 848-853. DOI:10.1016/j.talanta.2005.04.007 |
| [32] |
H. Tanaka, K. Aritsuka, T. Tachibana, H. Chuman, P.K. Dasgupta, Anal. Chim. Acta 499 (2003) 199-204. DOI:10.1016/S0003-2670(03)00530-0 |
| [33] |
H. Tanaka, P.K. Dasgupta, J. Huang, Anal. Chem. 72 (2000) 4713-4720. DOI:10.1021/ac000598t |
| [34] |
J. Xiao, C. Yang, F. Ren, X. Jiang, M. Xu, Meas. Sci. Technol. 18 (2007) 859-866. DOI:10.1088/0957-0233/18/3/039 |
| [35] |
Y.M. Dessouky, K. Tóth, E. Pungor, Analyst 95 (1970) 1027-1031. DOI:10.1039/AN9709501027 |