 2018, Vol. 29


b State Key Laboratory and Institute of Elemento-Organic Chemistry, College of Chemistry, Nankai University, Tianjin 300071, China;
c Collaborative Innovation Center of Chemical Science and Engineering, Nankai University, Tianjin 300071, China
Natural amino acids are known to be in their zwitterionic and nonzwitterionic forms in the condensed and gas phase, respectively [1-5]. Thus, the question of how do interactions between amino acids and other species affect their zwitterionic structures is very interesting and important to be answered [3-5]. As development of the technique of soft ionization, especially electrospray ionization (ESI) [6], it is convenient to produce some non-covalent complexes of amino acids with other molecules and ions in the gas phase. Thus, different experimental methods based on ESI mass spectrometry, including blackbody infrared radiative dissociation (BIRD) [2], collision cross section measurement [8, 9], photoelectron spectroscopy [7] and infrared multiphoton dissociation (IRMPD) spectroscopy [8-15], along with theoretical calculations on different levels [8-15], have been widely applied to the question mentioned above.
Besides widely studied complexes of amino acids and different metal ions, water and other small organic molecules [10, 11, 13-19], a very interesting system of protonated homodimers of amino acids has also been extensively studied in the past 20 years. Structures of different protonated homodimers of amino acids were gradually discovered, showing more complexity than people previously thought [10, 11, 13-19]. Generally speaking, all these structures can be divided into two types: Charge-solvated or saltbridged, depending on whether the unprotonated units in the complexes have nonzwitterionic or zwitterionic forms (Fig. 1). Here the structures of protonated homodimers of amino acids are systematically reviewed, along with the relationship between the proton affinity of the mono amino acid and the stability of saltbridged structures of the protonated homodimers. Effects of temperature and side chains on gaseous dimer conformations are also considered and discussed.

|
Download:
|
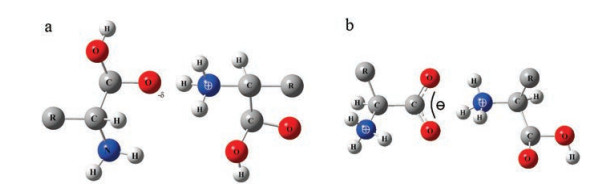
| Fig. 1. Typical examples of (a) charge-solvated (CS) and (b) salt-bridged (SB) structures of protonated amino acid homodimers. R represents side chain groups. For the CS structure, the negative charge –δ is induced by the group of NH3+ and the unprotonated unit is characterized by a non-zwitterionic structure. For the SB structure, the unprotonated unit is characterized by a zwitterionic structure. The Coulomb interaction bridges the two units and enhances the hydrogen bond greatly. | |
2. Experimental and theoretical methods
Among the experimental methods for structural study of the protonated amino acid dimers, IRMPD spectroscopy based on ESI mass spectrometry, especially using a Fourier transform ion cyclotron (FTICR) mass spectrometer (MS), has been thought as the most powerful and convincing method and has been widely used [8-15, 20-30]. Thus, here we will just focus on this method.
Vibrational spectrum offers a ready access to a wide range of structural information of gaseous ions, such as location of charge and hydrogen bonding interactions. However, the extremely low density of gaseous ions leads to difficulty in direct absorption measurements. IRMPD spectroscopy overcomes this obstacle in sensitivity. The mass selected ions may absorb several infrared photons to pass their dissociation threshold, resulting a change in the mass spectrum. The proportion of the ion population that undergoes unimolecular dissociation is related to the efficiency of photon absorption at that frequency. Therefore, the IRMPD spectroscopy can be considered as an indirect measurement of vibration among various modes, which is much more sensitive than direct absorption spectroscopy.
Since 1970s, infrared lasers have been used to dissociate trapped ions [31]. Typical example is line-tunable CO2 discharge laser. Beauchamp et al. and Brauman et al. applied this type of laser on investigation of the IRMPD for a wide range of target ions [32-34]. However, its tuning range (9.2-10.8 μm) limits its capability to explore vibrational information vastly. Emergence of more powerful and widely tunable free electron lasers (FELs) provides the possibility to obtain more vibrational information, which uniquely support IRMPD spectroscopy in this line of research. The free electron laser for infrared experiments (FELIX) in Netherlands and centre infrarouge laser orsay (CLIO) in France are mentioned the most frequently by a wide range of IRMPD studies [23, 35]. The output wavelength of an FEL is continuously tunable in a range of 500-2000cm-1 by tuning the kinetic energies of the electrons or the magnetic field strength in the undulator.
Benchtop optical parametric oscillator/amplifier (OPO/A) laser is the other option for the tunable laser source. Typically, a pump photon provided by a neodymium-doped yttrium aluminum garnet (Nd:YAG) laser is converted to a signal and an idler photon by passing through lithium niobate (LiNbO3) crystals based on the second harmonic generation (SHG). The phase-matching properties of the nonlinear crystal can be changed by adjusting the temperature or orientation of the crystals. Comparing to the free electron lasers (FELs), OPO lasers have much lower pulse energy, but are still acceptable for most of IRMPD experiments. The first example of such an experimental setup was shown by McLafferty's group, who conducted IRMPD spectroscopic study on various protonated dimers of amino acids using a combination of a 6T FTICR mass spectrometer and a tunable OPO laser pumped by a Nd:YAG laser in the range of 3050-3800cm-1 [8, 21]. Other important techniques were also applied in IRMPD experiments. For example, Rizzo et al. reported IR dip-UV photodissociation spectroscopy by recording the IR spectrum of UV-selected conformation [36]. Lee et al. applied an OPO laser to detach a tag from cold ions generated by supersonic expansion, which was also known as "messenger" (or "tagging") technique [37]. And the details of these methods can be found in corresponding reference and are not expanded here.
Theoretical calculation is very important to understand the experimental spectra and the structures of these complexes. In order to perform it, different calculation methods are chosen by different research groups. As a relative reliable and economical method, the DFT method of B3LYP has been widely applied in the investigation of vibrational spectra, binding energies and gasphase structures of these dimers [38-44]. Besides, other hybrid exchange-correlation DFT functionals such as MPW1PW91 [45] have also been mentioned and compared with the normally used B3LYP functional [46]. Due to the great performance of the method of M062X in the study of non-covalent complexes, this method is also applied in these H-bonding systems [47]. In lots of cases, DFT calculations on different levels are followed by single-point energy calculations on a higher level of MP2(full) theory in order to investigate the possibility of large differences in conformation existing between structures calculated by the different methods [8, 12, 48].
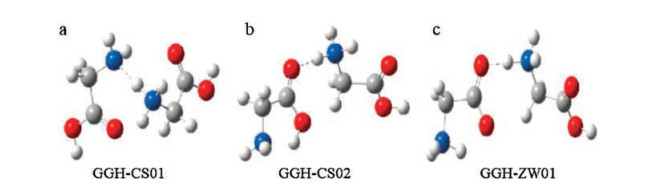
3. IRMPD spectroscopic results and calculations 3.1. Gly2H+, Ala2H+, Val2H+ and Ile2H+Gly2H+ has been studied by theoretical calculations and different experimental methods including IRMPD spectroscopy in different wavelength ranges most widely [2, 8, 12, 45]. Its first energy minimum was suggested by Williams et al. based on their experimental results of BIRD and calculations [2]. The suggested energy minimum based on MP2/3-21G(d) has a charge-solvated structure (GGH-CS01, Fig. 2a). In 2005, McMahon et al. studied the binding enthalpy and entropy changes of Gly2H+ with the method of pulsed-ionization high-pressure mass spectrometry [45]. They also performed the DFT calculations and found a new chargesolvated structure (GGH-CS02, Fig. 2b) that is 7kJ/mol lower in energy than that of previously suggested. In a later paper by the same group [12], they investigated the IRMPD spectra of Gly2H+ in the range of 900-2000cm-1 using the free electron laser at CLIO coupled with an ESI ion trap mass spectrometry. The experimental spectrum matched well with the calculated spectrum for GGHCS02. And the most stable isomer with a salt-bridged structure (GGH-ZW01, Fig. 2c) was 1.7kcal/mol less stable than that of GGHCS02. McLafferty's group studied the Gly2H+ species at the same time. IRMPD spectrum was reported in the range of 3050-3800cm-1 with an OPO laser combined with a FTICR mass spectrometer (Fig. 3) [8]. Their results also supported the chargesolvated isomer previously suggested by Williams et al.

|
Download:
|
| Fig. 2. Structures of Gly2H+. (a) Charge-solvated isomer of GGH-CS01, suggested by Price et al. [2], (b) charge-solvated isomer of GGH-CS02, suggested by Raspopov et al. [45] and (c) salt-bridged isomer of GGH-ZW01, suggested by Wu et al. [12]. | |

|
Download:
|
| Fig. 3. The first IRMPD spectrum of Gly2H+ in the range of 3050–3800 cm-1 with an OPO laser combined with a FTICR mass spectrometer, reported by Oh et al. in 2005 [8]. Copied with permission [8]. Copyright 2005, American Chemical Society | |
Almost at the same time, Fridgen's group also investigated Gly2H+ with the method of IRMPD spectroscopy and theoretical calculations. They obtained the spectrum in the region of 800-2100cm-1 and also suggested the same structure of GGH-CS02 independently [48]. The same group investigated the system once again by IRMPD spectroscopy using an OPO/OPA system coupled with a FTICR MS, which could cover the wide spectral region of 2400-3600 cm-1 [49]. Their results in the region above 3100 cm-1 agree well with the previous spectrum by Oh et al. And they also observed a weak, broad absorption spanning in the region of 2650-3300 cm-1 and a shared proton stretch at 2440 cm-1. These results further confirmed the previously suggested charge-solvated isomer of GGH-CS02.
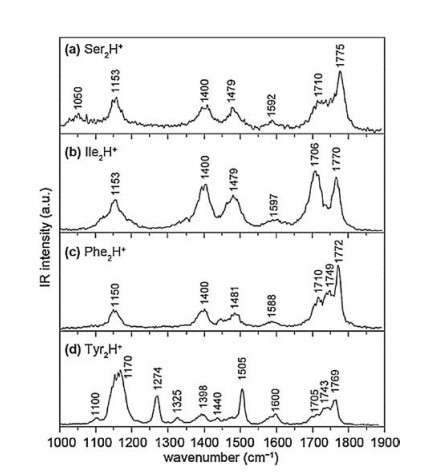
Other aliphatic amino acids, such as alanine and valine, were also studied by Fridgen's group using the mid-infrared FEL at CLIO [48]. Both spectra are very similar to that of Gly2H+, indicating that all of them have similar structures. Further calculations also show that the most stable isomers of Ala2H+ and Val2H+ have similar structures to GGH-CS02, characterizing by the charge-solvated interaction. The protonated homodimer of isoleucine, was studied by Seo et al. recently [50]. The IRMPD spectrum in the range of 1000-1900 cm-1 was reported (Fig. 4b), along with the measurement of its collision cross section. Further combined with theoretical calculations, the most stable isomer was also identified as a charge-solvated structure.

|
Download:
|
| Fig. 4. The IRMPD spectra of protonated homodimers of (a) serine (Ser2H+), (b) isoleucine (Ile2H+), (c) phenylalanine (Phe2H+) and (d) tyrosine (Tyr2H+) in the range of 1000–1900 cm-1, reported by Seo et al. [50]. Copied with permission [50]. Copyright 2017, Elsevier. | |
3.2. Ser2H+, Thr2H+, Cys2H+ and Pro2H+
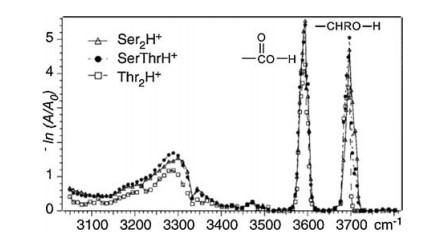
For the amino acids with polar, uncharged R groups, serine, threonine, cysteine and proline have been studied by different groups, respectively. The IRMPD spectra of both Ser2H+ and Thr2H+ were reported by Oh et al. in 2005 (Fig. 5) [8]. Both spectra are very similar, showing strong absorption peaks from free aliphatic hydroxyl O—H and free carboxyl O—H, along with a broad absorption peak centered around 3300 cm-1. However, the exact structures of Ser2H+ and Thr2H+ were not calculated there. Kong et al. also reported the IRMPD spectra of Ser2H+ in the frequency range of 2800-3800 cm-1 using a 7.0 T FTICR mass spectrometer coupled with a home-built pulsed OPO laser in 2006 [11]. The spectrum is in good consistent with the one reported by Oh et al. The strong peaks at 3565 cm-1 and 3672 cm-1 were assigned to O—H stretching vibration in free carboxyl group and free hydroxymethyl group in the serine side chains, respectively. The broad peaks centered at 2900 cm-1 and 3270 cm-1 were assigned to stretching modes from CH and NH3+ groups. Extensive calculations were preformed there too, which showed that the most stable charge-solvated structure was 1.16 kcal/mol enthalpy favored than that of salt-bridged structure (based on the level of B3LYP/6-311 + +G(d, p)).

|
Download:
|
| Fig. 5. The IRMPD spectra of Ser2H+ and Thr2H+ in the range of 3050–3800 cm-1, reported by Oh et al. in 2005 [20]. Copied with permission [8]. Copyright 2005, American Chemical Society. | |
The structural information and IRMPD spectra of protonated threonine dimer in the region of 2700-4000 cm-1 were further reported by Kong's group in 2015 [47]. Sharp peaks at 3585 cm-1 and 3690 cm-1 were assigned to O—H stretching vibration of free carboxyl and hydroxymethyl group, respectively. Weak absorption peaks at 2990 cm-1 and 3290 cm-1 was also observed in the spectrum. Based on the calculations performed at the level of B3LYP/6-311 + +G(d, p), a salt-bridged isomer of TT-SB1 was found to be the most stable one, whose energy was 0.12 kcal/mol lower than the most stable charge-solvated isomer TT-CS1. However, based on the single point energy calculation performed on the level of MP2/6-311 + +G(d, p), the isomer TT-CS1 was found to be the most stable one, which had an energy of 4.68 kcal/mol lower than that of TT-SB1. Further DFT calculations on M062X/6-311 + +G(d, p) level also showed that TT-CS1 was the most stable isomer. The comparison between the calculated spectra and the experimental spectrum also supported this conclusion that the charge-solvated isomer had a better match. Recently, Seo et al. obtained the IRMPD spectrum of Ser2H+ in the range of 1000-1900 cm-1 and also verified its charge-solvated structure (Fig. 4a) [50].
For cysteine, the oxidation is a dominant process in ESI. Ieritano et al. recently run the ESI experiment of cysteine with a solution of water/methanol (50/50, v/v) containing 5% formic acid and obtained the IRMPD spectrum of Cys2H+ with the FEL at CLIO (Fig. 6). The global minimum has a charge-solvated structure and the predicted spectrum is in excellent agreement with the experiment spectrum in the region 1000-2000 cm-1 [51]. Steill et al. reported their ESI mass spectra of a water/methanol (40/60, v/v) Cys solution, which were characterized by the protonated cystine, (CySSCy)·H+, instead of Cys2H+ [52].

|
Download:
|
| Fig. 6. The IRMPD spectrum of protonated cysteine dimer (Cys2H+) in the range of 1000–2000 cm-1, combined with the calculated harmonic spectra of the (B) global minimum, reported by Ieritano et al. in 2016 [51]. A is the IRMPD experimental spectrum; B is the spectrum for the charge-solvated global minimum calculated on B3LYP/6-311 + +G(d, p) level. Overlaid red traces show the calculated anharmonic spectra. Reproduced with permission [51]. Copyright 2016, Royal Society of Chemistry. | |
The IRMPD spectra of protonated proline dimer was recorded by McMahon's group (800-2000 cm-1) [12] and Fridgen's group (3180-3820 cm-1) [49], respectively. In the range of 800-2000 cm-1, the band at 1173 cm-1 corresponded to bending vibration of the free OH. The strongest peak at 1309 cm-1 was assigned to the combination of the NH2 and CH2 twisting motions in the protonated and zwitterionic proline moieties. The peak at 1396 cm-1 was assigned to the symmetric stretching vibration of the carboxylate group, which was considered as characteristic of salt-bridged structures. The broad, weak feature at 1636 cm-1 can be assigned as scissors modes of NH2 in both proline units. The asymmetric stretch of the carboxylate group of salt-bridged proline was at 1692 cm-1, while the carbonyl stretch of protonated proline was at 1783 cm-1. DFT calculations show that proton transfer from the carboxyl group to the secondary amine results in the most stable salt-bridged isomer. The energy of the most stable salt-bridged isomer was 2 kcal/mol lower than that of chargesolvated isomer on B3LYP/6-311 + G(d, p) level of theory. In the range of 3180-3820 cm-1, the strongest peak at 3600 cm-1 corresponded to an O—H stretching mode, while the peak at 3390 cm-1 was attributed from N—H stretching. A third vibration corresponded to the stretching of N—H bond in protonated proline that is not bound to the neutral proline, but is involved in an intramolecular interaction with the carbonyl oxygen which is responsible for its red-shifting to between 3200 cm-1 and 3300 cm-1 from a normal amine N—H stretch. And the calculation results performed by Fridgen's group also show perfect consistency with the ones obtained by McMahon [12].
3.3. Trp2H+, Phe2H+ and Tyr2H+The IRMPD spectrum of protonated tryptophan dimer in the region of 2700-3750 cm-1 was obtained by Feng et al. [53]. Combined with DFT calculations, they assigned the peak at 3575 cm-1 as carboxylic acid O—H stretching mode and the broad band at 3520 cm-1 as the indole N—H stretching vibration modes, respectively. Based on the calculations on the M062X/6-311 + +G (d, p) level, it was found that the most stable isomer of Trp2H+ had a charge-solvated structure, which was distinguished by one strong intermolecular H-bond of N—H—N, accompanied by two weak Hbonds of N—H—O and N—H—N. The predicted spectrum of the isomer is in good consistent with the experimental one. It was also found that this isomer was ~9 kcal/mol lower in energy than that of the most stable salt-bridged isomer. And other examples of amino acids with aromatic R groups, such as phenylalanine and tyrosine, were studied by Seo et al. [50]. Their IRMPD spectra in the region 1000-1900 cm-1 are shown in Figs. 4c and d. Theoretical calculations show that the most stable isomers for both species are charge-solvated structures.
3.4. Lys2H+For amino acids with a positively charged R group, lysine was also studied by several groups. Price et al. used the method of BIRD to measure the binding energy of Lys2H+, which was very close to those of Gly2H+ and Ala2H+ [2]. Oh et al. obtained its IRMPD spectrum in the region 3050-3700 cm-1 and found it was quite different from those of other amino acids [8]. There is only a broad absorption below 3200 cm-1. No absorption in the region above 3480 cm-1 was observed. Although some calculations were performed in this case, no predicted IR spectrum was found to be consistent with the experimental result. In 2011, Wu et al. reported IRMPD spectrum of protonated lysine dimer in the range of 1000-2000 cm-1, using their ESI-quadrupole ion trap instrument coupled with a FEL photon source [54]. The structure of lysine dimer was calculated on B3LYP/6-31+G(d) level and a charge-solvated isomer was considered as the most stable. Both spectral agreement and binding energy calculations were in favor of the charge-solvated structure in this study. However, a careful inspection would discover that, in fact, the predicted spectrum of the suggested charge-solvated isomer matched the previously reported spectrum poorly. Later, Kong re-performed the IRMPD experiment on this system in the range of 2700-3700 cm-1 [55]. This IRMPD spectrum is in good consistent with Oh's spectrum in the region of 3050-3700 cm-1. And a new strong peak at 2970 cm-1 was observed. After extensive calculations, a new saltbridged isomer was found to be more energetically favored than the previously charge-solvated isomer suggested by Wu et al. And the calculated IR spectrum of this new isomer is in good agreement with the experimental results reported in the same paper.
4. Understanding the structures 4.1. Proton affinity as a structural probeAn important question for protonated homodimers of amino acids is whether we can learn more from these previously performed IRMPD experiments and calculations. Is there a general structural rule behind these structures? For example, Wyttenbach et al. [56] found a fairly linear relationship between their proton affinities (PAs) and the relative zwitterionic stabilities for sodiated and rubidiated amino acids and amino acid analogs. For these protonated homodimers of amino acids, can PA play a similar role?
Thus, the energy priority of salt-bridged isomers to that of charge-solvated isomers, along with the PA values [57], for these protonated homodimers studied by now are summarized in Fig. 7. The conclusion is very easy to get from the figure. That is, PA can be applied as an effective structural probe in these examples. For these protonated amino acid homodimers, the salt-bridged form is gradually more favorable in energy comparing to the chargesolvated form as the PA of the amino acid increases. For example, glycine has the lowest PA of 211.4 kcal/mol, thus Gly2H+ tends to adopt a charge-solvated structure when forming their protonated homodimer. While proline has a relative higher PA value of 224.0 kcal/mol, it prefers to form a salt-bridged structure. In other words, charge-solvated and salt-bridged structures are energetically favored structures for protonated amino acid homodimers with low and high PA values in their monomers, respectively.

|
Download:
|
| Fig. 7. Types of conformers that protonated amino acid homodimers prevailed in the gas phase, along with their PA values of monomers, where charge-solvated (CS) and salt-bridged (SB) indicates charge-solvated and salt-bridged forms, respectively. And their PA values [57] of monomers are shown below the sticks. | |
Based on this, it seems very easy to make a prediction for other amino acids. Although whether the prediction is right or wrong needs more experiments and calculations to verify, it is still very helpful to get a quick and reasonable guess for their most possible structures. For example, arginine has the highest PA value (253.3 kcal/mol) among all natural amino acids, thus it is readily to predict that the most stable isomer of Arg2H+ should be characterized as salt-bridged structure, which is consistent with previous theoretical calculations showing the most stable saltbridged isomer for Arg2H+ is more energetically favored than charge-solvated isomer.
4.2. Effects of side chainsHowever, even just for metal cationized lysine and analogs, some later experimental and theoretical results showed that the PA might not be a reliable indicator, because of other effects caused by side chains [50]. Thus, the side-chain effects on the structures of the protonated homodimers should be considered. Seo et al. suggested that the interactions of the side chains with charged sites played an important role in those charge-solvated dimers [50]. For amino acids with aliphatic side chains, the formed chargesolvated structures are usually characterized by the interaction between the protonated amine and carboxylic acid; while for those with side chains capable of forming H-bonds, the charge-solvated structures are characterized by the H-bonding between the amine groups. Here we must mention that the suggested structural probe of PA might be inaccurate in some cases where the side chain could form strong interactions with the charge and thus make the charge-solvated structure more stable even for species with high PA values. The example of tryptophan can help us to understand it. Tryptophan has a PA very close to that of proline. So it is natural to suggest that the most stable charge-solvated and salt-bridged isomers of Try2H+ might have very close energies. However, the results show that the energy minimum of charge-solvated isomers is, in fact, 9 kcal/mol lower than that of salt-bridged isomers [53].
4.3. Temperature and solvent dependencyIt should be mentioned that the energy priority shown in Fig. 7 is based on their energy calculated at 0 K. However, the IRMPD experiments are typically performed at the nearby of 300 K. And for the temperature in the ESI source region, different experimental set up may be quite different. Thus, the temperature effect on the distribution of different isomers should be considered. The mole fraction Wi of the ith isomer can be computed using the respective partition functions within the rigid-rotor and harmonicoscillator approximation [58]:

|
Where R is the gas constant, T is the absolute temperature, qi and ΔH0, jo are the partition function and the relative heat of formation at absolute zero temperature of the ith isomer, respectively.
The distribution function shown above reflects one fact, that is, multi-isomers can co-exist at 298 K for a variety of hydrogenbonding complex systems. In the experiments, there may be several isomers with very close energies can be generated, and isomerization might occur in such a condition, causing the detected IRMPD spectrum is a mixture of spectra from those multi-isomers. And in different experimental conditions, the composition of isomers might be quite different. For example, as shown above, the most stable isomer of Lys2H+ suggested by Kong, has a salt-bridged structure [55]. Its predicted IR spectrum is in good consistent with the experimental spectrum in the region of 2700-3700 cm-1. However, the predicted IR spectrum in the region 1000-2000 cm-1 is poorly consistent with the previous experimental spectrum obtained by Wu et al. [54]. And the suggested charge-solvated isomers have contrary results, in which the predicted IR spectra in the region 1000-2000 cm-1 and 2700- 3700 cm-1 matched the two experimental spectra well and poorly, respectively. The conflict can be rationalized by considering the temperature effect on the distribution of different isomers. As shown in Fig. 8, the distribution reflects that the salt-bridged isomer ZW1 dominates at low temperatures, while the chargesolvated isomers dominate at high temperatures. Thus isomers with different structural types might be generated due to different experimental conditions, causing the general explanation for both spectra based on one structure failed.

|
Download:
|
| Fig. 8. Temperature dependency of different isomers for protonated lysine dimer (Lys2H+) on their mole fractions. Where ZW1 (asterisk), ZW2 (red triangle) and CS1 (cross) isomers are reported by Kong et al. [55]; LL-CS01(vertical line) and LL-CS-02 (blue triangle) isomers are reported by Wu et al. [54]. | |
Besides, solvent from which the amino acid dimer sprayed in ESI experiments is also possible to alter the conformation that the species may adopt in the gas phase. For example, Kass et al. suggested that protonation of carboxy group was preferable than amino group in the gas phase for p-aminobenzoic acid sample. This amino acid adopted gas phase structure (O-protonated) and liquid phase structure (N-protonated) when it was sprayed using CH3OH/H2O (3/1, v/v) and CH3CN/H2O (1/1, v/v), respectively [59]. For negative counterpart, deprotonated tyrosine ion produced by ESI also exhibit different isomeric structure in different solvent from which it is sprayed, and that an ion can be trapped in its solution phase structure. CH3OH/H2O solvent leads to the gas phase structure (TryO-), while the aprotic solvent containing acetonitrile leads to the liquid phase structure (TryCO2-) [60]. These results indicate that the hydrogen bond donating solvent CH3OH has certain influence on gas phase structure of ESI-generated ions because of its greater gas-phase acidity. Pan et al. investigated solvent effects on isomeric structures of p-(dimethylamino) chalcone (p-DMAC) generated by atmospheric pressure chemical ionization (APCI) [61]. They found the intermediate gas-phase microsolvated analyte ions can also affect the protonation process, which should be under the control of gas-phase thermodynamics. In neat methanol or acetonitrile, the protonation of p-DMAC always form O-protonated ion (gas-phase structure), while the protonation in methanol/water or acetonitrile/water solvents always produce N-protonated ion (liquid-phase structure). It indicates that the N- and O-protonated structures can be competitively produced with the change of solvents and ionization conditions.
4.4. A statistical view of their structuresDue to the structural complexity of the system, the searching of global minima in energy surfaces for such H-bonding complexes is so difficult and thus it is possible that local minima are considered as the global minima and reported improperly. Sometimes their spectra are also close and hard to be differentiated. Thus, a statistical view on the optimized structures with charge-solvated or salt-bridged conformations is necessary sometimes, because it may provide a general picture to show which kind of isomer is more stable than the other one. For example, to better understand the structure of Trp2H+, Feng et al. optimized total 240 isomers of Trp2H+ using the AM1 method [53]. At last, 76 charge-solvated and 63 salt-bridged isomers survived. Their relative energy distributions were analyzed. As shown in Fig. 9, it can be seen that the charge-solvated form dominates the low-energy isomers. In the top 50 most stable isomers, only 6 of them are characterized by the salt-bridged form. And the results reflect the energy priority of charge-solvated isomers from a statistical view, showing another aspect of the whole picture.

|
Download:
|
| Fig. 9. A statistical view on the optimized structures: corresponding energy orders of isomers of Trp2H+ at the level of AM1. The big circles indicate charge-solvated (CS) isomers and the small solid circles indicate salt-bridged (SB) isomers, reported by Feng et al. in 2016 [53]. Copied with permission [53]. Copyright 2017, John Wiley and Sons. | |
5. Conclusion
For a better understanding of structural preference of protonated amino acid homodimers in the gas phase, a range of IRMPD studies on various targets combined with theoretical calculations are reviewed. For protonated glycine dimer, along with other proton bound aliphatic amino acid dimers, such as Ala2H+, Val2H+ and Ile2H+, both theoretical calculations and spectral agreement support that charge-solvated structures dominated their existence in the gas phase. For other amino acids, such as serine, threonine, cysteine, tryptophan, phenylalanine and tyrosine, their protonated dimers also showed structural preference in charge-solvated form. On the other hand, for protonated dimer of proline and lysine, salt-bridged isomers were found as the most stable ones. To explore the general rule in structural selectivity of these protonated homodimers, PAs and side chain effect have been considered. Results show that both of them can influence the structural configurations that prevail in the gas phase. Generally, higher PA values of the monomers lead to the salt-bridged structures of protonated homodimers more stable. The example of proline can be viewed as a reference, that is, if the monomer has a PA value higher than that of proline, its corresponding global energy minimum of protonated homodimers will prefer a salt-bridged conformation; otherwise, it will prefer a charge-solvated conformation. However, it is possible that the structural probe of PA might be inaccurate in some cases in which the side chain could form strong interactions with the charge and thus make the charge-solvated structure very stable. Effect of temperature on the distribution of different isomers are also very important. Different type of isomers might be generated under different experimental conditions, and in some cases, the coexistence of multiple isomers makes the explanation of an overall IRMPD spectrum difficult. Thus the statistical view on the distribution of optimized isomers with different type of structures is helpful to obtain a general picture of their structural characteristics.
AcknowledgmentThis work was supported by the National Natural Science Foundation of China (Nos. 21475065, 21627801 and 11704280).
| [1] |
M.J. Locke, R.T. McIver, J. Am. Chem. Soc. 105 (1983) 4226-4232. DOI:10.1021/ja00351a017 |
| [2] |
W.D. Price, P.D. Schnier, E.R. Williams, J. Phys. Chem. B 101 (1997) 664-673. DOI:10.1021/jp9628702 |
| [3] |
C.J. Chapo, J.B. Paul, R.A. Provencal, et al., J. Am. Chem. Soc. 120 (1998) 12956-12957. DOI:10.1021/ja982991a |
| [4] |
R. Wu, T.B. McMahon, Angew. Chem. Int. Ed. 46 (2007) 3668-3671. |
| [5] |
T. Wyttenbach, M. Witt, M.T. Bowers, J. Am. Chem. Soc. 122 (2000) 3458-3464. DOI:10.1021/ja992546v |
| [6] |
J. Fenn, M. Mann, C. Meng, et al., Science 246 (1989) 64-71. DOI:10.1126/science.2675315 |
| [7] |
S. Xu, J.M. Nilles, K.H. Bowen Jr, J. Chem. Phys. 119 (2003) 10696-10701. DOI:10.1063/1.1620501 |
| [8] |
H.B. Oh, C. Lin, H.Y. Hwang, et al., J. Am. Chem. Soc. 127 (2005) 4076-4083. DOI:10.1021/ja040136n |
| [9] |
P.B. Armentrout, M.T. Rodgers, J. Oomens, J.D. Steill, J. Phys. Chem. A 112 (2008) 2248-2257. DOI:10.1021/jp710885a |
| [10] |
R.C. Dunbar, J.D. Steill, J. Oomens, PCCP 12 (2010) 13383-13393. DOI:10.1039/c0cp00784f |
| [11] |
X. Kong, I.A. Tsai, S. Sabu, et al., Angew. Chem. Int. Ed. 45 (2006) 4130-4134. DOI:10.1002/ange.200600597 |
| [12] |
R. Wu, T.B. McMahon, J. Am. Chem. Soc. 129 (2007) 4864-4865. DOI:10.1021/ja068715a |
| [13] |
M.F. Bush, J.T. O'Brien, J.S. Prell, et al., J. Am. Chem. Soc. 129 (2007) 1612-1622. DOI:10.1021/ja066335j |
| [14] |
M.F. Bush, J. Oomens, R.J. Saykally, E.R. Williams, J. Am. Chem. Soc. 130 (2008) 6463-6471. DOI:10.1021/ja711343q |
| [15] |
J.T. O'Brien, J.S. Prell, J.D. Steill, et al., J. Phys. Chem. A 112 (2008) 10823-10830. DOI:10.1021/jp805787e |
| [16] |
U.J. Lorenz, T.R. Rizzo, J. Am. Chem. Soc. 134 (2012) 11053-11055. DOI:10.1021/ja3023708 |
| [17] |
M.W. Forbes, M.F. Bush, N.C. Polfer, et al., J. Phys. Chem. A 111 (2007) 11759-11770. DOI:10.1021/jp074859f |
| [18] |
M.F. Bush, J. Oomens, R.J. Saykally, E.R. Williams, J. Phys. Chem. A 112 (2008) 8578-8584. |
| [19] |
M.F. Bush, J. Oomens, E.R. Williams, J. Phys. Chem. A 113 (2009) 431-438. DOI:10.1021/jp807470p |
| [20] |
X. Kong, C. Lin, G. Infusini, et al., ChemPhysChem 10 (2009) 2603-2606. DOI:10.1002/cphc.v10:15 |
| [21] |
H. Oh, K. Breuker, S.K. Sze, et al., Proc. Natl. Acad. Sci. U.S.A. 99 (2002) 15863-15868. DOI:10.1073/pnas.212643599 |
| [22] |
R.C. Dunbar, J.D. Steill, N.C. Polfer, J. Oomens, J. Phys. Chem. A 113 (2009) 845-851. DOI:10.1021/jp8087176 |
| [23] |
J.R. Eyler, Mass Spectrom. Rev. 28 (2009) 448-467. DOI:10.1002/mas.v28:3 |
| [24] |
G. Liao, Y. Yang, X. Kong, PCCP 16 (2014) 1554-1558. DOI:10.1039/C3CP53469C |
| [25] |
J.S. Brodbelt, Chem. Soc. Rev. 43 (2014) 2757-2783. DOI:10.1039/C3CS60444F |
| [26] |
R.X. Feng, L. Mu, S.M. Yang, X.L. Kong, Chin. Chem. Lett. 27 (2016) 593-596. DOI:10.1016/j.cclet.2016.02.027 |
| [27] |
J. Ren, Y.Y. Wang, R.X. Feng, X.L. Kong, Chin. Chem. Lett. 28 (2017) 537-540. DOI:10.1016/j.cclet.2016.10.032 |
| [28] |
R. Feng, L. Mu, S. Yang, X. Kong, J. Int, Mass spectrom. 419 (2017) 37-43. |
| [29] |
S.S. Lee, S. Park, Y. Hong, et al., PCCP 19 (2017) 14729-14737. DOI:10.1039/C7CP01085K |
| [30] |
J. Seo, S. Warnke, K. Pagel, et al., Nat. Chem. 9 (2017) 1263-1268. DOI:10.1038/nchem.2821 |
| [31] |
D.S. Bomse, R.L. Woodin, J.L. Beauchamp, J. Am. Chem. Soc. 101 (1979) 5503-5512. DOI:10.1021/ja00513a008 |
| [32] |
R.N. Rosenfeld, J.M. Jasinski, J.I. Brauman, J. Am. Chem. Soc. 101 (1979) 3999-4000. DOI:10.1021/ja00508a065 |
| [33] |
J.M. Jasinski, R.N. Rosenfeld, F.K. Meyer, J.I. Brauman, J. Am. Chem. Soc. 104 (1982) 652-658. DOI:10.1021/ja00367a003 |
| [34] |
D.S. Bomse, J.L. Beauchamp, J. Am. Chem. Soc. 102 (1980) 3967-3969. DOI:10.1021/ja00531a057 |
| [35] |
N.C. Polfer, J. Oomens, Mass Spectrom. Rev. 28 (2009) 468-494. DOI:10.1002/mas.v28:3 |
| [36] |
J.A. Stearns, S. Mercier, C. Seaiby, et al., J. Am. Chem. Soc. 129 (2007) 11814-11820. DOI:10.1021/ja0736010 |
| [37] |
L.I. Yeh, M. Okumura, J.D. Myers, et al., J. Chem. Phys. 91 (1989) 7319-7330. DOI:10.1063/1.457305 |
| [38] |
A. Gil, S. Simon, L. Rodríguez-Santiago, et al., J. Chem. Theory. Comput. 3 (2007) 2210-2220. DOI:10.1021/ct700055p |
| [39] |
M. Noguera, M. Sodupe, J. Bertrán, Theor. Chem. Acc. 112 (2004) 318-326. |
| [40] |
I.A. Topol, S.K. Burt, N. Russo, M. Toscano, J. Am. Soc. Mass Spectrom. 10 (1999) 318-322. DOI:10.1016/S1044-0305(98)00160-3 |
| [41] |
R. Wu, T.B. McMahon, J. Am. Chem. Soc. 129 (2007) 11312-11313. DOI:10.1021/ja0734492 |
| [42] |
R. Wu, T.B. McMahon, J. Am. Chem. Soc. 130 (2008) 12554-12555. DOI:10.1021/ja802117s |
| [43] |
R.A. Marta, R. Wu, K.R. Eldridge, et al., PCCP 12 (2010) 3431-3442. DOI:10.1039/b921102k |
| [44] |
R.A. Marta, R. Wu, K.R. Eldridge, et al., Int. J. Mass spectrom. 297 (2010) 76-84. DOI:10.1016/j.ijms.2010.06.021 |
| [45] |
S.A. Raspopov, T.B. McMahon, J. Mass Spectrom. 40 (2005) 1536-1545. DOI:10.1002/jms.908 |
| [46] |
P.B. Armentrout, A.L. Heaton, S.J. Ye, J. Phys. Chem. A 115 (2011) 11144-11155. DOI:10.1021/jp2025939 |
| [47] |
H. Yin, X. Kong, J. Am. Soc. Mass Spectrom. 26 (2015) 1455-1461. DOI:10.1007/s13361-015-1194-y |
| [48] |
K. Rajabi, T.D. Fridgen, J. Phys. Chem. A 112 (2008) 23-30. |
| [49] |
Y.J. Alahmadi, A. Gholami, T.D. Fridgen, PCCP 16 (2014) 26855-26863. DOI:10.1039/C4CP03104K |
| [50] |
J. Seo, W. Hoffmann, S. Malerz, et al., Int. J. Mass spectrom. (2017), doi: http://dx.doi.org/10.1016/j.ijms.2017.06.011.
|
| [51] |
C. Ieritano, P.J.J. Carr, M. Hasan, et al., PCCP 18 (2016) 4704-4710. DOI:10.1039/C5CP07414B |
| [52] |
J.D. Steill, J. Szczepanski, J. Oomens, et al., Anal. Bioanal. Chem. 399 (2011) 2463-2473. DOI:10.1007/s00216-010-4582-y |
| [53] |
R. Feng, H. Yin, X. Kong, Rapid Commun. Mass Spectrom. 30 (2016) 24-28. DOI:10.1002/rcm.7615 |
| [54] |
R. Wu, R.A. Marta, J.K. Martens, et al., J. Am. Soc. Mass Spectrom. 22 (2011) 1651. DOI:10.1007/s13361-011-0178-9 |
| [55] |
X. Kong, J. Am. Soc. Mass Spectrom. 25 (2014) 422-426. DOI:10.1007/s13361-013-0801-z |
| [56] |
T. Wyttenbach, M. Witt, M.T. Bowers, J. Int, Mass spectrom. 182- 183 (1999) 243-252. |
| [57] |
C. Bleiholder, S. Suhai, B. Paizs, J. Am. Soc. Mass Spectrom. 17 (2006) 1275-1281. DOI:10.1016/j.jasms.2006.05.010 |
| [58] |
Z. Slaninaj, Int. Rev. Phys. Chem. 6 (1987) 251-267. DOI:10.1080/01442358709353407 |
| [59] |
Z. Tian, S.R. Kass, Angew. Chem. Int. Ed. 48 (2009) 1321-1323. DOI:10.1002/anie.200805392 |
| [60] |
Z. Tian, S.R. Kass, J. Am. Chem. Soc. 130 (2008) 10842-10843. DOI:10.1021/ja802088u |
| [61] |
Y. Chai, N. Hu, Y. Pan, J. Am. Soc. Mass. Spectrom. 24 (2013) 1097-1101. DOI:10.1007/s13361-013-0626-9 |