 2018, Vol. 29


b Guangdong General Hospital, Guangzhou 510080, China;
c Research Institute of Sun Yat-sen University in Shenzhen, Shenzhen 518057, China
The development of multimodal imaging probes which combine merits of individual modality as to reduce limitations of each other, has been proved to be the most successful strategy to improve the imaging quality as well as acquire more specific and accurate information about the lesions. Among varied forms of imaging modality combination, fluorescence/magnetic resonance (FL/MR) dual-modal imaging probably gained the widest and the most in-depth study because high sensitivity of FL imaging and deep tissue penetration of MR imaging perfectly compensate the weak points of each other [1-3].
Owing to their high water-solubility, outstanding photostability as well as excellent biocompatibility, carbon nanodots (CDs), spherical particles with diameter below 10 nm, are becoming both a versatile platform for developing high performance nanosensors and an important class of imaging probes [4-8]. Therefore, the combination of fluorescent CDs and components with intrinsic magnetic properties is significant and efficient for preparing FL/MR dual-modal imaging probes [9-17].
The straight-forward approach to prepare CDs-based dualmodal imaging probes is to integrate CDs and magnetic materials such as iron oxide nanoparticles (NPs) together either by direct conjunction [9] or by incorporating them into host materials like silica NPs [10]. Another convenient approach to prepare CDs-based dual-modal imaging probes is to dope magnetic elements into CDs. For example, remarkable progress has been made on the investigation of Gd-doped CDs for FL/MR dual-modal bioimaging [11-16].
However, there is little research effort to explore the feasibility of doping other magnetic elements into CDs to prepare FL/MR imaging probes. For example, Ho(Ⅲ) also exhibits the potential to be a contrast reagent for MR imaging, owing to their paramagnetic properties arising from 4f electrons [18]. Especially, Ho(Ⅲ) possesses a greater magnetic moment (10.5μB) than that of Gd (Ⅲ) (8.0 μB), yet is considered to have tiny r1 as orbital contribution to their angular momentum resulting in a fast spin relaxation [19-21]. And Ho(Ⅲ) chelates and Ho(Ⅲ) complexes have been well documented as T2 contrast agents [22-26]. For example, Bu and coworkers doped Ho3+ into upconversion NPs to achieve upconversion luminescence (UCL) imaging, X-ray computed tomography (CT) imaging and high performance MR-T2 imaging simultaneously, providing a new strategy for acquiring T2-MR/UCL imaging without fluorescence quenching [25]. Therefore, it is worth to explore the feasibility of doping Ho(Ⅲ) into CDs for FL/MR dual-modal bioimaging.
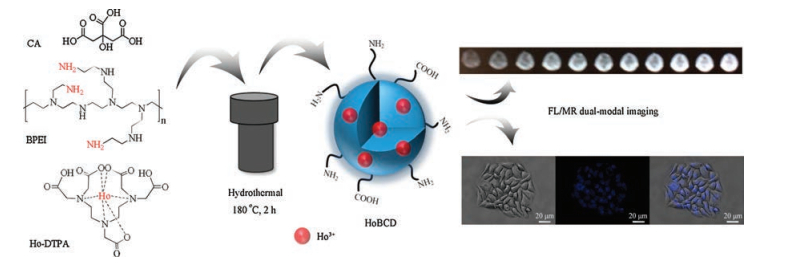
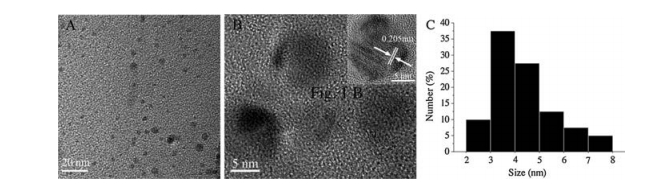
In this paper, we presented the preparation of a Ho3+ doped carbon quantum dots (HoBCDs) for FL/MR dual modal bioimaging. Experimental details can be found in Supporting information. As illustrated in Scheme 1, HoBCDs were prepared by one-pot hydrothermal treatment of citrate acid (CA), baranched polyethylenimine (BPEI) and diethylenetriamine pentaacetic acid hydrate holmium(Ⅲ) dihydrogen salt (Ho-DTPA) in a poly (tetrafluoro-ethylene) (Teflon)-lined autocave. After being subjected to dialysis and lyophilization, the solid product can be easily re-dispersed into water. A typical TEM image (Fig. 1A) revealed that the as-prepared HoBCDs were sub-round with an average diameter of 4.3 ± 1.0 nm, correlating well with dynamic light scattering (DLS) measurements which revealed a size distribution between 3.0-6.0 nm (Fig. 1C). The high-resolution TEM image (Fig. 1B) revealed the obvious lattice spacing of 0.205 nm which is consistent with the (100) facet of graphite [27], confirming that the graphite crystal structure is well preserved after the doping of holmium elements.

|
Download:
|
| Scheme 1. Schematic illustration for the synthesis and FL/MR dual-modal imaging application of HoBCDs. | |

|
Download:
|
| Fig. 1. (A) TEM image of HoBCDs. (B) HRTEM image of HoBCDs. Inset: HRTEM image of HoBCDs with lattice spacing. (C) Histogram of HoBCDs size distribution obtained from DLS measurements. | |
To investigate the optical properties of HoBCDs, UV–vis absorption and fluorescence spectra were recorded and the results were presented in Fig. 2A. The UV–vis absorption spectrum of HoBCDs (curve a of Fig. 2A) and un-doped blue carbon nanodots (BCDs) (curve b in Fig. 2A) both displayed wide absorption extending from UV region to 450 nm with two peaks at 242 nm and 361 nm, which could be attributed to π→π* transition of C=C and n→π* transition of C=O, respectively. These results also suggested that both HoBCDs and BCDs possessed sp2 hybrid structure and carbonyl groups [28, 29].

|
Download:
|
| Fig. 2. (A) UV–vis absorption spectra (curves a and b), excitation spectruma (curves c and d) and emission spectrum (curves e and f) of HoBCDs (curves a, c and e) and BCDs (curves b, d and f). Inset shows the photograph of HoBCDs under daylight (left) and 365 nm UV light (right). (B1) Emission spectra of HoBCDs under excitation wavelengths from 300 nm to 420 nm at an interval of 20 nm. (B2) Emission spectra of HoBCDs with normalized intensity under different excitation wavelengths from 300 nm to 420 nm at an interval of 20 nm. (C) Fluorescence decay curves of HoBCDs (curve a) and BCDs (curve b). | |
As observed from the inset of Fig. 2A, HoBCDs aqueous solution of low concentration was almost transparent and displayed bright blue fluorescence under UV irradiation. The aqueous solution containing HoBCDs could be kept at room temperature for long time without any visible precipitation, exhibiting their high water solubility. HoBCDs exhibited blue fluorescence with λmax at 441 nm under excitation wavelength of 359 nm (curve e and inset of Fig. 2A). No apparent wavelength shift between BCDs and HoBCDs was observed in their excitation (curves c and d of Fig. 2A) and emission spectra (curves e and f of Fig. 2A). Meanwhile, the wavelength-dependent emission property was also observed when HoBCDs solution was subjected to excitations from 300 nm to 420 nm (Figs. 2B1 and B2). The strong blue emission centered at 440 nm probably originated from surface defect state resulting from N, Ho3+-doping and long-wavelength emissions were derived from localized energy levels caused by size effect [30].
The quantum yields (QY) of HoBCDs and BCDs were measured to be 8.2% and 8.15%, respectively. N atom can serve as the electronacceptor and show superior charge transfer, thus contributing to their enhanced QY [31, 32]. The fluorescence decay profile of HoBCDs perfectly followed a single-exponential fitting with fluorescence lifetime (τ) determined to be 8.55 ns (curve a of Fig. 2C), substantially longer than BCDs (6.81 ns, curve b of Fig. 2C). All these results confirmed that the core optical properties of BCDs were not perturbed after the Ho3+ doping.
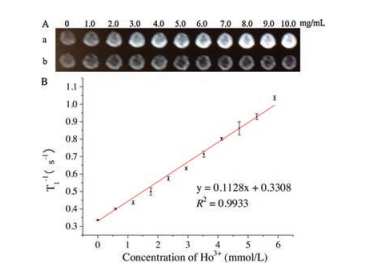
It has been well documented that Ho(Ⅲ) chelates and Ho(Ⅲ) complexes are T2 contrast agents [22-26]. Doping Ho3+ into CDs possibly renders them the magnetic resonance imaging (MRI) modality. Unexpectedly, after being incorporated into the solid matrices, HoBCDs exhibited the T1 enhanced contrast capability, not T2 enhanced contrast capability. As illustrated in Fig. 3A, the brightness of grey-scaled T1-weighted MR images obviously enhanced with the increase of HoBCDs concentration, whereas BCDs without Ho3+ doping did not exhibit any contrast enhancement in the same concentration range, indicating the enhancement originating from Ho3+-doping. This result preliminarily proved the potential of HoBCDs to work as T1 contrast agent in MR imaging. The concentration-dependent contrast enhancement denoted that Ho3+ was able to curtail the longitudinal relaxation time of hydrogen protons. In addition, r1 relaxivity curve was fitted as Fig. 3B, from which the r1 relaxivity of HoBCDs was calculated to be 0.1128 (mmol/L)-1 s-1. Though the limited enhancement effect of the present HoBCDs prevents them from being an efficient T1 contrast agent, this study opens up a new way to explore novel MR positive contrast agents. The relation between the longitudinal relaxivity of HoBCDs and its Ho content is still an open question. Delicately designed experiments are still being carried out in our lab to understand how the doping amount of the Ho elements affect the r1, and to improve its T1 enhanced contrast capability.

|
Download:
|
| Fig. 3. (A) T1-weighted MR images of (a) HoBCDs and (b) BCDs without Ho doping at a series of concentrations: 0, 1.0, 2.0, 3.0, 4.0, 5.0, 6.0, 7.0, 8.0, 9.0 and 10.0 mg/mL. (B) r1 relaxivity curve of HoBCDs. | |
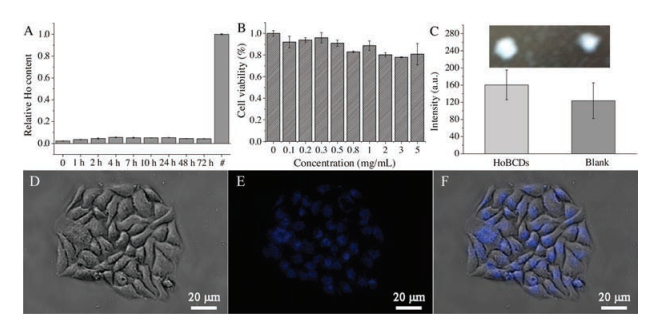
As toxicity is one of the major concerns for bioimaging probes, their biocompatibility ought to be carefully examined before they are practically applied. Ho3+ might cause serious toxicity, and its leakage from HoBCDs was thus detected using Xylenol Orange as the indicator [33]. As shown in Fig. 4A, no noticeable amount of Ho3+ was released into serum during 72 h. It is possible that Ho3+ was stably trapped by and chelated with the carbon dots framework, effectively blocking its leakage into the surroundings and thus contributing to the good biocompatibility of HoBCDs. As anticipated, the MTT results showed that over 80% cell viability was observed in most experimental groups even at concentrations of HoBCDs up to 5.0 mg/mL (equivalent Ho concentration is 2.94 mmol/L) (Fig. 4B), overall confirming good biocompatibility of HoBCDs towards HeLa cells.

|
Download:
|
| Fig. 4. (A) Ho3+ release from HoBCDs over 72 h using Xylenol Orange as the indicator. # represents the overall Ho content in HoBCDs used in the Ho3+ leakage test. (B) Viability of HeLa cells upon treatment with HoBCDs for 24 h. Results are mean ± SD of the triplicate experiments. (C) T1-weighted MR images of HeLa cells incubated with 1.0 mg/mL HoBCDs (left). The blank group was incubated with the same volume of culture medium without HoBCDs (right). The bar chart represented the corresponding intensity of the grey-scaled image in the form of mean ± SD. (D-F) The fluorescent microscopic images of HeLa cells treated with 1.0 mg/mL HoBCDs for 24 h. Images were taken under (D) bright field and (E) UV light excitation (ranging from 335 nm to 380 nm with a peak at ~340 nm). (F) Overlay of bright field and fluorescence images. | |
Thanks to the low cytotoxicity of HoBCDs and the excess positive charge on their surface, HoBCDs were able to penetrate through cell membrane and image the cells. Revealed by the photographs in Fig. 4D, the cellular morphology of the treated HeLa cells kept integrated and undamaged, visually indicating their biocompatibility towards cells. As photographed in Fig. 4E, HeLa cells internalized with HoBCDs emitted blue fluorescence under UV light excitation. In addition, HoBCDs were observed to localize at both cytoplasm and nucleus in Fig. 4F, indicating their considerable penetrability across cytomembrane and nuclear membrane. According to Kaiser test, considerable amount of free amino groups (1.72%, w/w) were presented on the surface of HoBCDs, facilitating HoBCDs to be endocytosed into cells [34-36].
Upon incubation with 1.0 mg/mL of HoBCDs for 24 h, T1-weighted scanning on a clinical MRI instrument was conducted on the treated HeLa cells. As shown in Fig. 4C, the grey-scaled T1-weighted image of HeLa cells incubated with HoBCDs was brighter than that of the blank group in the absence of HoBCDs. This was further demonstrated by quantitatively comparing the intensity of MR signal in the images, where the intensity for untreated cells and HoBCDs-treated cells was 123.6 ± 41.5 and 160.5 ± 34.6, respectively. Together with the results of cell fluorescence imaging, we are looking forward to further exploring HoBCDs as a novel FL/MR dual-modal imaging nanoprobe.
In summary, novel HoBCDs are facilely prepared through a onepot hydrothermal approach. Detailed characterizations validated that the as-prepared HoBCDs consist of amorphous carbon matrix and a little graphite-like structure inside, as well as abundant amino groups on the surface which offer good water solubility and cell-membrane permeability to HoBCDs. The strong chelation between Ho3+ and the carbon matrix effectively prevent the leakage of toxic Ho3+, ensuring their good biocompatibility. In addition to bright fluorescence with QY of 8%, HoBCDs noticeably exhibit positive contrast enhancement to MR signal in a concentration-dependent manner and further brighten the treated cells in T1-weighted images, though HoBCDs exhibited fairly low longitudinal relaxivity (r1 = 0.1128 (mmol/L)-1 s-1). To the best of our knowledge, it was the first time to report the synthesis and biomedical applications of Ho-doped CDs, which may pave a new way for further investigation in conditioning heteroatom-doped CDs as multi-modal FL/MR imaging nanoprobes.
AcknowledgmentsThe work was supported by grants from Tip-top Scientific and Technical Innovative Youth Talents of Guangdong special support program (No. 2014TQ01R417), the Fundamental Research Funds for the Central Universities (No. 17lgjc09), and Shenzhen Basic Research Program (No. JCYJ20170307140752183).
Appendix A. Supplementary dataSupplementary data associated with this article can be found, in the online version, at https://doi.org/10.1016/j.cclet.2017.10.023.
| [1] |
D.E. Lee, H. Koo, I.C. Sun, et al., Chem. Soc. Rev. 41 (2012) 2656-2672. DOI:10.1039/C2CS15261D |
| [2] |
M. Swierczewska, S. Lee, X.Y. Chen, Mol. Imaging 10 (2011) 3-16. |
| [3] |
Y. Xing, J.H. Zhao, P.S. Conti, K. Chen, Theranostics 4 (2014) 290-306. DOI:10.7150/thno.7341 |
| [4] |
C. Chen, Z.L. Wu, T.T. Wang, et al., Chin. J. Chem. 28 (2017) 1385-1390. |
| [5] |
W. Song, H.J. Zhang, Y.H. Liu, et al., Chin. J. Chem. 28 (2017) 1675-1680. |
| [6] |
M.C. Rong, K.X. Zhang, Y.R. Wang, X. Chen, Chin. J. Chem. 28 (2017) 1119-1124. |
| [7] |
X. Sun, Y. Lei, Trends Anal. Chem. 89 (2017) 163-180. DOI:10.1016/j.trac.2017.02.001 |
| [8] |
Y.P. Shi, Y. Pan, H. Zhang, et al., Biosens. Bioelectron. 56 (2014) 39-45. DOI:10.1016/j.bios.2013.12.038 |
| [9] |
S. Srivastava, R. Awasthi, D. Tripathi, et al., Small 8 (2012) 1099-1109. DOI:10.1002/smll.201101863 |
| [10] |
S. Sahu, N. Sinha, S.K. Bhutia, M. Majhi, S. Mohapatra, J. Mater. Chem. B 2 (2014) 3799-3808. DOI:10.1039/C3TB21669A |
| [11] |
A.B. Bourlinos, A. Bakandritsos, A. Kouloumpis, et al., J. Mater. Chem. 22 (2012) 23327-23330. DOI:10.1039/c2jm35592b |
| [12] |
H.M. Chen, G.D. Wang, W. Tang, et al., Adv. Mater. 26 (2014) 6761-6766. DOI:10.1002/adma.v26.39 |
| [13] |
Y.P. Shi, Y. Pan, J. Zhong, et al., Carbon 93 (2015) 742-750. DOI:10.1016/j.carbon.2015.05.100 |
| [14] |
Y. Pan, J. Yang, Y.N. Fang, et al., J. Mater. Chem. B 5 (2017) 92-101. |
| [15] |
F.Y. Du, L.R. Zhang, L. Zhang, et al., Biomaterials 121 (2017) 109-120. DOI:10.1016/j.biomaterials.2016.07.008 |
| [16] |
H. Liao, Z.Y. Wang, S. Chen, et al., RSC Adv. 5 (2015) 66575-66581. DOI:10.1039/C5RA09948J |
| [17] |
G.S. Hong, S.O. Diao, A.L. Antaris, H.J. Dai, Chem. Rev. 115 (2015) 10816-10906. DOI:10.1021/acs.chemrev.5b00008 |
| [18] |
K. Kattel, C.R. Kim, W. Xu, et al., J. Nanosci. Nanotechnol. 15 (2015) 7311-7316. DOI:10.1166/jnn.2015.10582 |
| [19] |
W. Xu, K. Kattel, J.Y. Park, et al., Phys. Chem. Chem. Phys. 14 (2012) 12687-12700. DOI:10.1039/c2cp41357d |
| [20] |
M. Norek, J.A. Peters, Prog. Nucl. Mag. Res. Sp. 59 (2011) 64-82. DOI:10.1016/j.pnmrs.2010.08.002 |
| [21] |
G.H. Lee, Y. Chang, J. Korean Phys. Soc. 67 (2015) 44-51. DOI:10.3938/jkps.67.44 |
| [22] |
S.W. Zielhuis, J.H. Seppenwoolde, C.J.G. Bakker, et al., J. Biomed. Mater. Res.A. 82A (2007) 892-898. DOI:10.1002/(ISSN)1552-4965 |
| [23] |
K. Kattel, J.Y. Park, W.L. Xu, et al., ACS Appl. Mater. Interfaces 3 (2011) 3325-3334. DOI:10.1021/am200437r |
| [24] |
W.L. Xu, B.A. Bony, C.R. Kim, et al., Sci. Rep. 3 (2013) 3210. DOI:10.1038/srep03210 |
| [25] |
D.L. Ni, W.B. Bu, S.J. Zhang, et al., Adv. Funct. Mater. 24 (2014) 6613-6620. DOI:10.1002/adfm.v24.42 |
| [26] |
D.L. Ni, J.W. Zhang, W.B. Bu, et al., Biomaterials 76 (2016) 218-225. DOI:10.1016/j.biomaterials.2015.10.063 |
| [27] |
L. Wang, X. Chen, Y.L. Lu, C.X. Liu, W.S. Yang, Carbon 94 (2015) 472-478. DOI:10.1016/j.carbon.2015.06.084 |
| [28] |
Y.Q. Dong, R.X. Wang, G.L. Li, et al., Anal. Chem. 84 (2012) 6220-6224. DOI:10.1021/ac3012126 |
| [29] |
Y.Q. Dong, R.X. Wang, H. Li, et al., Carbon 50 (2012) 2810-2815. DOI:10.1016/j.carbon.2012.02.046 |
| [30] |
Z.X. Gan, H. Xu, Y.L. Hao, Nanoscale 8 (2016) 7794-7807. DOI:10.1039/C6NR00605A |
| [31] |
Z.M. Zhang, Y. Pan, Y.N. Fang, et al., Nanoscale 8 (2016) 500-507. DOI:10.1039/C5NR06534H |
| [32] |
S.W. Yang, J. Sun, X.B. Li, et al., J. Mater. Chem. A 2 (2014) 8660-8667. DOI:10.1039/c4ta00860j |
| [33] |
C. Oerlemans, P.R. Seevinck, G.H. van de Maat, et al., Acta Biomater. 9 (2013) 4681-4687. DOI:10.1016/j.actbio.2012.08.038 |
| [34] |
Y. Pan, Y.P. Shi, J.Y. Chen, et al., Mater. Sci. Eng. C-Mater. Biol. Appl. 69 (2016) 561-568. DOI:10.1016/j.msec.2016.07.019 |
| [35] |
Z.M. Zhang, Y.P. Shi, Y. Pan, et al., J. Mater. Chem. B 2 (2014) 5020-5027. DOI:10.1039/C4TB00677A |
| [36] |
O. Boussif, F. Lezoualc'h, M.A. Zanta, et al., Proc. Natl. Acad. Sci. U. S. A. 92 (1995) 7297-7301. DOI:10.1073/pnas.92.16.7297 |