 2018, Vol. 29


 ,
Kemin Wanga
,
Kemin Wanga
b School of Science, Anhui Agricultural University, Hefei 230036, China
Apurinic/apyrimidinic endonuclease 1 (APE1) is a ubiquitous and multifunctional protein [1]. In the base excision repair (BER) pathway, APE1 is a central player, which is responsible for the incision of the DNA phosphodiester backbone at the 5' end of apurinic/apyrimidinic (AP) site [2]. Besides its role in DNA repair, APE1 also acts as a regulator in re-oxidation and transcription [3]. Notably, APE1 is universally expressed in all issues and cell types [4], and high APE1 expression could be associated with poor outcome, poor complete response rate to chemoradio therapy, poor long-term survival and higher angiogenesis [5]. Recently, more and more studies have shown that APE1 expression is associated with certain tumors, implying the high potential of APE1 in cancer diagnosis and treatment [6-8]. Consequently, the accurate detection of APE1 is crucial to both fundamental biomedical research and clinical diagnosis.
The most commonly method for APE1 detections is electrophoresis-based radioactive [9]. Although this method can achieve high sensitivity, there still exist some drawbacks, such as radioactive materials, specialized equipment, and a laboratory classified for handling radioactive assays. Various immunoassaybased strategies have also been applied for the detection of APE1, such as electro chemiluminescence assay (ECL) [10], enzymelinked immunosorbent assay (ELISA) [11], and electrochemical immunoassay [12]. Though these immunoassay-based methods obtained the concentration of APE1, they could not be used for detection of the catalytic activity of APE1. Several fluorescent methods with different assay formats (homogeneous and heterogeneous) [13-17] were developed for APE1 activity detection based on DNA probes, and enzyme-based amplification strategy was also applied to achieve higher sensitivity [17]. These researches indicated that insights into the activity of APE1 were of great importance, and it is still essential to develop sensitive methods for APE1 activity detection.
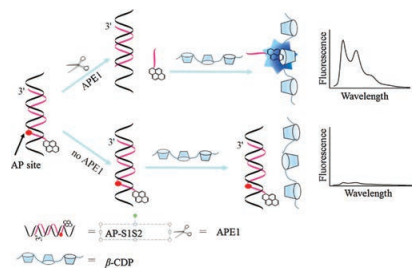
Host-guest interaction based on macrocyclic molecules is a very important phenomenon that has been extensively investigated. With multiple exterior interaction sites for guest inclusions, the supramolecular polymer brings about enhanced recognition ability for molecular self-assembly [18]. Host-guest interaction between β-cyclodextrin polymer (β-CDP) and pyrene has been applied to sensitive fluorescent analyses due to the simplicity and excellent fluorescence enhancement ability [19, 20]. Herein, a simple fluorescence strategy for sensitive detection of APE1 activity was developed based on host-guest interaction between β-CDP and pyrene. As illustrated in Scheme 1, the functional DNA probes (AP-S1S2) consisted of two strands (strand 1 and strand 2) were employed in the assay. Both terminals of strand 1 were prolonged. Strand 2 contained an AP site which could be identified by APE1, and a pyrene was labelled at the 50 end of the strand. When no APE1 was introduced, the pyrene labelled on AP-S1S2 could not enter the cavity of β-CDP due to the steric hindrance from 30 end of strand 1, so the fluorescence intensity was low. However, when APE1 was added, it recognized and cleaved its target phosphodiester bond immediately at the 50 end of the AP site in AP-S1S2, and then the pyrene-labelled oligonucleotide segment fell away from the AP-S1S2 because of its low melting temperature. Compared with AP-S1S2, the pyrene on the oligonucleotide segment was easily trapped into the cavity of β-CDP, leading to a significant fluorescence enhancement. Therefore, a fluorescent enhancement strategy for APE1 activity detection was constructed by host-guest interaction between β-CDP and pyrene.

|
Download:
|
| Scheme 1. Schematic representation of APE1 activity detection based on hostguest interaction between β-CDP and pyrene. | |
We began the study with the design of the DNA sequence, as shown in Table 1. APE1 and 10 × NEB buffer (200 mmol/L Tris-Ac, 500 mmol/L KAc, 100 mmol/L Mg(Ac)2, 10 mmol/L DTT, pH 7.9) were purchased from New England Biolabs (NEB, U.K.). The DNA sequence was synthesized and purified through HPLC by Shanghai Sangon Biotechnology Co., (Shanghai, China). β-CDP (Mn ~ 94, 400; GPC, Waters-515) [21] was synthesized according to the procedure reported previously [22]. All other chemicals, obtained from Sinopharm Chemical Reagent Co., Ltd. (Shanghai, China) were of analytical grade and used without further purification or treatment. All the solutions were prepared with ultrapure water obtained from a Millipore Water (18.2 MΩ·cm). All the tips and tubes were purchased from Shanghai Sangon Biotechnology Co. (Shanghai, China).
|
|
Table 1 Sequences of DNA strands |

All fluorescence measurements, including fluorescence intensity and fluorescence anisotropy, were performed on an F-7000 spectrophotometer (Hitachi, Japan) equipped with aqueous thermostat. Excitation and emission slits were all 5.0 nm with a 700 V PMT voltage. The excitation wavelength was set at 345 nm and the emission spectra from 365 nm to 480 nm were collected.
Firstly, AP site-containing double stranded probes (AP-S1S2) was prepared. Mixture of strand 1 (1μmol/L) and strand 2 (1μmol/L) in the 1 × NEB buffer was heated at 95 ℃ for 5 min, and then cooled to room temperature naturally. Then, solutions of APE1 with different activities were added to 100μL of 1 × NEB buffer containing AP-S1S2 (300 nmol/L) and β-CDP (3 mg/mL), respectively, and the mixture was incubated at 37 ℃ for 40 min. The fluorescence spectra were collected and the fluorescence data was recorded with the emission wavelength of 380 nm.
To further investigating the actual application, we selected Hela cells to simulate the complex samples. Hela cell lines were cultured in RPMI1640 cell medium with 10% inactivated fetal bovine serum (Hyclone, USA) at 37 ℃ in 5% CO2. First, vigorous growth cells were collected after trypsin digestion. Second, the cell density was determined using a hemocytometer. A suspension of 1 × 10⁶ cells was centrifuged at 1000 rpm for 3 min, then washed with PBS buffer (10 mmol/L phosphate, 137 mmol/L NaCl, and 2.7 mmol/L KCl, pH 7.4) for three times. After that the cells were suspended in 1 × NEB buffer, the cells were disrupted by sonication for 20 min at 0 ℃. The lysate was centrifuged at 18, 000 rpm for 20 min at 4 ℃, and the supernatants were recovered and stored at -20 ℃. The supernatant was ready for APE1 activity detection. The APE1 spiked samples were prepared by adding different activities of APE1 into the supernatant.
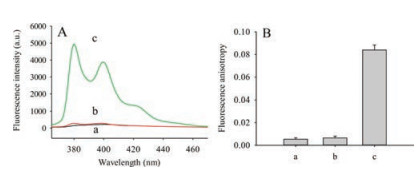
As shown in Fig. 1A, the feasibility of this method was investigated. In the absence of β-CDP or APE1, the fluorescence intensity was low (curves a and b); when both APE1 and β-CDP were present, fluorescence intensity enhanced greatly (curve c). Presumably, on the one hand, APE1 could identify and incise AP site of AP-S1S2, on the other hand, host-guest interaction between pyrene on oligonucleotide segment and β-CDP could achieve excellent fluorescence enhancement effect. This mechanism of fluorescence enhancement was similar to the previous report [19, 20].

|
Download:
|
| Fig. 1. Feasibility investigation of the proposed assay for APE1 activity. (A) Fluorescence emission spectra and (B) Fluorescence anisotropy of (a) 100 nmol/L AP-S1S1 + 20 U/mL APE1, (b) 100 nmol/L AP-S1S1 + 5 mg/mL β-CDP, (c) 100 nmol/L AP-S1S1 + 5 mg/mL β-CDP + 20 U/mL APE1. The reaction time was 90 min. λex/em = 345/380 nm. Error bars indicated the standard deviations of three experiments | |
Fluorescence anisotropy is sensitive to changes of series parameters containing molecular volume and molecular mass at a constant temperature [23]. When β-CDP or APE1 was absent, the pyrene on the oligonucleotide was free in solution, it rotated at a rate commensurate with its size and the fluorescence anisotropy was relatively small (a and b in Fig. 1B). As shown in Fig. 1B(a), β-CDP was absent, the pyrene on the oligonucleotide was free in solution; in Fig. 1B(b), APE1 was absent, the pyrene on the AP-S1S2 was also free in solution. Therefore, the pyrene in (a) or (b) was not trapped into the cavity of β-CDP, (a) and (b) in Fig. 1B showed near identical fluorescent polarization signal. However, if the fluorescent molecule formed a complex with β-CDP, its rotational rate decreased and the fluorescence anisotropy increased, since the degree of variation depended on the strength of the binding interaction and the size of the complex. As shown in Fig. 1B(c), a significant increase in fluorescence anisotropy was observed upon addition of β-CDP and APE1.
The above results confirmed that the proposed fluorescence method for APE1 activity detection could be performed as expected based on host-guest interaction between β-CDP and pyrene.
As we know, different experimental parameters, such as the concentration of β-CDP, the reaction time and the concentration of AP-S1S2 would affect the performance of the detection method. To ensure a better result, these factors were investigated. In this work, the fluorescence increasing factor was defined as (F - F0)/F0, where F and F0 were the fluorescence intensities of the samples with and without APE1, respectively.
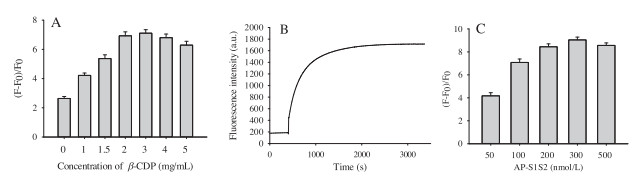
Since β-CDP acted as the host component of host-guest interaction between β-CDP and pyrene, the concentration of β-CDP was significant for fluorescent enhancement. Adding appropriate amount of β-CDP could gain favorable fluorescence enhancement and produce obvious signals. Otherwise, excess β-CDP might cause strong background signals. Therefore, the effect of β-CDP concentration was firstly investigated. As shown in Fig. 2A, when the concentration of β-CDP was 3 mg/mL, the (F - F0)/F0 was maximum, and 3 mg/mL of β-CDP was chosen as the optimized concentration in the following experiments.

|
Download:
|
| Fig. 2. The effects of different conditions of the proposed assay for APE1 activity. (A) Different concentrations of β-CDP, the concentrations of AP-S1S2 and the activity of APE1 were 100 nmol/L and 2 U/mL, respectively, the reaction time was 90 min; (B) Time curve of the fluorescence intensity, the arrow represented addition of 2 U/mL APE1, and the concentrations of AP-S1S2 and β-CDP were 100 nmol/L and 3 mg/mL, respectively; (C) Different concentrations of AP-S1S2, the concentrations of β-CDP and the activity of APE1 were 3 mg/mL and 2 U/mL, respectively, the reaction time was 40 min. F and F0 were the fluorescence intensities of the detection system in the presence and absence of APE1, respectively. λex/em = 345/380 nm. Error bars indicated the standard deviations of three experiments. | |
At the same time, it was especially useful to optimize the reaction time which could save time and reduce background signal. As shown in Fig. 2B, in the presence of APE1, fluorescence intensity was increased as the time prolonged and tended to be saturated when the reaction time was 40 min. Therefore, 40 min was chosen as the optimized time in the following experiments.
The concentration of AP-S1S2 also played an important role in the performance of this proposed method. Sufficient AP-S1S2 should be added to gain favorable fluorescence intensity; however, an obvious background signal would be observed at a relatively high concentration. Therefore, 300 nmol/L AP-S1S2 was chosen as the optimized concentration since the associated (F - F0)/F0 was the maximum (Fig. 2C).
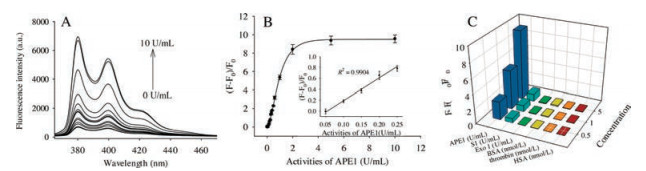
Under the above optimal conditions, the sensitivity of APE1 activity detection was explored through adding various activities of APE1. As shown in Fig. 3A, the fluorescent peaks at 380 nm and 400 nm were gradually increased with increasing APE1 activities. The corresponding calibration curve between (F - F0)/F0 and APE1 activities was shown in Fig. 3B. Notably, the inset of Fig. 3B clearly showed that (F - F0)/F0 exhibited a good linear relationship with APE1 activities in the range from 0.05 U/mL to 0.25 U/mL. The detection limit of this method was 0.05 U/mL, which was estimated by the 3σ rule (three times the standard deviation of the blank solution). The results were in good agreement with those obtained in previous study based on a double-loop frayed-end chimeric fluorescent probe [13]. However, the limit of detection is inferior to the method based on isothermal amplification signal amplification [17]. The performance of this assay might be further improved by combining signal amplification method.

|
Download:
|
| Fig. 3. (A) Fluorescence emission spectra with various activities of APE1. (B) Plot of (F - F0)/F0 vs. activities of APE1. Inset: The linear relationship between (F - F0)/F0 and the low APE1 activities. The activities of APE1 were 0.05, 0.1, 0.15, 0.20, 0.25, 0.30, 0.35, 0.40, 0.50, 0.60, 1.0, 2.0, 5.0, 10.0 U/mL, respectively. The concentrations of AP-S1S2 and β-CDP were 300 nmol/L and 3 mg/mL, respectively. The reaction time was 40 min. (C) Specificity investigation for APE1 against S1, Exo I, BSA, thrombin and HSA. The activities of enzymes (APE1, S1 and Exo I) was 0.5, 1, 5 U/mL, respectively; the concentrations of proteins (BSA, thrombin and HSA) was 0.5, 1, 5 nmol/L, respectively. The concentrations of AP-S1S2 and β-CDP were 300 nmol/L and 3 mg/mL, respectively. The reaction time was 40 min. λex/em = 345/380 nm. Error bars indicated the standard deviations of three experiments. | |
To verify the specificity of APE1 detection, the influence of some other enzymes and proteins, including S1 nuclease (S1), exonuclease Ⅰ (Exo Ⅰ), bovine serum albumin (BSA), thrombin, human serum albumin (HSA) were investigated. As shown in Fig. 3C, there were no remarkable fluorescence intensity increased upon the addition of the above enzymes or proteins, and only addition of APE1 could trigger a large fluorescence enhancement. These results demonstrated that the proposed strategy had good selectivity for APE1 activity detection.
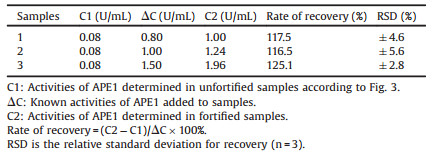
What is more, the 10% (v/v) HeLa cell extracts were employed to simulate the complex samples. Table 2 showed the recovery of APE1 from 10% HeLa cell extracts based on fluorescence enhancement (F - F0)/F0. Unfortunately, rates of recovery in 10% HeLa cell extracts were not satisfactory based on fluorescence enhancement. The reason might be that HeLa cell extracts affected the signal response of the proposed probes. The result indicated that fluorescence enhancement was not the suitable parameter for detection of APE1 activity in cell extracts.
|
|
Table 2 Recovery in 10% cell extracts based on fluorescence enhancement |
Fluorescence anisotropy is a function of molecular size and increases with increasing molecular size and molecular mass. As a ratiometric approach, it is stable to sample fluorescence fluctuation and photobleaching [24]. The binding of pyrene and β-CDP would yield a significant change in the rotational diffusion rates of the pyrene, resulting in detectable changes in their anisotropy values. Upon pyrene binding with small molecules in cells extracts, fluorescence intensity might increase, but fluorescence anisotropy was stable because of small changes of molecular volume and molecular mass. Therefore, fluorescence anisotropy was chosen as the parameter for APE1 activity detection in cell extracts.
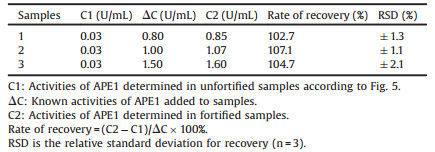
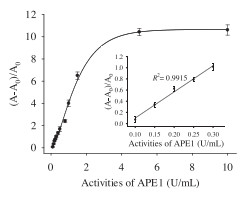
As shown in Fig. 4, fluorescence anisotropy exhibited a good positive dynamic correlation towards APE1 activities from 0 U/mL to 10 U/mL. And the inset clearly showed that (F - F0)/F0 exhibited a good linear relationship with APE1 activities in the range from 0.05 U/mL to 0.25 U/mL, the detection limit based on fluorescence anisotropy was 0.05 U/mL. As shown in Table 3, recovery of APE1 from 10% HeLa cell extracts was 102.7 ± 1.3% to 107.1 ±1.1%, which demonstrated that this proposed method could be more suitable for the detection of APE1 activity in cell extracts. Unfortunately, rates of recovery in 10% HeLa cell extracts were not satisfactory.

|
Download:
|
| Fig. 4. Fluorescence anisotropy of the proposed assay for various activities of APE1. The APE1 activities were 0, 0.1, 0.15, 0.20, 0.25, 0.30, 0.5, 0.8, 1.0, 1.5, 5.0, 10.0 U/mL, respectively. The concentrations of AP-S1S1 and β–CDP were 300 nmol/L and 3 mg/mL, respectively. The reaction time of enzyme digestion reaction was 40 min. λex/em = 345/380 nm. Error bars indicated the standard deviations of three experiments | |
|
|
Table 3 Recovery in 10% cell extracts based on fluorescence anisotropy |
In conclusion, a simple, sensitive and selective fluorescence assay was established for APE1 activity detection by introducing β-CDP as the efficient fluorescence enhancer. Taking advantage of the highly efficient in vitro enzyme digestion reaction, the enzyme activity information could be converted to a measurable fluorescence signal. This method offered several advantages. Firstly, it was a quick and simple method, without expensive instruments and cumbersome steps. Secondly, sensitive detection of APE1 activity was achieved with a limit detection of 0.05 U/mL. Thirdly, it could be used for quantitative measurement of the activity of APE1 in cell extracts. More importantly, the proposed method holds great promise for future advances in research on the cancer diagnosis, therapy and target drug development.
AcknowledgmentsThis work was supported by the National Natural Science Foundation of China (Nos. 21675047, 21375034, 21190040) and the Foundation for Innovative Research Groups of National Natural Science Foundation of China (No. 21521063).
| [1] |
S. oychoudhury, S. Nath, H. Song, et al., Mol. Cell. Biol. 37 (2017) e00401-e00416. |
| [2] |
P.S. Guerreir, S.G. Estácio, F. Antunes, et al., Chem. Biol. Drug Des. 88 (2016) 915-925. DOI:10.1111/cbdd.2016.88.issue-6 |
| [3] |
Q. Kong, W. Wang, L. Luo, X. Sun, Obstet. Invest. 82 (2017) 188-199. DOI:10.1159/000447261 |
| [4] |
J.L. Illuzzi, D.R. Mcneill, P. Bastian, et al., Environ. Mol. Mutagen. 58 (2017) 84-98. DOI:10.1002/em.v58.2 |
| [5] |
S.S. Laev, N.F. Salakhutdinov, O.I. Lavrik, Bioorg. Med. Chem. 25 (2017) 2531-2544. DOI:10.1016/j.bmc.2017.01.028 |
| [6] |
T. Santana, M.C. Sá, E.M. Santos, et al., J. Oral Pathol. Med. 46 (2017) 496-503. DOI:10.1111/jop.2017.46.issue-7 |
| [7] |
M. Sahadevan, O. Lee, M. Muzzio, et al., Biomarkers 22 (2017) 689-697. |
| [8] |
P.S. Guerreiro, E. Corvacho, J.G. Costa, et al., Chem. Biol. Drug Des. 90 (2017) 561-571. DOI:10.1111/cbdd.2017.90.issue-4 |
| [9] |
Wilson Ⅲ D.M., J. Mol. Biol. 345 (2005) 1003-1014. DOI:10.1016/j.jmb.2004.11.028 |
| [10] |
Y. Zhuo, N. Liao, Y. Chai, et al., Anal. Chem. 86 (2013) 1053-1060. |
| [11] |
L. Cesaratto, E. Codarin, C. Vascotto, et al., PLoS One 8 (2013) e70909. DOI:10.1371/journal.pone.0070909 |
| [12] |
J. Han, Y. Zhuo, Y. Chai, et al., Biosens. Bioelectron. 41 (2013) 116-122. DOI:10.1016/j.bios.2012.07.082 |
| [13] |
S. Fang, L. Chen, M. Zhao, Anal. Chem. 87 (2015) 11952-11956. DOI:10.1021/acs.analchem.5b03939 |
| [14] |
B. Liu, L. Peng, Anal. Methods 8 (2016) 862-868. DOI:10.1039/C5AY02309B |
| [15] |
J. Zhai, Y. Liu, S. Huang, S. Fang, M. Zhao, Nucleic Acids Res. 37 (2016) 3569-3579. |
| [16] |
M. Flaender, G. Costa, G. Nonglaton, Saint-Pierre C., D. Gasrutto, Analyst 141 (2016) 6208-6216. DOI:10.1039/C6AN01165A |
| [17] |
Y. Huang, Y. Ma, Y. Li, et al., New J. Chem. 41 (2017) 1893-1896. DOI:10.1039/C6NJ03477B |
| [18] |
X. Ma, Y. Zhao, Chem. Rev. 115 (2015) 7794-7839. DOI:10.1021/cr500392w |
| [19] |
C. Song, X. Yang, K. Wang, et al., Chem. Commun. 51 (2015) 1815-1818. DOI:10.1039/C4CC08991J |
| [20] |
P. Liu, S. Sun, X. Guo, et al., Anal. Chem. 87 (2015) 2665-2671. DOI:10.1021/ac503301q |
| [21] |
X. Guo, P. Liu, X. Yang, et al., Analyst 140 (2015) 2016-2022. DOI:10.1039/C4AN02402H |
| [22] |
C. Koopmans, H. Ritter, Macromolecules 41 (2008) 7418-7422. DOI:10.1021/ma801202f |
| [23] |
Y. Yu, Y. Liu, S.J. Zhen, C.Z. Huang, Chem. Commun. 49 (2013) 1942-1944. DOI:10.1039/c3cc38129c |
| [24] |
L. Cui, Y. Zou, N. Lin, et al., Anal. Chem. 84 (2012) 5535-5541. DOI:10.1021/ac300182w |