 2018, Vol. 29


b Hefei National Laboratory for Physical Sciences at the Microscale, CAS Key Laboratory of Materials for Energy Conversion, Department of Chemical Physics, University of Science and Technology of China, Hefei 230026, China;
c Department of Chemistry, Chungnam National University, Daejeon 34134, Republic of Korea
Cubic crystal phase strontium titanate (SrTiO3) exhibits an indirect band gap of ~3.2 eV (and a direct band gap of 3.75 eV) and has extensively been applied to energy (e.g., overall water splitting) and environment (e.g., pollutant removal) as a catalyst [1-15]. Many efforts have been devoted to increase catalytic performance by tailoring bulk/surface morphology and crystallization (e.g., by controlling exposed facet, defect and porosity formation), and by hybridizing two or more different materials (e.g., doping and Zscheme interfacing) [7-13]. Engineering defects and surfaces has been a good strategy to increase catalytic activity because defects in a catalyst surface generally act as active sites [7-10, 14, 15]. Light absorption and charge separation can be increased by increasing defects. However, excess defects are known to degrade the photocatalytic activity [14]. Tan et al. showed that an optimal atomic oxygen vacancy of 3.2% can increase a photocatalytic hydrogen production by 2.3-fold, compared with that of original SrTiO3 [14]. Surface reconstruction of SrTiO3 with optimal {023} and {001} facets was shown to increase a charge transfer ability and thereby enhance the photocatalytic activity for hydrogen evolution [16]. Black SrTiO3 nanocrystals showing substantially increased Ti3+ cations and oxygen vacancies were reported to be prepared by a molten aluminum reduction method [17]. The final powder product showed an enhanced visible and near IR absorption, and the resultant photocatalytic activity for hydrogen generation was increased by > 2.4-fold, compared with that of untreated white SrTiO3 [17]. Crystallite size and morphology have been tailored to increase photocatalytic activity, thereby various morphologies (e.g., particles, nanowires, and mesoporous films) have been prepared by employing diverse synthetic methods such as wet hydrothermal and solvothermal methods [11, 15, 18-25]. Yang et al. synthesized porous SrTiO3 microspheres by a sol-gel templating method using SrCO3 granule template with agarose fiber [18]. The resultant powder showed a high photocatalytic reduction activity for Cr(Ⅵ) reduction to Cr(Ⅲ), attributed to bimodal pore architecture and band gap matching. Hybridization of two or more materials has commonly improved a charge transfer rate at the interface (e.g., SrTiO3/TiO2/H-titanate nanofiber composite, a Z-scheme design) thereby to increase catalytic activity [26-30]. Zhang et al. loaded 0.5% Ag nanoparticles in pristine SrTiO3 and observed two times higher photocatalytic (λ > 420 nm) NO removal activity, attributed to plasmonic resonance absorption [31]. Ham et al. treated cubic shape SrTiO3 by SrCl2 in an alumina crucible, and found that Al-doping improved a photocatalytic activity in the overall water splitting reaction [25]. Band gap is an important factor and can be tuned by doping various single or bimetals with cationic or anionic properties [6, 32]. Modak and Ghosh found that the presence of La element in Rh-SrTiO3 could increase a photocatalytic hydrogen evolution, where La not only minimizes oxygen vacancy formation but also suppresses inert Rh4+ state formation [32].
The present study was designed to further improve the catalytic activity of bare SrTiO3 nanoparticles (NPs) by surface loading with metallic and nonmetallic material. Rh was chosen as metallic and loaded by wet-impregnation method. For nonmetallic carbon, aerobic and anaerobic ethanol oxidation reactions were first introduced to be an efficient carbon-coating method on a catalyst surface. Both metallic and nonmetallic surface modifications were demonstrated to highly improve the electrocatalytic activity of SrTiO3 NPs.
For the synthesis of SrTiO3 NPs, 3 mmol of strontium chloride hexahydrate, SrCl2·6H2O (99.0%, Alfa Aesar) was dissolved in 20 mL of deionized water, and 3 mmol of titanium(Ⅳ) isopropoxide (TTIP, ≥97.0%, Sigma-Aldrich) was dissolved in 10 mL ethanol. The ethanol solution was then quickly mixed into the Sr2+ aqueous solution to avoid forming hydrated Ti. Afterwards, 5 mL of 3.0 mol/L NaOH solution was added into the mixed solution and stirred for 30 min. The fully mixed solution was transferred to a Teflon-lined autoclave and heated to 200 ℃ in an oven for 24 h. After the reaction, the autoclave was naturally cooled to room temperature, and the white precipitates were collected by washing and centrifugation repeatedly. The fully washed powder was dried in an oven setting at 80 ℃. The dried sample was annealed at 600 ℃ for 2 h. Rh (1 mol%) were loaded on the SrTiO3 NPs by a wet impregnation method. The SrTiO3 powder was dispersed in ethanol solvent and 1 mol% of 0.1 mol/L Rh aqueous solution was added to the powder-dispersed solution. The solution was stirred and warmly heated for gentle evaporation of the solvent. After the solvent was completely dried, the collected powder was annealed at 600 ℃ for 2 h. For coating carbon on the NPs, aerobic (5% O2/N2 gas introduction) and anaerobic (pure N2 gas introduction) ethanol oxidation reactions were performed. Details are described elsewhere [33, 34]. Briefly, ethanol vapour were introduced into the SrTiO3 powder by 5% O2/N2 (or pure N2) gas purging with increasing the reaction temperature up to 600 ℃. The reaction at 600 ℃ was kept for 1.5 h.
The morphologies of the prepared samples were examined using a Hitachi S-4800 scanning electron microscope (SEM) images at an acceleration voltage of 10.0 keV. The crystal structures of the samples were examined using a PANalytical X'Pert Pro MPD X-ray diffractometer (XRD) with Cu Kα radiation (40.0 kV and 30.0 mA). A Thermo-VG Scientific K-Alpha spectrometer was used to perform X-ray photoelectron spectroscopy (XPS), where a hemispherical energy analyzer and a monochromated Al Kα X-ray (E = 1486.6 eV) source were used. A Horiba XploRA Plus Raman spectrometer was used to collect Raman spectra with a laser wavelength of 532 nm and a 100× objective. A SCINCO NeoSys-2000 double beam UV–vis spectrophotometer was utilized to collect reflectance diffuse UV–vis absorption spectra.
A typical three-electrode (the sample working, a Pt wire counter and a Ag/AgCl reference electrodes) system was used for electrochemical measurements. For the preparation of the working electrode, 25 mg of a sample was mixed with appropriate amounts of α-terpineol and ethyl cellulose ethanol solution. The viscous solution was pasted on a Si substrate and dried in a vacuum oven at 40 ℃. Cyclic voltammetry (CV), linear sweep voltammetry (LSV) and impedance (the frequency range from 0.01 Hz to 0.1 MHz) tests were conducted in a 0.1 mol/L aqueous Na2SO4 solution using a ZIVE SP1 electrochemical workstation (WonaTech Co., ) at room temperature.
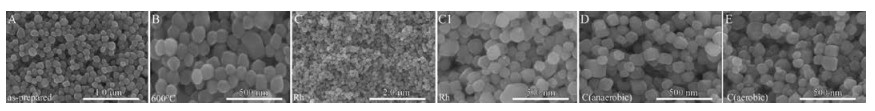
Fig. 1 displays typical SEM images of the as-prepared, 600 ℃-annealed, Rh-loaded, C-coated (by anaerobic), and C-coated (by aerobic) SrTiO3 NPs. All the samples showed similar morphology of distorted polyhedron. The sizes were estimated to be less than 100 nm and showed no critical differences between the samples. A Brunauer-Emmett-Teller (BET) surface area was measured to be 11.0 m2/g for the as-prepared NPs. The white color of the asprepared sample showed no change after thermal-annealing at 600 ℃. However, the Rh-loaded and C-coated samples showed different colors from the bare SrTiO3 NPs, discussed below.

|
Download:
|
| Fig. 1. SEM images of as-prepared (A), 600 ℃-annealed (B), Rh-loaded (C and C1), anaerobic C-coated (D), and aerobic C-coated (E) SrTiO3 NPs. | |
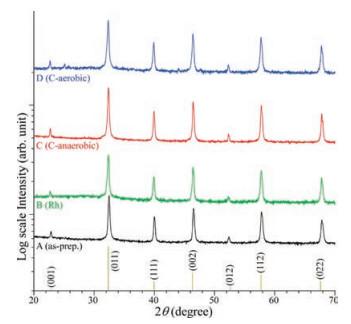
Their XRD patterns were collected and displayed in Fig. 2 to examine the crystal phase of the samples. All the samples showed the same XRD patterns, indicating the same crystal structure. The peaks were commonly found at 22.5°, 32.4°, 39.9°, 46.4°, 52.3°, 57.8°, and 67.8°, attributed to the diffraction peaks of the (001), (011), (111), (002), (112), and (022) crystal planes for cubic phase (Pm-3m) perovskite strontium titanate, SrTiO3 (reference No. 98- 007-6186) [14, 18, 31]. No other XRD peaks of Rh (1 mol%) and carbon were observed, indicating that the surface-loaded amount was extremely small and/or the crystal phase was amorphous.

|
Download:
|
| Fig. 2. XRD diffraction patterns of as-prepared (A), Rh-loaded (B), anaerobic Ccoated (C), and aerobic C-coated (D) SrTiO3 NPs. | |
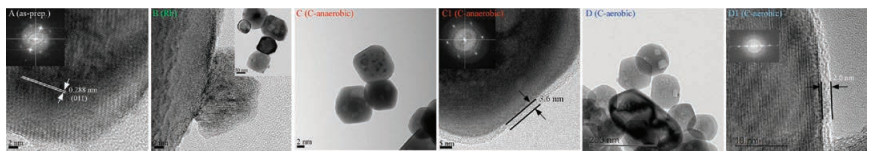
Transmission electron microscopy (TEM) and high resolution TEM (HRTEM) images were obtained for the as-prepared bare, Rhloaded, anaerobic C-coated, and aerobic C-coated SrTiO3 NPs to understand their microstructures. For the HRTEM image of a bare SrTiO3 NP (Fig. 3A), clear lattice fringes and the corresponding fast Fourier transform (FFT) pattern were observed, indicating a high crystalline nature of the NP. The lattice plane was observed to be 0.288 nm, corresponding to the [011] crystal plane of cubic SrTiO3 [14, 18]. For the TEM image of the Rh-loaded NP (Fig. 3B), much smaller NPs were appeared to be decorated on the surface of the SrTiO3 NP. For a Rh NP (Fig. 3B insert), clear lattice images were obtained although no single crystallinity was observed. For the TEM images of the carbon-coated SrTiO3 NPs by anaerobic (under N2 flow) and aerobic (under 5% O2/N2 flow) ethanol oxidation reactions (Figs. 3C and D), uniformly coated carbon shell was observed. However, the NP by aerobic conditions (Fig. 3D) clearly shows porosity, which may play an important role in the increased catalytic activity. The thicknesses of the carbon shells by the anaerobic and aerobic reactions were measured to be 3.6 nm and 2.0 nm, respectively, and very uniformly coated on the surface by the ethanol oxidation reaction, which could be very useful for uniform carbon coating on a metal oxide material [33, 34]. The thinner carbon shell was formed for the aerobic reaction, due to free CO2 formation by a reaction of surface carbon and O2. The thinner carbon shell and the created active sites at the interface may increase the catalytic activity, compared with the NPs with thicker carbon shell and less porosity.

|
Download:
|
| Fig. 3. TEM and HRTEM images of bare as-prepared (A), Rh-loaded (B), anaerobic C-coated (C and C1), and aerobic C-coated (D and D1) SrTiO3 NPs. Insets (A, C1 and D1) show the corresponding FFT patterns. | |
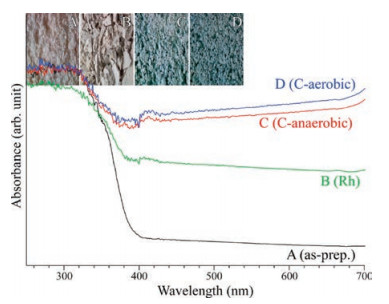
UV–vis reflectance absorption spectra (Fig. 4) were obtained to examine the band gap of a material. For bare SrTiO3 NPs, the absorption onset was observed at around 395 nm, corresponding to 3.14 eV, in good consistent with the literature [14]. The absorption in the visible region was increased in the order of as-prepared sample ≪ Rh-loaded sample < C-anaerobic < C-aerobic. As seen in the inset of Fig. 4, the color of the bare SrTiO3 NPs was critically different from those of surface-modified SrTiO3 NPs.

|
Download:
|
| Fig. 4. Reflectance UV–vis absorption spectra of as-prepared (A), Rh-loaded (B), anaerobic C-coated (C), and aerobic C-coated (D) SrTiO3 NPs. Inset shows the digital camera photo images of the corresponding samples. | |
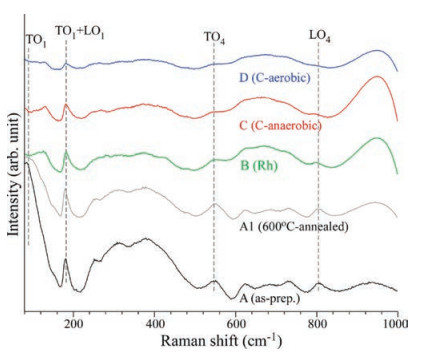
Fig. 5 displays the Raman spectra of the as-prepared (A), 600 ℃annealed (A1), Rh-loaded (B), anaerobic C-coated (C), and aerobic C-coated (D) SrTiO3 NPs. Generally, the fundamental first-order phonon modes of centrosymmetric tetragonal SrTiO3 are Raman inactive [35]. The as-prepared sample (A) showed stronger peaks than those of the other samples, indicative of symmetry breakdown of the as-prepared sample. The spectral peaks were found at 110 (TO1), 180 (TO2 + LO1), 560 (TO4), and 800 cm-1 (LO4) [35]. Although the spectral features were very similar the peak at 110 cm-1 was drastically diminished upon surface loading with Rh and carbon (by aerobic and anaerobic), indicative of a change in surface lattice structure. The broad peaks between 200 cm-1 and 500 cm-1 and some spectral peaks between 600 cm-1 and 800 cm-1 were attributed to second-order phonon peaks [36].

|
Download:
|
| Fig. 5. Raman spectra of as-prepared (A), 600 ℃-annealed (A1), Rh-loaded (B), anaerobic C-coated (C), and aerobic C-coated (D) SrTiO3 NPs. | |
XPS (Fig. 6) was used to verify the surface chemical states and explain origin of the catalytic activity for surface-modified SrTiO3 NPs. The survey spectra (not shown here) commonly showed the elements of Sr, Ti and O of SrTiO3 as expected. For the Sr 3d of bare SrTiO3 NPs, two peaks were observed at 133.2 eV and 134.9 eV, corresponding to Sr 3d5/2 and Sr 3d3/2 spin-orbit interaction peak splitting (ΔEso = 1.7 eV), respectively and attributing to Sr2+ oxidation state of SrTiO3 [18, 26, 31]. For Ti 2p XPS of bare SrTiO3, two spin-orbit splitting peaks (ΔEso = 5.7 eV) of Ti 2p3/2 and Ti 2p1/2 were observed at 458.4 eV and 464.1 eV, attributed to Ti4+ of SrTiO3, in good consistent with the literatures [18, 26, 31]. No discernible peak of Ti3+ was observed. For C-coated SrTiO3 by an aerobic ethanol oxidation, the Sr 3d5/2 peak was shifted by 0.4 eV to a higher binding energy (BE) position. In addition, the Ti 2p3/2 peak was shifted by 0.7 eV to a higher BE position. For the O 1s XPS peak of bare SrTiO3, two peaks were observed at 529.6 eV and 531.6 eV, attributed to lattice O2- of SrTiO3 and surface O-H groups/oxygen defects, respectively [14, 18]. The higher binding energy peak has generally been associated with defects, which are commonly used for explaining the origin of catalytic activity. The major O 1s peak for C-coated SrTiO3 was located at 530.1 eV, which is 0.5 eV higher than that for bare SrTiO3. The higher BEs of Sr 3d, Ti 2p and O1s for C-coated SrTiO3 could be due to not final state charging but initial state electronic effect because the C 1s XPS peak for C-coated SrTiO3 was observed at 284.8 eV, 0.5 eV lower than that for bare SrTiO3.

|
Download:
|
| Fig. 6. Sr 3d, Ti 2p, O 1s, and C 1s XPS spectra for bare (red) and aerobic C-coated (blue) SrTiO3 NPs. The insets show the normalized spectra of the corresponding Sr 3d and O 1s spectra. | |
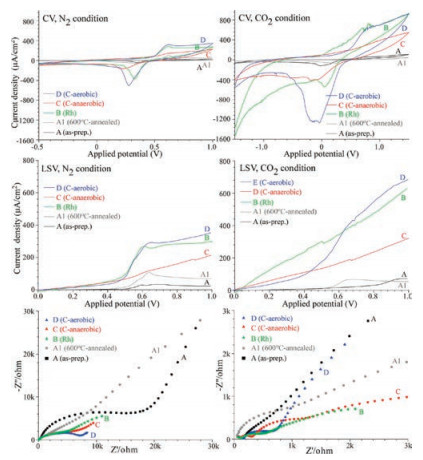
Fig. 7 shows the CV, LSV curves, and Nyquist impedance plots for as-prepared (A, black), 600 ℃-annealed (A1, gray), Rh-loaded (B, green), anaerobic C-coated (C, red), and aerobic C-coated (D, blue) SrTiO3 NPs under N2 and CO2 bubbling conditions. CV curves were obtained over the potential range from -0.5 V to 1.0 V at a scan rate of 10 mV/s. Reduction and oxidation (redox) peaks were observed and dependent on the samples. The areas of the CV curves for the surface-modified SrTiO3 NPs were found to be significantly increased, compared with those of bare (as-prepared and 600 ℃-annealed) SrTiO3 NPs. The aerobic C-coated and Rhloaded SrTiO3 NPs showed a much higher current density than other samples. For the LSV curves in N2 bubbling condition, the current density at a potential of 1.0 V showed the order of as-prepared sample (25 μA/cm2) < 600 ℃-annealed sample (73 μA/cm2) ≪ anaerobic C-coated (215 μA/cm2) ≪ Rh-loaded sample (300 μA/cm2) < aerobic C-coated (350 μA/cm2). The current density of the bare SrTiO3 NPs was drastically increased by 14-fold upon carbon-loading. The aerobic C-coated SrTiO3 NPs showed a comparable current density to that of the Rh-loaded sample, an indication of comparable electrocatalytic water splitting performance.

|
Download:
|
| Fig. 7. CV (top), LSV (middle) and impedance (bottom) data for as-prepared (A, black), 600 ℃-annealed (A1, gray), Rh-loaded (B, green), anaerobic C-coated (C, red), and aerobic C-coated (D, blue) SrTiO3 NPs in N2 (left panel) and CO2 (right panel) conditions. | |
For the LSV curves under CO2 bubbling condition, the current density showed the order of 600 ℃-annealed sample (55 μA/cm2) < as-prepared sample (70μA/cm2) ≪ anaerobic C-coated (320 μA/cm2) ≪ Rh-loaded sample (635μA/cm2) < aerobic Ccoated (680 μA/cm2). The current density of the aerobic C-coated sample was 12-fold higher than that of 600 ℃-annealed SrTiO3 NPs. For the Nyquist plots consisting of imaginary (Z") and ideal (Z') parts, the low frequency region commonly showed a straight slope representing Warburg diffusion resistance [37-39]. The high frequency region showed a curved semi-circle representing solution/charge-transfer resistance [37-39]. For N2 bubbling condition, the radius of the semi-circle showed the order of Rhloaded sample ≈ C-aerobic < C-anaerobic < 600 ℃-annealed sample < as-prepared sample. The Rh-loaded and the aerobic C-coated samples showed less resistance, consistent with the higher electrocatalytic activities of the samples. For CO2 bubbling condition, the Rh-loaded and the aerobic C-coated samples also showed smaller semi-circle and less resistance. These results demonstrate that the loading of metallic Rh and non-metallic carbon can enhance the electrocatalytic performance of SrTiO3 to a similar extent. Thus, it is the structure of SrTiO3, instead of the loaded Rh and carbon, that determines the electrocatalytic performance.
Carbon shell and Rh NPs were loaded on the surface of SrTiO3 NPs and their catalytic activities were examined by performing water splitting and CO2 reduction. Anaerobic and aerobic oxidation reactions were found to show a good method to uniformly coat nm-thick carbon shell on a catalyst surface. Carbon-coated SrTiO3 NPs by the aerobic oxidation showed a comparable catalytic activity to Rh-loaded SrTiO3 NPs. Their electrocatalytic activities in water splitting and CO2 reduction showed more than 10-fold enhancement upon Rh and C-loading, compared with those for bare SrTiO3 NPs. Overall, the present study further deepens the importance of surface modification using metallic Rh and nonmetallic carbon for improving catalytic activity and highlights the key role of SrTiO3 structure in determining the electrocatalytic performance of modified SrTiO3 materials.
AcknowledgmentsThis study was supported financially by the National Research Foundation of Korea (NRF) grant funded by the Korea government (MEST) (No. 2016K2A9A2A06004534), the National Natural Science Foundation of China (Nos. 21525313, 21611540334).
| [1] |
J.D. Baran, C. Eames, K. Takahashi, et al., Chem. Mater. 29 (2017) 7364-7370. DOI:10.1021/acs.chemmater.7b02253 |
| [2] |
R. Niishiro, S. Tanaka, A. Kudo, Appl. Catal. B 150-151 (2014) 187-196. DOI:10.1016/j.apcatb.2013.12.015 |
| [3] |
Y. Yamaguchi, C. Terashima, H. Sakai, et al., Chem. Lett. 45 (2016) 42-44. DOI:10.1246/cl.150907 |
| [4] |
Y. Yamaguchi, S. Usuki, Y. Kanai, et al., ACS Appl. Mater. Interfaces 9 (2017) 31393-31400. DOI:10.1021/acsami.7b07786 |
| [5] |
K. Iwashina, A. Kudo, J. Am. Chem. Soc. 133 (2011) 13272-13275. DOI:10.1021/ja2050315 |
| [6] |
B. Modak, S.K. Ghosh, J. Phys. Chem. C 119 (2015) 23503-23514. DOI:10.1021/acs.jpcc.5b06667 |
| [7] |
M. Long, L. Zheng, Chin. J. Catal. 38 (2017) 617-624. DOI:10.1016/S1872-2067(17)62821-3 |
| [8] |
L. Gu, H. Wei, Z. Peng, H. Wu, J. Mater. Res. 32 (2017) 748-756. DOI:10.1557/jmr.2016.461 |
| [9] |
G. Zhang, W. Jiang, S. Hua, et al., Nanoscale 8 (2016) 16963-16968. DOI:10.1039/C6NR04859E |
| [10] |
H. Trabelsi, M. Bejar, E. Dhahri, et al., Appl. Surf. Sci. 426 (2017) 386-390. DOI:10.1016/j.apsusc.2017.07.128 |
| [11] |
K. Yu, C. Zhang, Y. Chang, et al., Appl. Catal. B 200 (2017) 514-520. DOI:10.1016/j.apcatb.2016.07.049 |
| [12] |
S. Okunaka, H. Tokudome, R. Abe, Catal. Sci. Technol. 6 (2016) 254-260. DOI:10.1039/C5CY00979K |
| [13] |
S. Okunaka, H. Tokudome, R. Abe, J. Mater. Chem. A 3 (2015) 14794-14800. DOI:10.1039/C5TA02903A |
| [14] |
H. Tan, Z. Zhao, W. Zhu, et al., ACS Appl. Mater. Interfaces 6 (2014) 19184-19190. DOI:10.1021/am5051907 |
| [15] |
L.A. Crosby, R.M. Kennedy, B.R. Chen, et al., Nanoscale 8 (2016) 16606-16611. DOI:10.1039/C6NR05516H |
| [16] |
B. Wang, S. Shen, L. Guo, ChemCatChem 8 (2016) 798-804. DOI:10.1002/cctc.v8.4 |
| [17] |
W. Zhao, W. Zhao, G. Zhu, et al., CrystEngComm 17 (2015) 7528-7534. DOI:10.1039/C5CE01263E |
| [18] |
D. Yang, Y. Sun, Z. Tong, Y. Nan, Z. Jiang, J. Hazard. Mater. 312 (2016) 45-54. DOI:10.1016/j.jhazmat.2016.03.032 |
| [19] |
H. Zhan, Z.G. Chen, J. Zhuang, et al., J. Phys. Chem. C 119 (2015) 3530-3537. DOI:10.1021/jp512448p |
| [20] |
V. Kalyani, B.S. Vasile, A. Ianculescu, et al., Cryst. Growth Des. 15 (2015) 5712-5725. DOI:10.1021/acs.cgd.5b00770 |
| [21] |
G. Canu, V. Buscaglia, CrystEngComm 19 (2017) 3867-3891. DOI:10.1039/C7CE00834A |
| [22] |
B.E. Kayaalp, Y.J. Lee, A. Kornowski, et al., RSC Adv. 6 (2016) 90401-90409. DOI:10.1039/C6RA13800D |
| [23] |
A.L. Sangle, S. Singh, J. Jian, et al., Nano Lett. 16 (2016) 7338-7345. DOI:10.1021/acs.nanolett.6b02487 |
| [24] |
P. Zhang, T. Ochi, M. Fujitsuka, et al., Angew. Chem. 129 (2017) 5383-5387. DOI:10.1002/ange.201702223 |
| [25] |
Y. Ham, T. Hisatomi, Y. Goto, et al., J. Mater. Chem. A 4 (2016) 3027-3033. DOI:10.1039/C5TA04843E |
| [26] |
Y. Liu, Z. Wang, W. Wang, et al., Appl. Surf. Sci. 315 (2014) 314-322. DOI:10.1016/j.apsusc.2014.07.143 |
| [27] |
Q. Wang, T. Hisatomi, S.S.K. Ma, Y. Li, K. Domen, Chem. Mater. 26 (2014) 4144-4150. DOI:10.1021/cm5011983 |
| [28] |
T. Han, Y. Chen, G. Tian, et al., Sci. China Mater. 59 (2016) 1003-1016. DOI:10.1007/s40843-016-5126-1 |
| [29] |
M. Faisal, F.A. Harraz, A.A. Ismail, et al., Sep. Purif. Technol. 190 (2018) 33-44. DOI:10.1016/j.seppur.2017.08.037 |
| [30] |
Z. Wu, Y. Zhang, X. Wang, Z. Zou, New J. Chem. 41 (2017) 5678-5687. DOI:10.1039/C7NJ00522A |
| [31] |
Q. Zhang, Y. Huang, L. Xu, et al., ACS Appl. Mater. Interfaces 8 (2016) 4165-4174. DOI:10.1021/acsami.5b11887 |
| [32] |
B. Modak, S.K. Ghosh, J. Phys. Chem. B 119 (2015) 11089-11098. DOI:10.1021/acs.jpcb.5b02906 |
| [33] |
W.J. Kim, S.W. Lee, Y. Sohn, Sci. Rep. 5 (2015) 13448. DOI:10.1038/srep13448 |
| [34] |
Y.I. Choi, S.K. Kim, S.W. Lee, Y. Sohn, J. Alloys Compds. 687 (2016) 611-615. DOI:10.1016/j.jallcom.2016.06.175 |
| [35] |
D.A. Tenne, A.K. Farrar, C.M. Brooks, et al., Appl. Phys. Lett. 97 (2010) 142901. DOI:10.1063/1.3499273 |
| [36] |
Y. Zhang, S.L. Li, J. Li, et al., Appl. Phys. Lett. 101 (2012) 043502. DOI:10.1063/1.4738894 |
| [37] |
S. Lee, J.S. Kang, K.T. Leung, et al., J. Indus. Eng. Chem. 43 (2016) 69-77. DOI:10.1016/j.jiec.2016.07.049 |
| [38] |
S. Lee, J.S. Kang, K.T. Leung, S.K. Kim, Y. Sohn, Appl.Suf.Sci. 386 (2016) 393-404. DOI:10.1016/j.apsusc.2016.06.050 |
| [39] |
Y.I. Choi, H.J. Yoon, S.K. Kim, Y. Sohn, Appl. Catal. A 519 (2016) 56-67. DOI:10.1016/j.apcata.2016.03.027 |