 2018, Vol. 29


 ,
Keyong Houb
,
Keyong Houb
b Key Laboratory of Separation Science for Analytical Chemistry, Dalian Institute of Chemical Physics, Chinese Academy of Sciences, Dalian 116023, China;
c University of Chinese Academy of Sciences, Beijing 100039, China
It is imperative to develop on-line or on-site analytical instrument for industrial processes and environmental monitoring due to the huge number of samples and the need for continuous monitoring [1]. Mass spectrometry has become the "gold standard" in the field of chemical qualitative analysis. More and more Chinese national standards use mass spectrometry as analytical detector, and a lot of attention has been given to the development of sensitive portable/miniature mass spectrometry for on-site rapid analysis in the literature [2]. The ionization source, which determines the analytical sensitivity, spectral characteristics and detection scope of the compounds, has become an increasingly important technique on the scope of mass spectrometer [3]. Soft ionization has become the dominant method for online mass spectrometry due to its relative low degree of fragmentation and straightforward spectral interpretation [4, 5].
Recent innovations in soft ionization of mass spectrometry for the direct analysis of various volatile organic compounds [6], e.g., proton transfer reaction ionization (PTR) [7-9], extractive electrospray ionization (EESI) [10, 11], direct analysis in real time (DART) [12] and ultraviolet single photon ionization (SPI) [13], facilitate the applications of online or on-site analysis. However, the miniaturized vacuum system of the portable mass spectrometer dramatically reduces the injection volume of the analyte and thereby leads to the low sensitivity. The commercialized low pressure Kr gas VUV (vacuum ultraviolet) lamp (photon energy is 10.6 eV), which is small size, low cost and low power consumption, has been widely used in the single photon ionization mass spectrometer for on-site environmental pollutant analysis. However, the photon flux of the Kr-VUV lamp is limited to 1011 photons/ s which is not high enough for trace analysis, and the photon energy of 10.6 eV also limits the detection scope to the analyte with ionization energy (IE) lower than 10.6 eV. Therefore, for the VUV lamp based ionization source portable mass spectrometer, only by improving these two most important specifications, i.e., sensitivity and detection scope, can it be widely applied to on line or on-site analysis.
In order to improve the performance of VUV-SPI ionization sources, Zimmermann et al. [14] designed a high photon flux VUV lamps up to 1014 photons/s, known as electron-beam pumped raregas excimer light sources (EBELs). And an SPI-MS LOD of 35 ppb was achieved for toluene with a measurement time of 0.65 s by a EBELs-TOFMS. But, the on-site application for this EBELs-TOFMS is limited due to the weight and volume of the high-vacuum system required by the EBELs. Shu et al. [15] designed a microwave discharge induced high-power VUV lamp SPI source with an optical baffle for preventing VUV light from entering the ionmigration lens assembly, and with this baffle, the baselines of the mass spectra decreased from 263.6 ± 15.7 counts to 4.1 ± 1.8 counts. Pan et al. [16] designed a pair of aluminum-coated disk electrodes with circular center cavities for Kr-VUV lamp. VUV light can be reflected back and forth in the photoionization region between the aluminum-coated electrodes, thus the signal amplification of VUV lamp can be enhanced around 4-folds comparing to uncoated electrodes. Li Haiyang's group, from Dalian Institute of Chemical Physics, Chinese Academy of Sciences, has designed a series of soft ionization sources based on VUV lamp for on line mass spectrometer since 2003 [17-21]. The summarized soft ionization sources can be found in Table S1 (Supporting information). Gao et al. developed a single photon ionization time-of-flight mass spectrometer combined with membrane, the LODs of toluene and xylene are 0.5 ppbv and 0.4 ppbv, respectively, with scan frequency of 10 kHz [22]. These VUV lamp soft ionization sources mentioned above are almost based on laboratory bench-top mass spectrometer, which is not used in miniature mass spectrometer.
Presented here is a novel, radiofrequency field enhanced chemical ionization source on the base of Kr-VUV lamp for miniature time-of-flight mass spectrometer (TOFMS). The miniature TOFMS uses a three-stage differential vacuum system, and the pressure inside of ionization pressure increased to 90 Pa. The radiofrequency electric field was used to modulate photoelectron and enhance the chemical ionization for improving the sensitivity and extending the detection range of organic compounds of miniature TOFMS.
Fig. 1 shows the schematic diagram of miniature TOFMS and radiofrequency field enhanced chemical ionization source (RFECI). The RF-ECI ion source consists of a commercial 10.6 eV krypton discharge lamp (PKS106, Cathodeon Ltd., Cambridge, U.K., 19.6 mm in diameter, 52 mm in length) and an ionization region. The VUV lamp with photon flux of 1 × 10¹¹ photons/s is set outside the ionization chamber and sealed with an O-ring. The ionization region comprises eight circular steel stainless electrodes: one repelling electrode (6 mm length, 14 mm i.d., 38 mm o.d.), six focusing electrodes (named SE1-SE6, with 5.5 mm length, 14 mm i.d., 38 mm o.d.), and one orifice electrode (with a central hole of 0.5 mm diameter). These electrodes are separated by the PTEF insulation washers, and the distance from the VUV lamp light window to the surface of orifice electrode is 17.4 mm. DC voltages of V1, V2, and V3 were applied to the repelling electrode, SE6, and orifice electrode separately with three individual DC power supplies. The electrodes from repelling electrode to SE6 electrode are connected one by one with 2 MΩ resistors to produce a uniform DC field, while the voltage of V3 applied at orifice electrode was controlled independently. A two-channel radiofrequency (RF) voltage Vrf with 180° phase difference is applied separately to the adjacent focusing electrode by a 10 nF capacitor, respectively.

|
Download:
|
| Fig. 1. Schematic diagram of miniature TOFMS (a) and RF-ECI source (b). | |
The ion source could work at two different operation modes, i.e., the SPI and RF-ECI modes, by simply switching Vrf on and off. At SPI mode, the Vrf was turn off and the V1 was set to 36 V DC voltage, and there is only uniform DC field inside of the ionization source. At RF-ECI mode, the Vrf was turn on and the V1 was set to 36 V DC voltage and the radiofrequency field and DC field coupled together inside of the ionization source.
A miniature orthogonal acceleration reflection TOFMS was used in the experiments, which was home-made and described in detail in the literature [23]. Gaseous analytes were directly introduced into the ionization source through a fused silica capillary 100 μm i.d. from sample bag, and the pressure inside of the ionization source was controlled by adjusting the length of the silica capillary. The operating parameters of the miniature TOFMS are listed in Table S2 (Supporting information) and all the mass spectra were accumulated for 50 s.
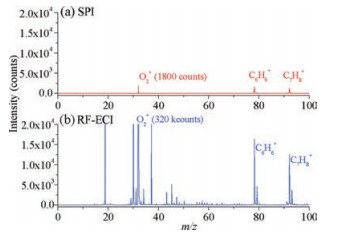
Benzene and toluene were used to explore the efficiency of RFECI. Sample preparation is shown in the S1 section in Supporting information. Mass spectra in SPI mode and RF-ECI mode for 34.8 mg/m3 benzene and 41.1 mg/m3 toluene are shown in Fig. 2. The characteristic peaks at both SPI and RF-ECI mode for benzene and toluene are C6H6+ (m/z 78) and C8H10+ (m/z 92) respectively. The C6H6+ and C8H10+ are all molecular ions, so the RF-ECI is also a soft ionization source. The ion intensities for benzene and toluene in SPI were only 226 counts and 172 counts, respectively. While signal intensities in RF-ECI were as high as 16462 counts and 12513 counts, so the signal intensities in RF-ECI were 72.8 times and 72.7 times greater than that obtained by SPI with the same VUV lamp. We can preliminarily conclude that the large amount of O2+ ions were acted as reagent ion and ionized the analyte molecular via charge transfer chemical reaction. The dominant peak in Fig. 2b comes from O2+ ions, its signal intensity is as high as 3.2 × 10⁵ counts, while its intensity was only 180 counts in SPI mode in Fig. 2a. The O2+ were generated by the PEI, and the photoelectrons emitted from the surface of the orifice electrode were accelerated in the gap of focusing electrode SE6 and orifice electrode by the DC field between V2 and V3. But, in RF-ECI mode, the applied RF voltage will further accelerate the photoelectron, and more O2+ ions were obtained.

|
Download:
|
| Fig. 2. Mass spectra in SPI mode (a) and RF-ECI mode (b) for 34.8 mg/m3 benzene and 41.1 mg/m3 toluene. The actual value was magnified 10 times in (a). | |
Chemical ionization is induced from the collision between the reagent ions and the analyte molecular, and the pressure inside the ionization source determines the density of the analyte molecular. Therefore, increasing the pressure of ionization source pressure can effectively improve the density of molecules and the probability of collision, thereby improve the sensitivity. Here, we optimized the pressure from 10 Pa to 115 Pa, and the sensitivity of C7H8+ increases rapidly from 10 Pa to 90 Pa and then declines. The intensity of O2+ increases quickly from 10 Pa to 50 Pa, and the growth rate slows down and gradually tends to saturation from 50 Pa to 90 Pa. With the increase of the pressure from 90 Pa to 115 Pa, the density of the neutral gaseous molecules increases further, and the increased collisions between the photoelectron and the neutral molecules result in energy loss for electrons. So, the signal intensity of O2+ declines from 90 Pa, and the decrease of the O2+ in chemical reaction leads to a signal decrease for toluene, the mass spectra of relationships between reactant ions and air pressure is shown in Fig. S1 (Supporting information). The mass spectra of relationships between reactant sample ions and air pressure is found in Fig. S2 (Supporting information). Therefore, the optimum operating pressure of the RF-ECI is chosen at 90 Pa.
We optimize the voltage of ionization source so as to optimize the RF-ECI. The pressure of the RF-ECI maintains at 90 Pa, and 41.1 mg/m3 of toluene was used to optimize the DC and RF voltages. The SE6 electrode and the orifice electrode were set at 35 V and 15 V DC voltage, respectively. The signal intensity of toluene is the highest when the V1 was set as 36 V, and when V1 increased to 44 V, the signal intensity declined dramatically. That is to say that the signal intensity decreases alone with the increase of the voltage difference between V1 and V2. The reason for this can be contribute to the chemical reaction efficiency of the reagent ions inside of the chemical ionization source. When the voltage of V1 is equal to 36 V, the voltage difference of 1 V between V1 and V2 generates a weak DC electric field, and the reagent ions O2+ moves slowly in the axial direction. The slower movement of O2+ and the more collisions cause higher ionization efficiency for chemical reaction (the relationship of signal intensity and voltage on repelling electrode is shown in Fig. S3 in Supporting information). Besides, we explore the relationship of signal intensity and RF amplitude (Fig. S4 in Supporting information), the signal intensities of toluene and chloroform both increase alone with the increasing of RF voltage, especially from 100 V. Considering the balance of the sensitivity and the power consumption of the miniature TOFMS, the voltage of the RF was selected as 344 Vp-p. The photoelectrons produced by VUV light from the orifice electrode are rapidly separated from the electrode surface under the voltage difference of V2 and V3. The electrons are accelerated by the radiofrequency electric field, and ionize the O2 molecular between the epelling electrode and the focusing electrode to produce O2+, the reagent ions O2+ moves slowly in the weak DC electric field. The role of the RF voltage in the RF-ECI can be summed up in two aspects: One is for the acceleration of the photoelectron, and the other is focusing the ions in the radical direction. The focusing effect will not discuss here, and we will discuss this issue specially in another paper.
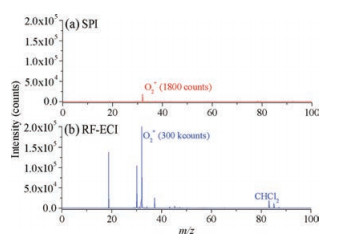
The RF-ECI can also be used to extend detection scope of SPI, which only can ionize compounds with ionization energy below 10.6 eV. Chloroform with concentration of 37.1 mg/m3 is selected and tested under SPI and RF-ECI conditions. Fig. 3a shows the mass spectrum of chloroform in SPI mode, the trace amount of chloroform cannot be detected since its ionization energy (11.37 eV) is higher than 10.6 eV. When the ionization source is switched to the RF-ECI mode, as shown in Fig. 3b, chloroform is ionized by O2+ and has a characteristic peak of CHCl2+ (m/z 83) and the signal intensity is as high as 10026 counts. It can be concluded that the RF-ECI can effectively broaden the range of detection scope by using high ionization energy reagent ions.

|
Download:
|
| Fig. 3. Mass spectra in SPI mode (a) and RF-ECI mode (b) for 37.1 mg/m3 chloroform. The actual value was magnified 10 times in (a). | |
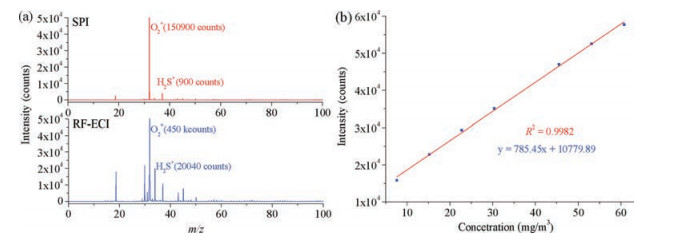
Linear dynamic range and limit-of-detection in RF-ECI modewere explored. Hydrogen sulfide with concentration of 285.71 mg/m3 in pure N2 (99.995%) were purchased from Dalian Special Gas Company (Dalian, China). For quantitative analysis, gaseous analytes of different concentrations were prepared using the gradual dilution method previously reported [24]. Fig. 4 shows the mass spectra in SPI mode and RF-ECI mode for 37.9 mg/m3 H2S and the linear calibration curves for hydrogen sulfide in the concentration range from 7.589 mg/m3 to 75.89 mg/m3 in RF-ECI mode. As shown in Fig. 4a, the signal intensity of H2S in SPI mode is only 9 counts, while it increases to 20040 counts in the RF-ECI mode, and totally enhanced 2226-folds comparing to the SPI mode. The reason is that the VUV lamp emits both 10.0 eV and 10.6 eV photons with a beam density ratio of 4:1. In SPI mode, only 10.6 eV of the photon can be used to ionize H2S (10.5 eV). While in RF-ECI mode, not only the 10.6 eV photon, butalsothe O2+ can directly ionize H2S, andthe reagent ion of O2+ is enough for the chemical reaction, so the sensitivity of H2S has been greatly improved in RF-ECI mode. Fig. 4b shows a linearity of up to 0.9982 for H2S in the range of 7.589 mg/m3 to 75.89 mg/m3, and the LOD of 0.0571 mg/m3 was calculated based on S/N = 3.

|
Download:
|
| Fig. 4. (a) Mass spectra in SPI mode and RF-ECI mode for 37.9 mg/m3 hydrogen sulfide. The actual value was magnified by 100 times. (b) Linear calibration curve for H2S in the concentration range from 7.589 mg/m3 to 75.89 mg/m3 in RF-ECI mode. | |
In summary, a new type of RF-ECI source for miniature TOFMS is developed. The addition of the radiofrequency electric field inside the ionization region helped to enhance the amount of O2+ reagent ions and induce charge transfer reaction chemical ionization. The RF-ECI not only broadens the detection range of the analyte, but also dramatically improves the sensitivity of the miniature TOFMS. Compared with the SPI ionization, the sensitivity enhanced 2 to 3 orders of magnitude for benzene, hydrogen sulfide and other compounds in RF-ECI mode, and detection limit of 0.0571 mg/m3 for H2S was obtained within 50 s analysis time. The combination of RF-ECI and miniature TOFMS has a broad application prospect in process analysis and environmental pollutant monitoring.
AcknowledgmentThis work was financially supported by the National Natural Science Foundation of China (Nos. 21375129 and 21675155).
Appendix A. Supplementary dataSupplementary data associated with this article can be found, in the online version, at https://doi.org/10.1016/j.cclet.2017.11.021.
| [1] |
S.D. Richardson, Anal. Chem. 80 (2008) 4373-4402. DOI:10.1021/ac800660d |
| [2] |
Z. Ouyang, G. Wu, Y. Song, et al., Anal. Chem. 76 (2004) 4595-4605. DOI:10.1021/ac049420n |
| [3] |
L. Abranko, J.F. Garcia-Reyes, A. Molina-Diaz, J. Mass Spectrom. 46 (2011) 478-488. DOI:10.1002/jms.1914 |
| [4] |
F. Muhlberger, J. Wieser, A. Ulrich, et al., Anal. Chem. 74 (2002) 3790-3801. DOI:10.1021/ac0200825 |
| [5] |
C. Bure, G. Le Falher, C. Lange, et al., J. Mass Spectrom. 39 (2004) 817-823. DOI:10.1002/(ISSN)1096-9888 |
| [6] |
K. Hou, F. Li, W. Chen, et al., Analyst 138 (2013) 5826-5831. DOI:10.1039/c3an00659j |
| [7] |
W. Lindinger, A. Hansel, A. Jordan, Chem. Soc. Rev. 27 (1998) 347-354. DOI:10.1039/a827347z |
| [8] |
R.S. Blake, P.S. Monks, A.M. Ellis, Chem. Rev. 109 (2009) 861-896. DOI:10.1021/cr800364q |
| [9] |
M. Norman, A. Hansel, A. Wisthaler, Int. J. Mass Spectrom. 265 (2007) 382-387. DOI:10.1016/j.ijms.2007.06.010 |
| [10] |
H. Chen, Y. Sun, A. Wortmann, et al., Anal. Chem. 79 (2007) 1447-1455. DOI:10.1021/ac061843x |
| [11] |
P. Nemes, I. Marginean, A. Vertes, Anal. Chem. 79 (2007) 3105-3116. DOI:10.1021/ac062382i |
| [12] |
M.J. Pavlovich, E.E. Dunn, A.B. Hall, Mass Spectrom. 30 (2016) 1123-1130. |
| [13] |
L. Hanley, R. Zimmermann, Anal. Chem. 81 (2009) 4174-4182. DOI:10.1021/ac8013675 |
| [14] |
F. Muhlberger, T. Streibel, J. Wieser, et al., Anal. Chem. 77 (2005) 7408-7414. DOI:10.1021/ac051194+ |
| [15] |
W.Q. Sun, J.N. Shu, P. Zhang, et al., Atmos. Meas. Technol. 8 (2015) 4637-4643. DOI:10.5194/amt-8-4637-2015 |
| [16] |
Z. Yang, T. Zhang, Y. Pan, et al., J. Am. Soc. Mass Spectrom. 20 (2009) 430-434. DOI:10.1016/j.jasms.2008.10.026 |
| [17] |
Q. Wu, L. Hua, K. Hou, et al., Int. J. Mass Spectrom. 295 (2010) 60-64. DOI:10.1016/j.ijms.2010.06.034 |
| [18] |
Q. Wu, L. Fua, K. Hou, et al., Anal. Chem. 83 (2011) 8992-8998. DOI:10.1021/ac201791n |
| [19] |
L. Hua, Q. Wu, K. Hou, et al., Anal. Chem. 83 (2011) 5309-5316. DOI:10.1021/ac200742r |
| [20] |
P. Chen, K. Hou, L. Hua, et al., Anal. Chem. 86 (2014) 1332-1336. DOI:10.1021/ac403132k |
| [21] |
J. Jiang, Y. Wang, K. Hou, et al., Anal. Chem. 88 (2016) 5028-5032. DOI:10.1021/acs.analchem.6b00428 |
| [22] |
W. Gao, G. Tan, Y. Hong, et al., Int. J. Mass Spectrom. 334 (2013) 8-12. DOI:10.1016/j.ijms.2012.09.003 |
| [23] |
K. Hou, J. Li, T. Qu, et al., Rapid Commun. Mass Spectrom. 30 (2016) 38-43. DOI:10.1002/rcm.7624 |
| [24] |
K. Hou, J. Wang, H. Li, Rapid Commun. Mass Spectrom. 21 (2007) 3554-3560. DOI:10.1002/(ISSN)1097-0231 |