 2018, Vol. 29


b Research Institute of Tsinghua University in Shenzhen, Shenzhen 518057, China
Transitional metal dichalcogenides with layered structure, such as tungsten sulfide (WS2) and molybdenum disulfide (MoS2), have attracted much attention due to their unique chemical and physical properties. At the same time, MoS2 has received much attention in many fields, including hydrogen storage, catalysis, solid lubricants and intercalator [1]. It has a similar structure to graphite and is made up of three atomic layers: Mo layer is sandwiched between the two S layers and the structure maintained by interacting with the van der Waals force [2]. Single layer MoS2 can provide maximum specific surface area for electrochemical energy storage and reduce ion diffusion resistance. Layered MoS2 nanosheets assembled from single or fewer layers of MoS2 have good crystallographic orientation. There is no obvious volumetric change during ion intercalation. The cycling stability of the electrode material is guaranteed, showing enhanced electrochemical properties [3, 4]. Recently, the main reason why electrode materials of supercapacitors are focused on MoS2 is that MoS2 has higher ionic conductivity [5] (than that of oxide) and higher theoretical capacity (than that of graphite) [6]. For example, Lohz et al. [7] reported that MoS2 provided a larger surface area in charge storage for its laminate structure. The results show that MoS2 exhibited a higher electrochemical performance used as electrode material (using carbon nanotubes as electrode material). Chen [8] reported MoS2/PANI composite as supercapacitor electrode and the high specific capacitor as well as the good cycle performance was achieved. Wang [9] synthesized NiMoO4/3DG composite as a lithium ion battery electrode material to show excellent cyclic stability. Ouyang [10] loaded MoS2 onto vertical 3DG by hydrothermal method which have used as a lithium ion battery electrode material to show excellent enhanced electrochemical performance. By comparing with the double layer capacitor, it is observed that the Faraday capacitance caused by the diffusion of ions in the electrolyte enhanced the charge storage capacity at the low scan rate.
Because of the large surface area, good stability, and high electrical conductivity [11], graphene (G) is used in supercapacitor electrodes. MnO2/G exhibited high specific capacitance of 375 F/g at current density of 1 A/g and good cycle stability (93% capacitance retention) after 500 cycles at a scan rate of 200 mV/s [12]. MoS2/G delivered 618 F/g at 1 A/g and 78% of capacitance was retained after 2000 cycles [13, 14]. The specific capacitance of MoS2 is still limited in energy storage applications [15]. For supercapacitor, the transmission of ions and electrons in the electrode material is the key factor affecting its electrochemical performances. The graphene with the crosslinked three-dimensional network structure can shorten the ion transmission distance, accelerate the electron transfer, so as to improve the electrochemical performance of electrode materials efficiently [16]. These defects can be overcome by a combination of 3DG and MoS2. Wu et al. [17] recently discovered the excellent electrochemical performance of MoS2/3DG composites applied to electrochemical sensors. The MoS2/3DG nanocomposite has significant enhancement of electrochemical performance and achieves high energy electrochemical supercapacitors for density characterization applications.
In this paper, few layers MoS2 nanosheets were prepared by liquid phase stripping method. MoS2/3DG composite was prepared by hydrothermal method using 3DG as the template of supported MoS2. MoS2/3DG could be used as electrode material of supercapacitor in order to obtain enhanced electrochemical performance and better electrochemical stability, and then the effect of MoS2/3DG composites with different concentration of MoS2 on electrochemical performance was discussed.
In a typical synthesis of graphene, nickel foam was used as the scaffold template for the CVD (chemical vapor deposition) growth of graphene. The nickel foam was heated to 1000 ℃ in the horizontal tube furnace within 125 min under Ar (500 sccm) and H2 (200 sccm) and the sample was heated preservation 20 min to remove the oxide layer on the matrix surface. Whereafter the sample was adjusted in gas flow rate of 30 sccm for H2 and 80 sccm for Ar, respectively, holding 1000 ℃ for 10 min. Subsequently, the sample was adjusted in gas flow rate of 30 sccm for H2, 80 sccm for Ar and 7 sccm for methane, respectively. After 10 min of reactiongas mixture flow, the sample was cooled to room temperature quickly. And then 0.6 g, 0.8 g, 1 g, 1.2 g and 1.4 g bulk MoS2 were dispersed in 100 mL of N-methyl pyrrolidone (NMP) respectively, then ultrasonicated in 20 ℃ water for 12 h with the power output of 80 W and the frequency of 40 kHz. After that, the mixture was transfered to the centrifuge tube and centrifuged at 5000 rpm for 0.5 h. 1 mL of the resulting MoS2 was dispersed in 50 mL of ultrapure water. The solution was transferred into a 50 mL Teflonlined stainless steel autoclave, and then the prepared 3DG was immersed in the dispersion at 150 ℃ for 24 h. The 3DG was made with vacuum pumping to 10 mTorr and holding at 80 ℃ for 1 h to remove NMP.
The microstructure of the sample was observed by field emission scanning electron microscopy (FESEM, Model: JSM-7600F, JEOL, Ltd., Tokyo, Japan). The valence and bond formation of sample was obtained by X ray photoelectron spectrometer (XPS, VG, ESCALAB250, ThermoElectron, American). The Raman spectrometer (Model: CRM200, WITEC, Germany) in the 514 nm emission wavelength was used.
In the preparation of coin cell supercapacitor, the negative electrode was prepared by mixed 80 wt% active carbon, 10 wt% sptype carbon black and 10 wt% polytetrafluoroethylene (PTFE) dissolved in water to form a slurry, then it pasted on the carbon cloth and heated at 80 ℃ for 12 h. Then the negative material was evenly coated on the nickel foam, and dried in the vacuum oven. Finally, 1 cm × 1 cm positive material, negative electrode material, and the PP/PE aqueous porous diaphragm were assembled in the 2032 button cell shell. MoS2/3DG with 1 cm2 area was used as working electrode, platinum plate was used as counter electrode, Hg/HgO electrode was used as reference electrode, and 3 mol/L KOH solution was used as electrolyte. Cyclic voltammetry (CV), galvanostatic current charge/discharge (GCD) and the alternatingcurrent (AC) impedance test (EIS) tests were performed on the PMC2000 electrochemical workstation (ParStat, U.S.A.).
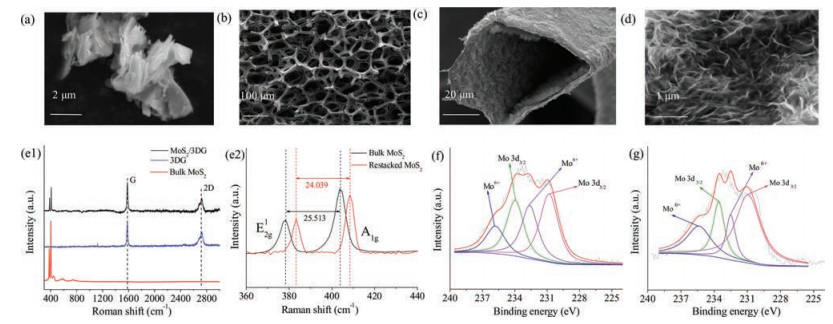
Fig. 1a shows scanning electron microscopy (SEM) diagram for bulk MoS2. It can be observed that the MoS2 nanosheets are agglomerated together in a disordered orientation. Fig. 1b shows SEM diagram for 3DG prepared by CVD. 3DG owns cross linked and integrated net structure. The 3DG sheets are contacted directly without obvious wrinkle and well separated without the occurrence of collapse. The pore size of 3DG is about 200 μm, and the skeleton width of 3DG is about 50 μm, which agree with those of the matrix. In this paper, a large area, high quality and high strength, layered 3DG is prepared by CVD method. Fig. 1c is a SEM diagram of MoS2/3DG obtained by hydrothermal method. On the surface of the substrate there is a layer of folded film material, which is prepared by CVD method. The existence of folds is to ensure that the structure of the 3DG remains thermodynamically stable [14]. MoS2 nanosheets crosslinked on 3DG are also observed. It can be seen clearly that vertically cross linked MoS2 nanosheets adhere on the inner and outer surface of 3DG. The enlarged details of the stacked MoS2 nanosheets are shown in Fig. 1d. The structure extends the contact area of electrolyte, thus reducing the transmission resistance of active ions. It is beneficial to the transmission of electrolyte ions during electrochemical reaction. At the same time, the MoS2/3DG interconnected conductive network not only promotes efficient charge transport and electrolyte diffusion, but also effectively prevents volume expansion/contraction and aggregation of active materials during charging and discharging.

|
Download:
|
| Fig. 1. (a-d) FESEM image of bulk MoS2(a), 3DG (b) and MoS2/3DG (c); (d) is the enlarged details of (c). (e1, e2) The Raman spectra of bulk MoS2, 3DG and MoS2/3DG (e1), characteristic peaks plots of Raman spectra for MoS2 nanosheets and bulk MoS2 and Raman spectra of the E2g1 and A1g characteristic peaks of layered MoS2 and bulk MoS2 (e2). (f, g) The XPS spectrum of MoS2/3DG before (f) and after (g) electrochemical tests. | |
Raman spectrum can estimate the atomic vibration information, which can be used as an effective method to detect the number of layers of two-dimensional material [18-21]. Fig. 1e1 is Raman spectrum of MoS2/3DG, 3DG and bulk MoS2, respectively. The G and 2D characteristic peaks of graphene at 1580 cm-1 and 2720 cm-1, respectively, can be found in the Raman spectra of 3DG and MoS2/3DG. The D peak at 1350 cm-1 originated from double resonance process is usually used to characterize the degree of defect of graphene. The strongly suppressed D band indicates less defects and high quality of graphene. The ratio of the integrated intensities of D peak to G peak(I2D/IG)is usually used to estimate the layernumberof graphene. The value of I2D/IG is 1.48 and the full width at half maximum of the 2D band is 45.58 cm-1 which reflect the few layered graphene.Fig. 1e2 is Raman spectra of the E2g1 and A1g characteristic peaks of layered MoS2 and bulk MoS2. It can be observed that the peaks of E2g1 and A1g are 380 cm-1 and 405 cm-1 in the layered MoS2 and bulk MoS2, respectively. At the same time, the characteristic peaks of layered MoS2 undergo a slight blue shift compared with those of the bulk MoS2, and the distance between the characteristic peaks decreases from 25.513 cm-1 to 24.039 cm-1. The vibration of Mo atoms and S atoms is affected by the number of MoS2 layers due to the MoS2 interlayer coupling. Therefore, the number of layers of MoS2 nanosheets can be estimated by the distance between two characteristic peaks. The distances between the E2g1 and A1g characteristic peaks of MoS2 nanosheets is 24.039 cm-1 and the number of layers of MoS2 nanosheets is between 3 and 4 layers [22-25]. It can be made more possible to composite with 3DG, and enhance the electrochemical performance.
XPS spectrum is used to investigate the change of valence and bond formation of MoS2 load on the 3DG. The test results are shown in Figs. 1f and g. The graph is the XPS spectrum of the Mo element from 3d region in MoS2. The spectrogram can be divided into four peaks. The symmetric double peaks of 230.1eV and 233.3eV correspond to characteristic peaks of Mo 3d5/2 and Mo 3d3/2 regions of Mo elements in MoS2; the double peaks of 230.1eV and 233.3eV can be attributed to +6 valence of Mo elements which at the edge of MoS2 nanosheets are bonded unsaturated. XPS test results show that unsaturated bonds exist in MoS2 nanosheets which are loaded on 3DG surface, and it has a high intensity of peaks. The content of unsaturated bond is higher, which is more conductive to the adsorption of ions, leading to a certain pseudocapacitance characteristics. It can be obtained that the intensity of Mo6+ has increased. During the electrochemistry testing, the bond formed by the unsaturated bonding atoms which are abundant at the edge of nanosheets and electrolyte ions cause the valence variation of the Mo atoms in the sample.
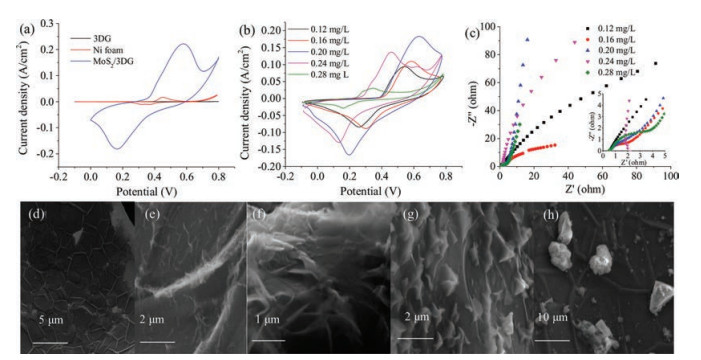
It is very interesting that different concentration of samples exhibit different properties. The electrochemical performances of MoS2/3DG as supercapacitor electrode were evaluated by CV firstly. From Fig. 2a, compared with Ni foam and 3DG, the composite shows superior electrical performance.And thepeaks of composite are located near by 0.5 V, which confirmed to the MoS2 peaks. When the concentrations of MoS2 are 0.12 mg/L, 0.16 mg/L, 0.20 mg/L, 0.24 mg/L, 0.28 mg/L, the specific capacitance values of electrodes are 1367.49 mF/cm2, 1519.5 mF/cm2, 1712.57 mF/cm2, 1597.11 mF/cm2, and 804.81 mF/cm2 at scan rate of 50 mA/cm2, respectively. A pair of obvious redox peak can be observed by the diagram, indicating the pseudocapacitance characteristics of the sample. The CV curves of MoS2 deviate fromthe standard rectangle and appear to be reductionpeaks, which have also been discovered by some other researchers [26, 27]. The remained shapes obtained by removing of redox peaks in the CV curves of different concentration samples are similar to rectangles, which indicated that the capacitance of sample is obtained by the cooperation of the electrochemical double-layer capacitance behavior and the faradic reaction [28]. At the low concentration, the shape of redox peaks are flat. With the increase of concentration, the intensities of redox peaks in CV curves increase and some inconspicuous redox peaks appear, which show that the contribution of pseudo electric to the capacitance of sample. The peak current in the CV curve decreases as the concentration of MoS2 increasing, which can be attributed to the reduction of the conductivity of the sample. From Figs. 2d-g, we can easily obtain the MoS2 nanosheets agglomerated and lead to reducing of the transmission efficiency of electrons and ions. When the concentration of MoS2 exceeds 0.20 mg/L, part of MoS2 agglomerated. The peak intensity decreases, but the slope of peaks still can be observed which is thought to be caused by unsaturated bonds. After further increasing concentration of MoS2, the agglomeration is further increased. It can be seen that the capacity of the capacitor decreases sharply, which is contribute to the decrease of unsaturated bonds. As can be seen from the diagram, the electrochemical properties of the composites are best when the concentration is 0.2 mg/L. The redox peaks in the CV curve are caused by changes in the valence states of the elements in the sample. From Fig. 1c, MoS2 nanosheets are vertically loaded on the 3DG surface, and there are more unsaturated atoms on the edges of nanosheets. In the process of testing, the electrolyte ions bond with unsaturated atoms, which results in the change of valence states of Mo atoms in the sample. Thus the samples show the pseudocapacitance characteristics. The transmission distance is shorten from surface area of electrolyte ion is the main source of planar capacitance.

|
Download:
|
| Fig. 2. (a) CV curves of Ni foam, 3DG and MoS2/3DG at scan rate of 50mA/cm2. (b) CV curves of MoS2/3DG at different concentration. (c) The Nyquist plots of MoS2/3DG at different concentration. The inset is the high-frequency region. (d-h) FESEM images of MoS2/3DG at different concentrations: 0.12 mg/L, 0.16 mg/L, 0.20 mg/L, 0.24 mg/L and 0.28 mg/L, respectively. | |
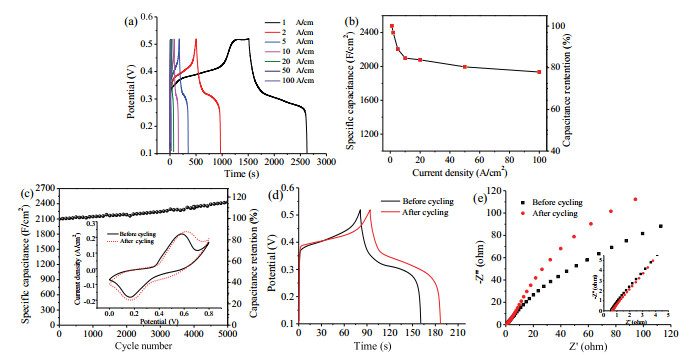
For the further discussing of samples electronic performance, the results of cyclic voltammetry curves and GCD curves of samples obtained from different concentrations of MoS2 shows that MoS2 (0.20 mg/L)/3DG has the best capacitance performance, so it is further tested by other electrochemical methods. The GCD curves of MoS2 (0.20 mg/L)/3DG at different current densities are shown in Fig. 3a. According to the test results, the rate performance curve of specific capacitance varies with current densities is shown in Fig. 3b. The charge/discharge curve shows the standard pseudocapacitor shape and has obvious charging and discharging platforms. It is considered that the contribution of pseudocapacitance in capacitance performance of MoS2 (0.20 mg/L)/3DG is much more than that of double layer capacitance [26]. In the curve of GCD, the voltage drop (IR drop) is small, which indicate the better conductivity of electrode materials. The excellent electrical conductivity of electrode materials can be attributed to the introduction of 3DG. And the specific capacitances calculated based on the MoS2/3DG area at different current densities are also listed in Fig. 3b. As shown in Fig. 3b, when the current density increased from 1 A/cm2 to 100 A/cm2, the specific capacitance value was retained 78.9%, which revealed the excellent rate capability. The remarkable specific capacitance and rate capability can be attributed to: (1) The vertical cross linking of MoS2 nanosheets increases the contact area with the electrolyte; (2) The vertical load of MoS2 nanosheets provides more unsaturated atoms, which increases the transmission efficiency of electrons and ions; (3) 3DG is used as matrix of electrode material, and the conductivity of electrode is improved. To investigate the cycling stability, MoS2/3DG is measured by continued GCD measurement over 5000 cycles at the current density of 20 mA/cm2. The circling stability of prepared MoS2/3DG electrode is shown in Fig. 3c. As can be seen from the diagram, the specific capacitance of MoS2 (0.20 mg/L)/3DG increases slowly with the increasing of the cycle number. At the end of the 5000 cycles, the specific capacitance is 116.83% compared with the first circle. The good cycling stability of MoS2 (0.20 mg/L)/3DG is revealed. The enhancement of capacitance and cycling stability is due to the MoS2/3DG interconnection network, which not only promotes efficient charge transport and electrolyte diffusion, but also prevents volume expansion/contraction and aggregation of active materials during charging and discharging process [29]. In order to investigate the reasons for increasing of MoS2 (0.20 mg/L)/3DG specific capacitance, Fig. 3d presents the CV curves before and after 5000 cycles at 100 mV/s. It can be observed from Fig. 3d that the peak position of the reduction peak has not changed after 5000 cycles of GCD cycling test, and its intensity has been slightly reduced. At the same time, the position of the oxidation peaks shifts, but the intensity increases slightly. And the current response of the CV curve at 0.1 V is enhanced. No significant voltage drop is observed in Figs. 3c and d, indicating that the conductivity of electrode materials has been improved due to the presence of graphene. In the process of charging and discharging, OH- is adsorpted and desorpted, and the metal cations are adsorbed on the surface [30] and bonded with MoS2 in the form of chemical bonds to change the valence states of the Mo elements. Therefore, as the concentration of MoS2 increases, the number of bonded unsaturated atoms increases, which results in the more pronounced redox peaks in the CV. In the process of chemical bonding (adsorption) and chemical bond breaking (desorption) of electrolyte ions with MoS2, the rearrangement of MoS2 atoms occur, resulting in the crystal transition from 2H to 1T in part of MoS2 [10]. The conductivity of the MoS2 nanosheets is improved, leading to CV curves changes of the MoS2 (0.20 mg/L)/3DG before and after the cycles and the advancement of the specific capacitance.

|
Download:
|
| Fig. 3. (a) GCD curves of MoS2 (0.20 mg/L)/3DG at various currents. (b) Specific capacitances and the corresponding capacitance retentions. MoS2 (0.20 mg/L)/3DG calculated from GCD test at various currents. (c) Cycling performance of MoS2/3DG at current density of 10 mA/cm2. The insets are CV curves of MoS2 (0.20 mg/L)/3DG tested before and after 5000 cycles. (d) The GCD curves of MoS2 (0.20 mg/L)/3DG tested before and after 5000 cycles at 100 mV/s. (e) The Nyquist plots of MoS2 (0.20 mg/L)/3DG before and after 5, 000 cycles. The inset is the high-frequency region. | |
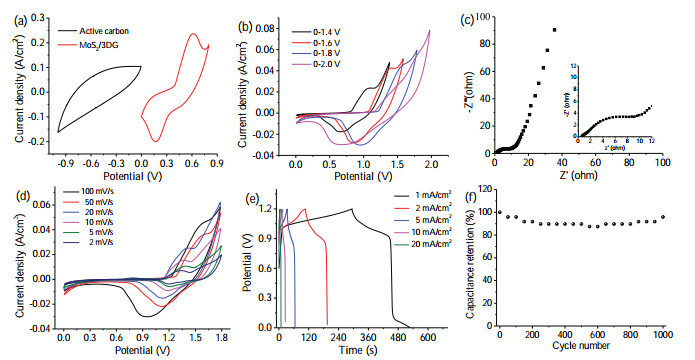
In Fig. 4a, we can easily obtain the size of active carbon is close to MoS2 (0.20 mg/L)/3DG in CV curves. The negative electrode and the counter electrode have been certain. From Fig. 4b, the voltage range is screened after assembly, when the voltage reach 2.0 V, the polarization of the CV curve occurs, so the voltage range of the device is 0-1.8 V. From Fig. 4d, the shape of CV curve shows pseudocapacitance character at different scan rates, and the shape varies little with the scan rate, revealing the excellent rate capability. It has obvious redox peaks, which indicate the occurrence of redox electrochemical reaction. The electrochemical reaction Faraday can be attributed to the change of valence states of Mo elements in MoS2 during charging and discharging, which is consistent with the test results of MoS2/3DG in three electrode system. The GCD curves of the supercapacitor assemblies under different current densities are shown in Fig. 4e, where the current density is based on MoS2/3DG and activated carbon mass calibration. According to the GCD calculation, the specific capacitance can be obtained. When the current densities are 1 A/cm2, 2 A/cm2, 5 A/cm2, 10 A/cm2, 20 A/cm2 and 50 A/cm2, the specific capacitance values of the devices are 366.63 mF/cm2, 175.55 mF/cm2, 103.98 mF/cm2, 56.21 mF/cm2, 21.36 mF/cm2 and 11.23 mF/cm2, respectively. Compared with the electrode material, the remained capacitance value is close to 16.8%. Due to less KOH solution in the assembly system, the transport of ions and electrons in the electrode materials is slowly and hardly [31].

|
Download:
|
| Fig. 4. (a) Individual CV curves of active carbon and MoS2 (0.20 mg/L)/3DG at 100 mV/s. (b) CV curves of fabricated asymmetric coin cell supercapacitor at different voltage windows. (c) The Nyquist plots of fabricated asymmetric coin cell supercapacitor. The inset is the high-frequency region. (d) CV curves of fabricated asymmetric coin cell supercapacitor at different scan rates. (e) GCD curves of fabricated asymmetric coin cell supercapacitor at various currents. (f) Cycling performance of fabricated asymmetric coin cell supercapacitor at current density of 10 mA. | |
Based on GCD test results, the power density and the energy density can be obtained according to formula E = (C·ΔV2)/2 (1) and P = E/t (2). Where, E is the energy density, C is the specific capacitance, ΔV is charging and discharging voltage window, P is power density, t is the discharge time. The energy density and power density of supercapacitors are calculated. After calculation, when supercapacitor devices assembled in power densities are 4000 W/m2, 7990.7 W/m2, 12810 W/m2, 40010.5 W/m2 and 80010.6 W/m2, the energy densities are 130.34 Wh/m2, 36.96 Wh/m2, 20.01 Wh/m2, 7.58 Wh/m2 and 4.03 Wh/m2 respectively. Through the LAND battery test system, the voltage range is 0-1.6 V, at the current density of 2 A/cm2, the GCD method is used. Fig. 4c shows Nyquist plots for the MoS2/3DG electrodes, indicating the ability of high-rate discharge performance in coin cell supercapacitor. As shown in Fig. 4f, with the number of cycles increasing, the specific capacitance of the device is almost unchanged. Compared with the first circle, the remained capacitance value is still close to 96.8% after 1000 cycles. It shows that the assembled supercapacitor device has good cycling stability and an excellent application prospect.
In summary, the MoS2 nanosheets are obtained by stripping different concentrations of MoS2, and then the MoS2 nanosheets loaded onto 3DG by hydrothermal method (MoS2/3DG). The vertical cross-linked structure on the surface of 3DG formed by MoS2 nanosheets. When the MoS2 concentration is 0.20 mg/L, the MoS2 nanosheets are vertically loaded onto the inner and outer surfaces of 3DG, the composite (MoS2 (0.20 mg/L)/3DG) shows the best capacitance performance (specific capacitance reached 2182.33 mF/cm2). The specific capacitance of the MoS2/3DG is maintained by 116.83% (2549.62 mF/cm2) after 5000 cycles. When the current density increases 100 times (1-100 mA/cm2), the specific capacitance remains 78.9% (2549.62-2011.65 mF/cm2). Meanwhile, a high energy density (130.34 Wh/m2) is obtained after assembling the device. The considerable electrochemical properties of MoS2/3DG are attributed to the following: The vertical load of MoS2 nanosheets increases the contact area with the electrolyte; It also provides more unsaturated bonds, increasing the transmission efficiency of electrons and ions; 3DG is used as the matrix material of electrode material to improve the conductivity of electrode, and its three-dimensional structure further expands the specific surface area of electrode material and shortens the transmission distance of electrolyte ion.
AcknowledgmentsThis work is supported by the National Natural Science Foundation of China (Nos. 51572184, 51372160) and the Shenzhen Science and Technology Foundation (No. JCYJ201419122040621).
| [1] |
C. Manish, H.S. Shin, G. Eda, Nat. Chem. 5 (2013) 263-275. DOI:10.1038/nchem.1589 |
| [2] |
C. Liu, Z. Yu, D. Neff, et al., Nano Lett. 10 (2010) 4863-4868. DOI:10.1021/nl102661q |
| [3] |
K.Y. Tao, P.Y. Li, L.T. Kang, et al., J. Power Sources 293 (2015) 23-32. DOI:10.1016/j.jpowsour.2015.05.004 |
| [4] |
C.P. Yu, Y. Wang, J.F. Zhang, et al., J. Power Sources 364 (2017) 400-409. DOI:10.1016/j.jpowsour.2017.08.069 |
| [5] |
M. Kaempgen, C.K. Chan, J. Ma, et al., Nano Lett. 9 (2009) 1872-1876. DOI:10.1021/nl8038579 |
| [6] |
Z. Tian, H.L. Dou, B. Zhang, et al., Electrochim. Acta 237 (2017) 109-118. DOI:10.1016/j.electacta.2017.03.207 |
| [7] |
K. Lohz, S. Smith, X. Huff, et al., Nano Lett. 12 (2016) 139-146. |
| [8] |
H.Y. Chen, J. Wang, L. Meng, et al., Chin. Chem. Lett. 2 (2016) 231-234. |
| [9] |
B. Wang, S. Li, X. Wu, et al., J. Mater. Chem. A 3 (2015) 13691-13698. DOI:10.1039/C5TA02795K |
| [10] |
B. Ouyang, Y. Wag, Z. Zhang, et al., Electrochim. Acta 194 (2016) 151-160. DOI:10.1016/j.electacta.2016.02.120 |
| [11] |
J.Y. Cao, Y.M. Wang, Y. Zhou, et al., J. Electroanal. Chem. 689 (2013) 201-206. DOI:10.1016/j.jelechem.2012.10.024 |
| [12] |
B. Xu, S.F. Yue, Z.Y. Sui, et al., Energy Environ. Sci. 4 (2011) 2826-2830. DOI:10.1039/c1ee01198g |
| [13] |
Y.K. Zhang, J.L. Li, F.Y. Kang, et al., Int. J. Hydrogen Energy 37 (2012) 860-866. DOI:10.1016/j.ijhydene.2011.04.034 |
| [14] |
T. Zhao, H. Jiang, J. Ma, et al., J. Power Sources 196 (2011) 860-864. DOI:10.1016/j.jpowsour.2010.06.042 |
| [15] |
C.C. Liu, X.J. Yan, F. Hu, et al., Adv. Mater. 30 (2018) 705-713. |
| [16] |
Y. Zhang, H. Feng, X.B. Wu, et al., Int. J. Hydrogen Energy 34 (2009) 4889-4899. DOI:10.1016/j.ijhydene.2009.04.005 |
| [17] |
L. Fei, Y. Xu, X.F. Wu, et al., Nanoscale 6 (2014) 3664-3669. DOI:10.1039/C3NR05815H |
| [18] |
J. Wang, J. Liu, D. Chao, et al., Adv. Mater. 26 (2014) 7162-7169. DOI:10.1002/adma.v26.42 |
| [19] |
H.F. Li, X.W. Yang, X.M. Wang, et al., Nanoscale 8 (2016) 2395-2402. DOI:10.1039/C5NR06954H |
| [20] |
C. Sha, B. Lu, H. Mao, et al., Carbon 99 (2016) 26-34. DOI:10.1016/j.carbon.2015.11.066 |
| [21] |
X.F. Wu, Z.P. Zhou, W.M. Zhou, et al., Appl. Phys. Lett. 100 (2012) 193115-193118. DOI:10.1063/1.4718019 |
| [22] |
S.J. Ding, J.S. Chen, X.W. Lou, et al., Chem. Eur. J. 17 (2011) 13142-13145. DOI:10.1002/chem.201102480 |
| [23] |
B.H. Xie, C. Yang, Z.X. Zhang, ACS. Nano 9 (2015) 5636-5645. DOI:10.1021/acsnano.5b00899 |
| [24] |
R. Zhou, C.J. Han, X.M. Wang, J. Power Sources 352 (2017) 99-110. DOI:10.1016/j.jpowsour.2017.03.134 |
| [25] |
R. Kappera, D. Voiry, S.E. Yalcin, et al., APL Mater. 2 (2014) 492-516. |
| [26] |
K. Pandey, P. Yadav, I. Mukhopadhyay, RSC Adv. 5 (2015) 57943-57949. DOI:10.1039/C5RA09282E |
| [27] |
X.M. Li, W.Z. Wang, L. Zhang, et al., Catal Commun. 70 (2015) 53-57. DOI:10.1016/j.catcom.2015.07.024 |
| [28] |
N.T. McDevitt, J.S. Zabinski, M.S. Donley, Thin Solid Films 240 (1994) 76-81. DOI:10.1016/0040-6090(94)90698-X |
| [29] |
E.G. da Silveira Firmiano, A.C. Rabelo, C.J. Dalmaschio, et al., Adv. Energy Mater. 4 (2014) 130-138. |
| [30] |
Y.X. Chen, W.J. Ma, K.F. Cai, Electrochim. Acta 246 (2017) 615-624. DOI:10.1016/j.electacta.2017.06.102 |
| [31] |
N. Choudhary, M. Patel, N.B. Dahotre, et al., J. Mater. Chem. A 3 (2015) 24049-24054. DOI:10.1039/C5TA08095A |