 2018, Vol. 29


b University of Chinese Academy of Sciences, Beijing 100049, China
Glass transition is one of the most important and challenging research areas in chemical and physical science as well as for the commitment of designing and fabricating advanced materials with high performance [1-3]. Probing local molecular dynamics has long been a key and promising approach to the understanding of glass transition of polymers [2]. For the past decades, tremendous experimental efforts have been made and numerous methods have been applied to access the local segmental dynamics of polymers, related to the glass transition process [4-7]. It is until recently that single molecule fluorescence microscopy has been proved to be a new and effective technique to probe the dynamics of single molecules in different forms of states, such as in the liquid state [8], solid state [9], as well as at the interfaces [10]. Among these ultrasensitive techniques with excellent spatial resolution, single molecule defocus fluorescence imaging has been demonstrated extremely powerful and useful because it allows tracking rotational motion of multiple fluorescent molecules simultaneously [11]. This feature is especially helpful to the investigation of glassy state and the glass transition process, in which dynamical heterogeneity exists widely, being the major issue to the understanding of glass transition process itself [12, 13].
Having the capacity of recording fluorescence emission patterns of single molecules, the defocused imaging method measures explicitly the three-dimensional orientation of fluorescence emission dipoles by analyzing the diffraction patterns. In such an efficient way, the rotational motion of individual molecules can be monitored, allowing to track the rotation of multiple individual molecules separately and simultaneously. Taking the advantage of accessing the motion of individual molecules, ensemble averaging is avoided so that information on the dynamical heterogeneity can be investigated [14, 15].
One of the most interesting and important features related to polymers is their rich molecular architectures, such as linear, star, hyper-branched, grafted and cyclic, etc., which bring about rich and novel properties and functionalities [16-20]. The star-shaped polymer having a branch point at its core (the center) and multiple linear chains stretching from the core has been demonstrated to exhibit very special behaviors such as glass transition [21], physical aging [22] and wetting behavior [23]. These properties can be tuned by changing the number of arms and the degree of polymerization per arm. It is obvious that the most important location within the star polymer is the branch point, which has the strongest topological constraint due to joining of the multiple arms. With the presence of intrinsic intra-molecular topological feature, this branch point (the core) is believed to bare properties differing largely to other sites within the star-shaped macromolecules [24, 25]. Therefore, it is significant to investigate the local segmental dynamics inside a star polymer molecule with site-sensitive manner, especially for the branch point.
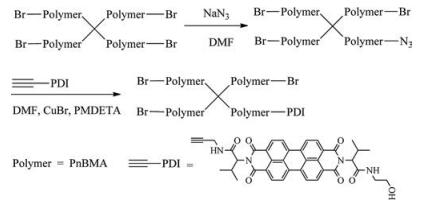
In order to access the local dynamics of the branch point of a star polymer by single molecule fluorescence microscopy, it is an essential to position the fluorophore right at the branch site. In this report, the protocol of positioning a bright and stable fluorescent molecule, perylene diimide (PDI) [26, 27], right at the branch point of a glassy polymer (poly n-butyl methacrylate, PnBMA) is demonstrated. Meanwhile, functionalized star PnBMA with PDI labeled at the arm's end is also prepared via azide/alkyne click reaction. The successful positioning of PDI at the branch point of star PnBMA enables the detection of the local dynamics right inside the core of the star polymer, which clearly demonstrates the difference in dynamics compared with other site, the arm's end as an example, of the identical polymer.
Four-arm star PnBMAs were synthesized by atom transfer radical polymerization [28-30]. The introduction of a single PDI molecule to branch point was accomplished by the polymerization from the functional PDI initiator with four ATRP initial points. Methodology for the synthesis of functional PDI-labeled initiator is shown in Scheme 1. Unless otherwise specified, all reagents were purchased from Aldrich.

|
Download:
|
| Scheme 1. The chemical protocol of the synthesis of PDI initiator that is used for ATRP of the four-arm star PnBMA. | |
3, 4, 9, 10-Perylenetetracarboxlic dianhydride (PDA, 400 mg, 1.02 mmol) and 2-amino-3-methylbutyric acid (250 mg, 2.14 mmol) were added to imidazole (Alfa Aesar, 10 g) and heated at 140 ℃ for 4 h with vigorous stirring. The color of the reaction mixture turned from bright red to dark red [19]. The residual dark red solid precipitation was washed with 1 mol/L hydrochloric acid in a glass filter to remove imidazole, and crude product 1 was obtained (Scheme 1). Afterwards, the product 1, triethylamine (TEA, 656 mg, 6.5 mmol), O-benzotriazole-N, N, N', N'-tetramethyluronium-hexafluorophosphate (HBTU, 796 mg, 2.1 mmol) and 2-amino-1, 3-propanediol (191 mg, 2.1 mmol) were dissolved in anhydrate dimethylformamide (DMF, J & K Chemicals, 10 mL) and the reaction mixture was stirred for 8 h at 20 ℃. After the solvent was evaporated and the residual dark red solid was washed vigorously with water, the dark red solid product 2 was obtained. TEA (505 mg, 5.0 mmol), 2-bromoisobutyloyl bromide (1150 mg, 5.0 mmol) and product 2 were dispersed in 200 mL of dichloromethane (DCM). The reaction mixture was stirred for 12 h at 0 ℃. After removal of the solvent, the reaction mixture was extracted with DCM and washed with water. The obtained dark red powder was passed through a silica gel column with an eluent of DCM/ methanol (20:1, v/v) and four arms PDI-labeled ATRP initiator 3 (462 mg, 0.35 mmol) was obtained. The net yield from PDA to initiator 3 was 34%. 1H NMR (300 MHz, CDCl3): δ 8.56-8.35 (m, 8H), 7.15 (d, 2H, J = 8 Hz), 5.39 (d, 2H, J = 10 Hz), 4.84 (m, 2H), 4.45-4.34 (m, 8H), 2.98-2.92 (m, 2H), 1.94 (d, 24H, J = 8 Hz), 1.28 (d, 6H, J = 6 Hz), 0.80 (d, 6H, J = 7 Hz). MS (ESI) m/z: calcd. for C56H60Br4N4O14 1332.73 [M+H]+, found 1333.0.
Star PnBMAs with the branch point fluorescence-labelled with PDI were synthesized by ATRP [25] with Cu catalyst. The reaction mixture of methacrylate monomer, initiator, N, N, N', N", N"-pentamethyldiethylenetriamine (PMDETA) and DMF was degassed by multiple freeze-pump-thaw cycles under reduced pressure. The reaction tube was then filled with pure nitrogen, and afterwards CuBr was quickly added into the frozen mixture. With the flask sealed, the mixture was evacuated and backfilled with nitrogen three times. The tube was heated to 60 ℃ in an oil bath. After the solution being stirred for 2-12 h, the polymerization was terminated by exposing the mixture to air and diluted with tetrahydrofuran (THF). The solution was passed through a column filled with basic alumina. The polymer was precipitated in a large amount of methanol/water mixture (3:1 in volume) for three times and dried in a vacuum at 20 ℃, producing the solid of PnBMA. The last operation was repeated multiple times to ensure the complete removal of free PDI molecules. The molar feed ratio was tuned for the purpose of molecular weight control. The degrees of polymerization were determined by 1H NMR through calculating the inversion ratio. Molecular weight distributions were determined by size exclusion chromatography (Waters) equipped with a differential refractive index recorder. The SEC instrument was calibrated with polystyrene standards, using THF as the eluent.
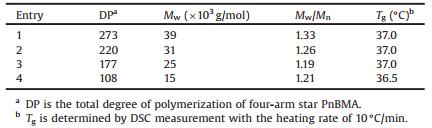
The ATRP processes using functionalized fluorescent initiator (Scheme 1) has been proved to be successful, showing the effectiveness of the initiator. Under suitable experimental condition, four-arm star PnBMAs with its branch point labelled with PDI fluorophore (denoted as Star-C) have been synthesized. The samples were found to have relatively narrow molecular weight distribution, as proved by SEC measurements (A typical SEC curve of PDI-labeled star PnBMA is provided in Fig. S1 in Supporting information). The parameters of all PnBMAs synthesized are summarized in Table 1. The samples have molecular weight ranging from 15 kg/mol to 39 kg/mol, with the Mw/Mn value less than 1.33. The values of glass transition temperature of all samples are about 37.0 ℃, as measured by differential scanning calorimetry (Q2000, TA Instruments) with a rate of temperature increase of 10 ℃/min.
|
|
Table 1 Parameters of four-arm star PnBMA with the branch point labelled with PDI fluorophore. |
Additionally, azide/alkyne click reaction [31] is used to attach fluorescent probe tothe arm's end of star-shaped PnBMA. Scheme 2 shows the methodology for fluorescence labeling at arm's end via the click-reaction.

|
Download:
|
| Scheme 2. Methodology for labelling PDI fluorophore at the arm's end of four-arm PnBMA via the azide/alkyne click-reaction. | |
First, blank star PnBMA with bromine end was prepared by ATRP with a blank four arms initiator (Scheme S1 in Supporting information). Sodium azide was added to the PnBMA DMF solution. After stirring for 24 h, the mixture was precipitated in methanol to form an azide PnBMA precursor. PMDETA, alkyne functional PDI and azide PnBMA precursor were dissolved in DMF. After multiple freeze-pump-thaw cycles, CuBr was added into the frozen mixture under the protection of nitrogen flow. Then, the reaction mixture was stirred vigorously for 12 h at 50 ℃. After that, DMF was removed under reduced pressure, and the solid mixture was redissolved in DCM and passed through a neutral alumina column to remove the catalyst. The DCM solution was concentrated and then precipitated into methanol. The solid product was obtained after vacuum drying.
The effectiveness of fluorescence labelling is proved by the results of diffusion coefficient measurements of the alkyne functional PDI and the star polymers at single molecular level, as detailed in Fig. S2 in Supporting information. The diffusion coefficient of alkyne functional PDI in dichloromethane measured by fluorescence correlation spectroscopy [32] is 926 μm2/s, and this value changed to 82 μm2/s after azide/alkyne coupling, a typical value of a macromolecule.
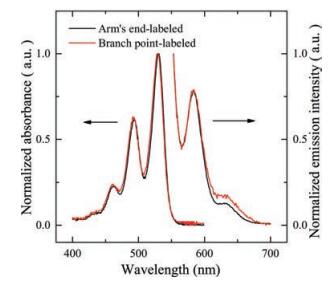
The fluorescence property of the polymer samples was characterized. Fig. 1 shows the UV-vis absorption spectra and fluorescence emission spectra recorded in a toluene solution of four-arm PnBMA with its branch point labelled with PDI. The spectra of four-arm star PnBMA with its arm's end labeled is also displayed for comparison. Just as the signature of PDI series fluorophore, there are two main absorption peaks located at 492 nm and 530 nm, respectively, while the emission maximum appears at 580 nm (under the excitation at 532 nm). The spectra of the two polymer samples are almost identical to each other, indicating that the introduction of PnBMA chain does not affect the fluorescent properties of PDI fluorophore.

|
Download:
|
| Fig. 1. UV-vis absorption and fluorescence emission spectra of the four-arm PnBMA with a PDI core. The spectra of PnBMA with the four-arm star PnBMA with PDI labeled at arm's end are also displayed for comparison. The spectra are normalized for the purpose of comparison. The excitation wavelength of the fluorescence emission is 532 nm. | |
PDI-labelled PnBMA were dissolved together with the blank (un-labelled) PnBMA. The concentration of the fluorescencelabelled polymer was about 10-10 mol/L. By spin-casting, sample films were fabricated on 0.17 mm-thick glass coverslips (Thermo Fischer) at a spin rate of 4000 rpm. Then, the sample films were annealed in vacuum at 100 ℃ for 12 h to remove possible residual solvent and stress. Film thickness was approximately 75.0 nm, measured by ellipsometry on films prepared on silicon wafers under identical condition.
Fluorescence defocus microscopic measurements were conducted on an Olympus IX-71 inverted microscope equipped with an Andor 887 EMCCD camera. Details of this setup were introduced previously [13]. Some modifications are made to achieve a better signal-to-noise ratio and stabilized temperature control. The excitation laser beam (532 nm output of a solid laser), which was adjusted to be circularly polarized firstly in order to guarantee equal excitation probability for fluorophores with all orientations, was introduced into the microscope and later to the sample through an oil-immersion objective lens (100 PlanApo, numerical aperture = 1.45). Total internal reflection configuration was established and fluorescence images were recorded at controlled timing (exposure time is 0.5 s). Optimal defocusing was set to about 0.6 mm to generate the well-defined diffraction patterns and with the optimum image contrast. The samples were housed inside a commercial hot-cold stage for inverted microscopes (HCS60, INSTEC). In order to guarantee uniform distribution of temperature, the temperature of the objective lens was also controlled by a commercial lens heater (Bioscience Tools). The setup of sample temperature control and calibration was shown in Fig. S3 (Supporting information). After calibration, the temperature of the sample was well stabilized with a fluctuation less than 0.5 ℃. The temperature value adopted is by measurement at the right position of the sample.
The absorption maximum at 530 nm of the PDI fluorophore positioned at the branch point of four-arm star PnBMA guarantees nearly the highest excitation efficiency for the current single molecule fluorescence experimental setup for clear defocus imaging of the sample. Fig. 2 presents a typical single molecule fluorescence defocus image of a PnBMA film (Mw = 40 × 103 g/mol) doped with PnBMA of same molecular weight with a PDI core. Fluorescence emission patterns of individual fluorophores are clearly visible. Most of them are of double-lubed shape. As demonstrated in previous literature [10-14], such well-defined symmetrical double-lubed-shaped emission patterns indicate the dipole moments of these fluorophores are oriented parallel to the image plane, i.e., the film's surface. Besides the majority of horizontally oriented fluorophores, a few fluorophores having outof-plane orientation are also visualized, as demonstrated by a few recorded asymmetrical emission patterns. Because the excitation light is tuned to be circularly polarized, molecules with different spatial orientation have equal excitation probability. Such an inplane orientation of the majority of the fluorophores is attributed to the spatial confinement effect by the thin film geometry and the polymer-substrate interaction. As expected, under the temperature studied that is below or around glass transition temperature of PnBMA, no translational diffusion of the fluorophores was observed, while rotation of individual fluorophore was clearly visualized. A typical video of defocus fluorescence microscopy is provided in Supporting information.

|
Download:
|
| Fig. 2. A typical fluorescence defocus image of star PnBMA with the PDI core (Sample 1 in Table 1) doped in thin film made of blank star PnBMA (Mw = 40 × 103 g/ mol). The temperature is 27.4 ℃ and the film thickness is 75 nm. The dimension of the image is 50 μm × 50 μm. The direction of fluorescence emission dipole moment of the PDI fluorophore is displayed in accordance with its chemical structure. Inset: A magnified portion of the larger image with the arrow denoting the orientation of the dipole moment. | |
Image analysis was conducted using an open source image processing software, Image J. Procedure of defocused pattern analysis and angle identification by Image J was shown in Figs. S4 and S5 (Supporting information), and a detailed description is attached to explain the process.
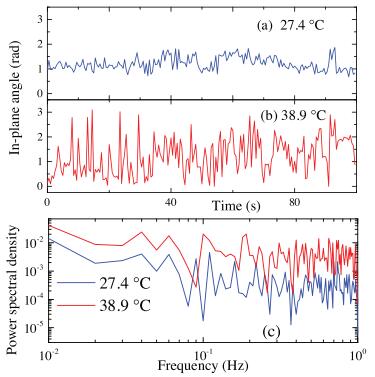
The rotation of multiple fluorophores inside the samples is investigated under different temperatures. It is quite obvious that at relatively low temperatures, most of the emission patterns are stationary, indicating that most of the probes' motion is frozen. As temperature increases, rotation of individual fluorophores begins to be visualized. Figs. 3a and b displays two typical examples of rotation trajectories of PDI core of PnBMA (Sample 1 in Table 1), recorded at 27.4 ℃ and 38.9 ℃, respectively. The enhanced activation of rotation at higher temperature is clearly observed: much larger amplitude of in-plane angle variation is recorded at 38.9 ℃ than at 27.4 ℃. As it is well-known that the dynamics inside a glassy system is inhomogeneous [33] and it is rather difficult to define a single relaxation time to describe the dynamics. The rotation trajectories shown in Fig. 3 also demonstrate broad distributions of the relaxation dynamics by the fact the large variation in time between the adjacent rotation displacements. Therefore, as proved by a previous investigation, it is more desirable and also informative if the dynamics is shown in frequency domain instead of time domain [34, 35]. By fast Fourier transformation of the rotation trajectories, the power spectrum of the single fluorophore's motion is generated (Fig. 3c). The frequency window of the power spectra is 100-10-2 Hz -the high frequency end is determined by the time resolution of the image acquisition and the low end determined by overall length of the rotation trajectory. In order to have parallel comparison between the power spectra, the rotation trajectories have been truncated to be of equal length. The inspection of power spectra demonstrates the existence of individual local vibration modes as shown by the discrete peaks in the power spectra. By comparing the power spectra of fluorophore's rotation under different temperature, it is discovered that the power spectral density for rotation at 39.8 ℃ is much higher than that of 27.4 ℃ across the whole frequency window. Apparently, the much more activated rotation of the fluorescent core of the star PnBMA is observed in both time domain and frequency domain.

|
Download:
|
| Fig. 3. Examples of rotation trajectories of the PDI core of PnBMA (Sample 1 in Table 1) recorded at 27.4 ℃ (a) and 38.9 ℃ (b). Their corresponding power spectra are displayed in (c). | |
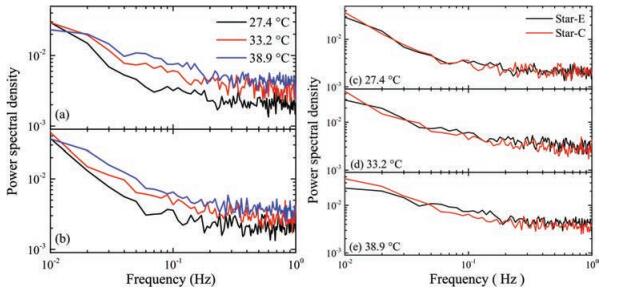
Due to the existence of dynamical heterogeneity inside the glassy systems, the power spectrum from the rotation trajectory of the individual probe is different from one to another (Individual power spectra are provided in Supporting information, Fig. S6). In the current study, more than 65 fluorophores are investigated under each experimental condition and their average power spectra are displayed in Fig. 4. Obviously, the overall power spectral density increases with temperature for both probes (Figs. 4a-b), indicating the vast activation of the local dynamics when temperature is raised. It is also observed that there are more spectral density increases in the high frequency region than the low frequency region. Near the low frequency end, the value at 38.9 ℃ becomes even lower than that at 33.2 and 27.4 ℃. This is the result of decrease in size of the cooperatively rearranging region (CRR) with the increase of temperature [33]. As demonstrated in a previous study [34], the dynamics probed by the fluorophore is closely related to its physical size. Under lower temperature when the CRR region is bigger, the PDI fluorophore probes the cooperative dynamics of a bigger CRR domain and therefore exhibit higher vibration mode at lower frequency. At higher temperature, the dimension of the CRR domain decreases, bringing about local cooperative dynamics at higher frequency, as reflected by the vibration modes in the power spectra of the fluorophores' rotation.

|
Download:
|
| Fig. 4. The averaged power spectra of more than 65 fluorophores recorded in the film sample of 75 nm thickness under different temperature. (a) four-arm star PnBMA with arm end labelled by PDI, (b) four-arm star PnBMA with branch point labelled by PDI. (c-e) Comparison of power spectra between the arm's end labelled (Star-E) and branch point labelled (Star-C) PnBMA samples at 27.4 ℃, 33.2 ℃ and 38.9 ℃, respectively. | |
Difference between the dynamics at the core of the star polymer and that at arm's end shows up in the comparison of the power spectra of the fluorescent probes' rotation located at each position, as shown in Figs. 4c-e. At lower temperature (27.4 ℃), the power spectra of Star-C and Star-E overlap with each other, showing that at this temperature, both Star-C and Star-E are poorly activated, possibly due to the fact that their dynamic mode lower than the detection frequency limit (10-2 Hz). As temperature increases, the difference between Star-C and Star-E becomes more and more obvious -for Star-C, its activated vibration is more dominant in lower frequency region (< 5 × 10⁻² Hz) while that of Star-E appears in higher frequency region (Figs. 4d and e). The results demonstrate the difference between the dynamics at the core and at the arm's end of this four-arm star PnBMA -the local dynamics at the arms' end has higher frequency than that at the core of the star. In terms of CRR picture, the domain dimension of the cooperative motion at the arms' end is smaller than that at the core. This is attributed to the availability of more free space at the arms' end than that at the core, which obviously has a higher segmental density.
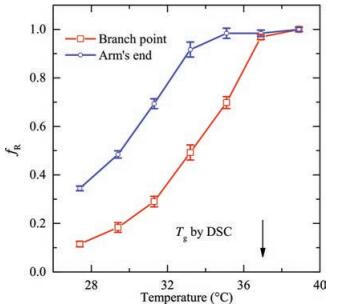
The activation of vibration modes of high frequency at elevated temperature indicates more absorption of thermal energy by the system, expressed by the more vigorous rotation of the fluorophores [34, 35]. As a reflection of the activation energy of the sitedependent dynamics, the variable of the fraction of rotating molecules (fR) is adopted, i.e., the ratio of number of rotating fluorophores over the total number of fluorophores in the field of view (fR = Nrotating/Ntotal), where Nrotating is the number of rotating fluorophores and Ntotal is the total number of the fluorophores in the images [14, 15]. Due to the accuracy of angle recognition is ± 5°, the rotating fluorophores were defined as those which showed more than 10° changes in orientation angle. It can be imaged that the value of fR will go to unity if the observation window is infinitely wide, as all molecules will undergo rotation at infinitely prolonged observation time. However, for the finite and fixed observation time window in the current study, the fR value should not go to unity under all cases and should have a temperature dependence. For each sample, the data analysis was conducted within an identical time window, 200 s. The fR data are displayed in Fig. 5. No matter whether the PDI fluorophore is positioned at the branch point or at the arm's end, the fR value increases monotonically with temperature, as a result of the activation of rotation of more and more fluorophores. Importantly, a vast difference is observed at the arms' end and at the branch point -the fR value at the arm's end is constantly higher than that at the branch point, before both values reach unity at high enough temperature. These results show that the activation energy at the arm's end is much lower than that at the branch point. This is in good agreement with the power spectra data as both of them show that effect of the larger free space at the arm's end compared with the more densely packed core.

|
Download:
|
| Fig. 5. The temperature dependence of the fraction of rotating PDI fluorophores (fR) positioned at the branch point and at arm's end of star PnBMA. The thickness of the films is 75 nm. | |
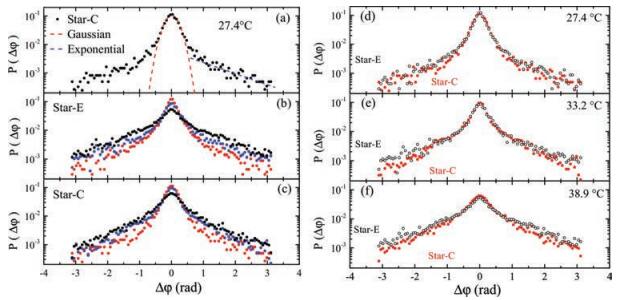
The distribution of the angular displacement (Δj) of an identical time interval of 0.5 s is analyzed to examine the amplitude of the rotational motion, and the results are displayed in Fig. 6. It is obvious that there exist two regions with different feature of distribution super-positioned: the smaller displacement region exhibiting the Gaussian distribution and the lager displacement with an exponential distribution (non-Gaussian) (Fig. 6a). These data demonstrate the existence of the dynamical heterogeneity for motion with large angular displacement of the glassy system while the dynamics is ergodic for small displacements. Provided that there is plenty of free space rendered by the star architecture, such an ergodic feature for small displacement is quite understandable. For the larger displacement, which requires cooperative motion of a much bigger volume, the dynamical heterogeneity emerges.

|
Download:
|
| Fig. 6. (a) Distribution of displacement (within the time interval of 0.5s)of in-plane orientation angle of PDI at the branch point of four-arm star PnBMA (Star-C)at 27.4 ℃.The red dashed line demonstrates the Gaussian distribution function fit and the blue dashed line is for the exponential fit. (b-c) Distribution of in-plane orientation angle displacement of PDI at the branch point of four-arm star PnBMA (Star-C) and at the arm's end (Star-E) under different temperatures, i.e., 27.4 ℃ (black), 33.2 ℃ (blue) and 38.9 ℃ (red). (d-f) Distribution of displacement of in-plane orientation angle of Star-C and Star-E at 27.4 ℃, 33.2 ℃ and 38.9 ℃, respectively. Data are rescaled for the purpose of comparison. | |
Temperature evolution of angular displacement distribution shows the effect of higher activation (Figs. 6b-c). For both labelling sites, with the increase of temperature, the probability of smaller displacement decreases while that of large displacement increases, a feature showing the broadening of the overall distribution and demonstrating more "violent" rotational motion of the fluorophores. The non-Gaussian parameters, α=〈(Δφ)4〉/3〈(Δφ)2〉2-1, is calculated to check the degree of dynamical heterogeneities, which shows that the α value for the core of the star is constantly higher than that at the arm's end. At 27.4 ℃, the α value of Star-C is 2.92 and that of Star-E is 2.38. At 38.9 ℃, the α value changes to 0.76 and 0.35, respectively. The dynamical heterogeneity is more severe at the core of the star polymer than at the arm's end. This is again due to the bigger free space at the arm's end than at the core, where a higher segmental density should be found. Both values decrease at higher temperature, indicating the rapid decreasing of dynamical heterogeneity.
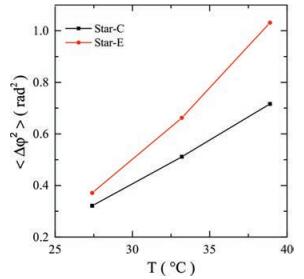
Direct comparing of angular displacement distribution between Star-C and Star-E under identical temperature is shown in Figs. 6c-e. At low temperature far below Tg, 27.4 ℃, the difference between Star-C and Star-E is not obvious because the thermal energy (kBT) is not high enough to fully activate the local vibration mode for both labelling sites. At the rising of the temperature, more local vibration modes are activated and the difference in distribution of angular displacement becomes noticeable. It is discovered that the difference between the core and the arm's end of the star PnBMA shows up in the region of large displacement. The fact that the dynamics at the arm's end is much more activated can be even more obvious in the data of averaged square angular displacement 〈Δφ2〉, shown in Fig. 7, in which both the 〈Δφ2〉 values of Star-E and Star-C increase with temperature and the value of Star-E is constantly higher than that of Star-C. The difference between these two sites is discovered to increase from 0.05 rad2 at 27.4 ℃ to 0.32 rad2 at 38.9 ℃, indicating a much higher mobility of arm's end than branch point.

|
Download:
|
| Fig. 7. Temperature dependence of averaged square angular displacement (〈Δφ2〉) of PDI fluorophores positioned at the branch point (Star-C) and at arm's end (Star-E) of star PnBMA. Thickness of films is 75 nm. | |
It has long been predicted that the free volume at different sites of polymer molecules results in vast variety in local dynamics. For example, the well-known Fox-Flory relation [36] describing the molecular weight dependence of glass transition temperature is believed to be related to higher segmental dynamics at polymer chain ends. The discovery made by the current study at single molecular level clearly demonstrates the huge difference in local dynamics between the branch point and the arm's end of a fourarm star polymer. The topological constraint at the branch point of the star polymer amplifies the possible difference in local dynamics compared with the arm's end.
By taking the strategy of using functionalized perylene diimide (PDI) as the initiator for atom transfer radical polymerization, four arms star poly(n-butyl methacrylate) with this fluorophore labelled at branch point is successfully synthesized. This approach has been proved to be very promising to position the fluorophore right at the core of a star polymer. Such a precise labeling protocol has been demonstrated for the site-sensitive probing of local dynamics within a polymer of rich molecular architecture. Results by single molecule fluorescence defocus microscopy expose a vast difference in dynamics between the core and the arm's end of the glassy star polymer. The power spectra of rotation trajectories, the population of rotating fluorophores as well as the distribution of angular displacement clearly demonstrate that the arm's end has lower activation energy and a higher mobility than the branch point.
AcknowledgmentThis work was supported by National Basic Research Program of China (No. 2014CB643601).
Appendix A. Supplementary dataSupplementary data associated with this article can be found, in the online version, at http://dx.doi.org/10.1016/j.cclet.2017.07.010.
| [1] |
M.D. Ediger, Annu. Rev. Phys. Chem. 51 (2000) 99-128. DOI:10.1146/annurev.physchem.51.1.99 |
| [2] |
A. Wisitsorasak, P.G. Wolynes, J. Phys. Chem. B 118 (2014) 7835-7847. DOI:10.1021/jp4125777 |
| [3] |
T.N. Liang, X.Y. Zhang, X.Z. Yang, Chin. Chem. Lett. 12 (2001) 827-828. |
| [4] |
S. Plaza-García, R. Lund, A. Alegría, et al., Macromolecules 44 (2011) 7810-7819. DOI:10.1021/ma2014436 |
| [5] |
A.J. Simpson, D.J. McNally, M.J. Simpson, Prog. Nucl. Magn. Reson. Spectrosc. 58 (2011) 97-175. DOI:10.1016/j.pnmrs.2010.09.001 |
| [6] |
Y. Miwa, S. Shimada, O. Urakawa, S. Nobukawa, Macromolecules 43 (2010) 7192-7199. DOI:10.1021/ma1013644 |
| [7] |
R.A.L. Valle'e, W. Paul, K. Binder, Macromolecules 43 (2010) 10714-10721. DOI:10.1021/ma101975j |
| [8] |
K. Paeng, L.J. Kaufman, Chem. Soc. Rev. 43 (2014) 977-989. DOI:10.1039/C3CS60186B |
| [9] |
E. Braeken, G. De Cremer, P. Marsal, et al., J. Am. Chem. Soc. 131 (2009) 12201-12210. DOI:10.1021/ja901636v |
| [10] |
J.J. Macklin, J.K. Trautman, T.D. Harris, L.E. Brus, Science 272 (1996) 255-258. DOI:10.1126/science.272.5259.255 |
| [11] |
M. Bohmer, J. Enderlein, J. Opt. Soc. Am. B 20 (2003) 554-559. DOI:10.1364/JOSAB.20.000554 |
| [12] |
H. Uji-i, S.M. Melnikov, A. Deres, et al., Polymer 47 (2006) 2511-2518. DOI:10.1016/j.polymer.2005.11.094 |
| [13] |
A. Deres, G.A. Floudas, K. Müllen, et al., Macromolecules 44 (2011) 9703-9709. DOI:10.1021/ma201449p |
| [14] |
Z.L. Zheng, F.Y. Kuang, J. Zhao, Macromolecules 43 (2010) 3165-3168. DOI:10.1021/ma902569n |
| [15] |
Z.L. Zheng, D. Li, J. Yang, J. Zhao, Sci. China:Chem. 57 (2014) 389-396. |
| [16] |
J.M. Torres, C.M. Stafford, D. Uhrig, B.D. Vogt, J. Polym. Sci. Part B:Polym. Phys. 50 (2012) 370-377. DOI:10.1002/polb.23014 |
| [17] |
M.D. Hossain, D. Lu, Z. Jia, M.J. Monteiro, ACS Macro Lett. 3 (2014) 1254-1257. DOI:10.1021/mz500684v |
| [18] |
L. Qi, Y.Q. Lin, F.S. Wang, Chin. Chem. Lett. 7 (1996) 653-656. |
| [19] |
Y.Y. Cui, Y.E. Ren, X.X. Liu, Chin. Chem. Lett. 23 (2012) 985-988. DOI:10.1016/j.cclet.2012.06.026 |
| [20] |
Z.W. Yu, S.X. Gao, K. Xu, et al., Chin. Chem. Lett. 27 (2016) 1696-1700. DOI:10.1016/j.cclet.2016.04.018 |
| [21] |
E. Glynos, B. Frieberg, H. Oh, et al., Phys. Rev. Lett. 106 (2016) 128301. |
| [22] |
B. Frieberg, E. Glynos, P.F. Green, Phys. Rev. Lett. 108 (2012) 268304. DOI:10.1103/PhysRevLett.108.268304 |
| [23] |
E. Glynos, B. Frieberg, P.F. Green, Phys. Rev. Lett. 107 (2011) 118303. DOI:10.1103/PhysRevLett.107.118303 |
| [24] |
P.G. de Gennes, J. Chem. Phys. 55 (1971) 572-579. DOI:10.1063/1.1675789 |
| [25] |
Y. Matsumiya, H. Watanabe, Macromolecules 34 (2001) 5702-5710. DOI:10.1021/ma010147q |
| [26] |
K. Paeng, R. Richert, M.D. Ediger, Soft Matter 8 (2012) 819-826. DOI:10.1039/C1SM06501G |
| [27] |
W. Schroeyers, R. Vallée, D. Patra, et al., J. Am. Chem. Soc. 126 (2004) 14310-14311. DOI:10.1021/ja0474603 |
| [28] |
K. Matyjaszewski, Macromolecules 45 (2012) 4015-4039. DOI:10.1021/ma3001719 |
| [29] |
L.Y. Yang, M.M. Shi, M. Wang, H.Z. Chen, Chin. Chem. Lett. 19 (2008) 1260-1263. DOI:10.1016/j.cclet.2008.07.008 |
| [30] |
G. Boobalan, P.M. Imran, S. Nagarajan, Chin. Chem. Lett. 23 (2012) 149-153. DOI:10.1016/j.cclet.2011.10.017 |
| [31] |
M. Meldal, C.W. Tornoe, Chem. Rev. 108 (2008) 2952-3015. DOI:10.1021/cr0783479 |
| [32] |
D. Magde, E.L. Elson, W.W. Webb, Biopolymers 13 (1974) 29-61. DOI:10.1002/(ISSN)1097-0282 |
| [33] |
G. Adam, J.H. Gibbs, J. Chem. Phys. 43 (1965) 139-146. DOI:10.1063/1.1696442 |
| [34] |
H. Zhang, K. Tao, D. Liu, et al., Soft Matter 12 (2016) 7299-7306. DOI:10.1039/C6SM01447J |
| [35] |
H. Zhang, D.S. Li, K. Wu, et al., Polymer 116 (2017) 452-457. DOI:10.1016/j.polymer.2017.01.002 |
| [36] |
T.G. Fox, P.J. Flory, J. Polym. Sci. 14 (1954) 315-319. DOI:10.1002/pol.1954.120147514 |