 2018, Vol. 29


b College of Textile & Clothing, Jiangnan University, Wuxi 214122, China
Waste water from the textile industry contains pigments or dyes that severely pollute the environment. Therefore, water decontamination is an urgent problem that should be addressed [1, 2]. In the past few decades, photocatalysis, a green and sustainable technology, has attracted substantial attention in environmental restoration [3-11]. TiO2 is the most widely used semiconductor for the photocatalysis of organic pollutants given its non-toxicity, low cost, high photocatalytic activity, and photostability [12, 13]. Bulk TiO2 can produce a negatively charged electron/positively charged hole pair after absorbing high-energy photons (higher than the energy band gap of TiO2), which are then oxidized by the hole. TiO2 can be prepared with various nanoscale morphologies, such as thin films, particles, and fibers [14-17]. However, some disadvantages should be resolved for practical applications of TiO2: 1) the aggregation of TiO2 nanoparticles, which results from the high surface energy of TiO2 and weakens photocatalysis, 2) the difficult separation of used TiO2 nanoparticles via centrifugation or filtration from the treatment apparatus, and 3) the low-efficiency utilization of solar energy by TiO2, which is caused by its high-energy band gap. The development of a flexible nanostructure TiO2 photocatalyst with enhanced photocatalytic activity is one approach to resolve these issues.
Given the inherent properties of TiO2, such as fragility and stiffness, researchers have attempted to introduce TiO2 on/into some flexible substrates. SiO2 is an excellent catalyst support because of its chemical inertia, thermal stability, reactant absorption, and most importantly, excellent flexibility when manufactured as nanofibers. SiO2 nanofibers have excellent advantages, such as high surface-area-to-volume ratio and favorable recycling properties. SiO2 nanofibers can be obtained with the help of filament materials via a combined process of sol-gel preparation, electrospinning, and calcination [18-20]. In addition, metal oxides or metal sulfides can be fabricated by this combined process. Water-soluble polymers, including but not limited to poly(vinyl alcohol), poly(vinylpyrrolidone), and poly(ethylene oxide), are used as filament materials during sol-gel preparation and electrospinning. Therefore, incorporating TiO2 into SiO2 to produce nanofibrous composites is suitable for industrial applications [21]. The nanofibrous composite possesses ultrahigh surface area-to-volume ratio and an open three-dimensional structure that facilitates the access of reactants to surface active sites. Furthermore, although nanoparticle TiO2 may have better photocatalytic efficiency, bulk TiO2 composite is easier to separate from reaction apparatus than nanoparticle TiO2.
Various attempts have been made to extend the absorbent range of TiO2 to the visible region. These attempts include dye sensitization, polymer modification, nonmetal doping, semiconductor coupling, transition-metal doping, and spatial structuring [22-25]. Liu et al. reported that TiO2-SiO2 composite fibrous membranes that have been surface-coated with polyaniline (PANi) exhibit enhanced photocatalytic activity for the degradation of MO under visible light [26]. PANi may function as a photosensitizer. The excited electrons in PANi readily migrate to the conduction band of TiO2 and subsequently transfer to the surface to react with water and oxygen, thus producing hydroxyl and superoxide radicals with strong oxidation capability. Polypyrrole (PPy) is another typical conjugated organic polymer (COPs) that have been successfully applied in organic electronic devices and solar cells [27]. The spatially extended π-bonding system in PPy molecules enable it become one of the potential energy materials, because of its unique electrical and optical properties, such as high photon absorption coefficients under visible light irradiation [28]. It had been reported that PPy owns the excellent adsorption capacity for many contaminants [29-31]. Furthermore, PPy could significantly improve solar energy conversion and photocatalytic performance of metal oxide [32]. Therefore, an increasing interest is found on the fabrication of PPy-TiO2 nanocomposites for photocatalytic degradation of environmental pollutants as well as water splitting to generate hydrogen [33-35].
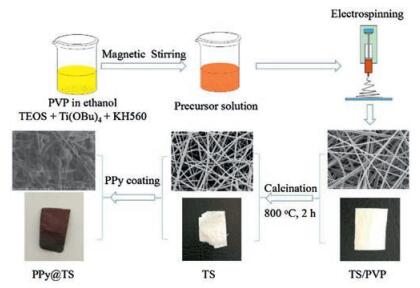
This study developed nanofibrous polypyrrole-coated TiO2/SiO2 (PPy@TS) membranes for optimal photocatalytic degradation. TS and nanofibrous PPy@TS membranes were prepared via the combination of sol-gel process, electrospinning technique, calcination, and in situ polymerization, as shown in Fig. 1.

|
Download:
|
| Fig. 1. Preparation and synthetic mechanism of nanofibrous PPy@TS membrane. | |
In details, aqueous TiO2/SiO2 (TS) sol was prepared through hydrolysis and polycondensation. In detail, 0.36 mL of H2O with a pH of 2.3 (pH adjusted by HNO3) was added to 1.89 g of (3-Glycidyloxypropyltrimethoxysilane) (KH560). Then, 0.42 g of tetraethyl orthosilicate (TEOS), and 3.40 g of titanium n-butoxide (Ti(OBu)4), were added to the above solution and stirred to produce a homogeneous solution. Next, 0.06 g/mL of poly(vinylpyrrolidone) (PVP, Mw = 1, 300, 000 g/mol, purchased from Sigma-Aldrich) ethanol solution (12 mL) was slowly dropped into the TS sol to improve film formation capability. The mixture was vigorously stirred at room temperature for 5 h to produce a clear yellow solution, which was then transferred into a plastic syringe for electrospinning. Electrospinning was conducted at a fixed electrical voltage of 15 kV, pump speed of 2.0 mL/h, and needle tip-to-collector distance of 20 cm. The fiber membrane was collected on aluminum foil, peeled off, and labeled as TS/PVP. The membranes were calcined at 400 ℃, 600 ℃, and 800 ℃ for 2 h to remove PVP, and designated as TS400, TS600, and TS800 based on calcination temperature. The membrane without calcination was designated as TS/PVP.
PPy coating was performed in an ice water bath by polymerizing Py on the surfaces of TS800 membranes. Before coating with PPy, the hydrophilicity of TS membranes was increased by rinsing with acetone, ethanol, and distilled water. Thereafter, TS800 membranes were soaked in 15 mL of Py solution (1 mL of Py dissolved in 50 mL of 1 mol/L HCl solution). Then, 1 mol/L HCl APS solution was added. The molar ratio of Py and APS was adjusted to 2:1. PPy was formed after a few minutes and coated on the surface of TS800 membranes. After coating with PPy, the obtained membranes were removed from the solution, washed with distilled water to remove oligomers, and dried at 40 ℃ overnight. TS membranes with PPy coating were designated as PPy@TS400, PPy@TS600, and PPyTS800, respectively.
The morphology of nanofibers was observed through SEM (JSM-5900, Japan Electron Optics Laboratory Co., Ltd.) and HRTEM (Tecnai G2F20). TGA was performed using a thermal analyzer (PTC-10A) under a gas flow of 20 mL/min and a heating rate of 10 ℃/min. Fourier transform infrared spectroscopy (FTIR) tests were conducted on a Spectrum 100 FTIR spectrometer (PerkinElmer, US). The N2 adsorption-desorption isotherms were recorded via a Quantachrome AutoSorb iQ-MP. XRD patterns of the samples were recorded using an X-ray diffractometer (Rigaku D/Max 2200PC) with a graphite monochromator and Cu Kα radiation (λ = 0.15418 nm) in 10°−70° at room temperature. The voltage and electric current were fixed at 28 kV and 20 mA, respectively. The optical properties were observed with a diffused reflectance UV-visible spectrometer.
To evaluate the adsorption performance and photocatalytic properties of the catalysts, methyl orange (MO) was selected as the model dye indicator. All adsorption experiments were performed in 50 mL serum bottles sealed with polytetrafluoroethylene stoppers at 30 ℃. Membranes with a weight of 0.2 g were immersed in 30 mL of MO solution (1.0 mg/L) and stored in the dark for 2 h to achieve the adsorption equilibrium for MO. Thereafter, the adsorbent was centrifuged at 4000 rpm for 5 min and then the MO concentration in the supernatant was analyzed at 465 nm using an UV–vis absorption spectrophotometer (UV1600, MAPADA).
The amounts of MO adsorbed on various membranes, Q (mg/g), were calculated from the following equations:
|
(1) |
where C0 and C are the initial and final concentrations of MO in the solution, respectively; V is the volume of the solution, and M is the mass of the nanofibrous membranes.
A 500-W xenon lamp was used as a light-source for photocaltalytic examination. At selected time intervals, decreases in the concentrations of MO solutions were analyzed at 465 nm using an UV–vis absorption spectrophotometer. The MO calibration curve was prepared by measuring the absorbance of different predetermined sample concentrations. The photocatalytic activities of MO on TS400, PPy@TS400, TS600, PPy@TS600, TS800 and PPy@TS800 membranes were examined.
The XRD patterns of TS/PVP and nanofibrous membranes that were calcined at 600 ℃, 700 ℃, or 800 ℃ are shown in Fig. S1 (Supporting information). The TS/PVP and TS400 samples exhibit a similar diffuse pattern, which indicated the amorphous characteristics of the nanofibrous composites. As the calcination temperature increased to 600 ℃, a crystal peak appeared at 2θ = 25°. The calcination temperature of 800 ℃ resulted in the appearance of crystal peaks of 25.3°, 37.9°, 48.1°, 54.0°, and 62.8°, which were indexed as the (101), (004), (200), (105), and (204) planes of anatase TiO2, respectively. Pure TiO2 mostly existed in crystal form. However, TiO2 was dispersed into composites as it was treated at a low temperature and would not exist as crystals with sufficient size for XRD detection. Therefore, the formation of anatase phase would be extended to higher temperature in TiO2/SiO2 composite fiber systems.
To further investigate the micro-structures of the fibers, the typical TEM images of TS800 nanofibers were analyzed. The obvious lattice fringes in the typical HRTEM image of TS800 nanofibers, as shown in Fig. S2 (Supporting information), were ascribed to the (101) crystallographic planes of anatase (d101 = 0.36 nm). Fig. S2d presents a TEM image of TS800 at a low magnification. The image suggests that the fibers possess a completely mesoporous structure, whereas TS/PVP possesses a compact inner structure (Fig. S2a). The corresponding selective area electron diffraction pattern (Fig. S2f) of the TS800 fibers (red circle in Fig. S2d) revealed the typical diffraction rings that indicate polycrystallinity.
The SEM images of nanofibrous TS/PVP, TS400, TS600, and TS800 membranes are shown in Fig. S3 (Supporting information). The nanofibers had smooth surfaces and diameters that ranged from 50 nm to 700 nm. To improve the mechanical performance of the nanofibrous membranes, Si-based compounds (TEOS and KH560) were added to the precursor solution. The Ti/Si mole ratio was also considered and selected as 1:1 to obtain nanofibers with suitable mechanical properties and photocatalytic activity. Liu et al. previously reported similar TiO2/SiO2 nanofibrous membranes with flexible and photocatalytic properties [26]. The calcination process affected the morphology of TS nanofibers, as shown in Figs. S3b-d and S3f-h. The nanofibers that were calcined at high temperatures of 400 ℃, 600 ℃, and 800 ℃ exhibited some irregular fractures.
To evaluate the thermostability of the resultant nanofibrous membranes, the samples were quantitatively determined via TG analysis under air atmosphere. The TG curves for nanofibrous TS/PVP and TS800 membranes are shown in Fig. S4a (Supporting information). The two samples showed different weight loss processes. In the case of nanofibrous TS/PVP membrane, the TG curve shows three weight loss steps. The first weight loss step at below 200 ℃ is attributed to the removal of physically adsorbed water and excess solvent during the electrospinning process. The most significant weight loss at 200 ℃–500 ℃ is attributed to the decomposition of Ti(OBu)4, TEOS, KH560, and PVP. The final minor weight losses at 500 ℃ − 800 ℃ may be caused by the further degradation of organic components. However, the TS800 sample exhibited a straight line for TG curve, which indicated that the calcination treatment had removed all organic compounds and only the composite of TiO2 and SiO2 was retained.
The composition of nanofibers or nanofibrous membranes could be confirmed by their FTIR spectra. At approximately 3400 cm−1, both spectra for TS/PVP and PPy@TS800 membranes contained the characteristic peak from the —OH group and the H—O—H stretching and bending vibrations, which may be caused by the adsorbed water molecules in the nanofibrous membranes. However, this peak disappeared from the spectrum of the TS800 sample because the hydrophobic surface of TiO2/SiO2 had difficulty adsorbing water molecules. Moreover, as shown in Fig. S4b (Supporting information), the peak at 2970 cm−1 originated from the stretching vibration of the C—H band on PVP, and the peaks from 1500–1375 cm−1 were assigned to the C—H and —C—C— bands of PVP and organic solvents. After the membranes were calcined at the high temperature of 800 ℃, however, determining any characteristic peak that belonged to PVP or organic solvent was difficult. Therefore, all of the organic compounds had been removed, and only TiO2 and SiO2 remained in the nanofibrous membranes. The peaks at 1110 and 1200 cm−1 were due to asymmetric Si-O-Si stretching vibrations that are associated with the motion of oxygen in Si-O-Si antisymmetric stretching. The band at 799 cm−1 is assigned to Si-O-Si symmetric stretching. The band at approximately 920 cm−1 was assigned to the asymmetric Ti-O-Si vibrations of TiO2 and SiO2 mixed oxides. The characteristic peaks of PPy are mostly covered by the peaks of the TiO2/SiO2 composite; however, an obvious peak at 1630 cm−1 indicated the presence of the Si-OH group, which likely resulted from the improved hydrophilicity of the PPy@TS800 surface.
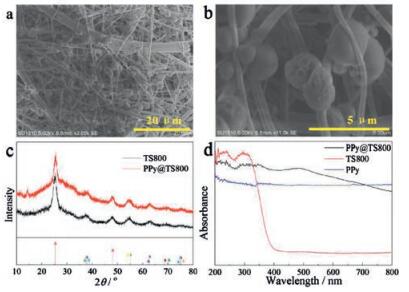
The surface of TS800 nanofibers could function as nucleation centers or growth templates for the in situ polymerization of PPy. As shown in Figs. 2a and b, PPy particles formed not only on the surface but were also embedded in the matrix of the TS800 nanofibers. These results were different from the previous study of Liu et al., who found that the conductive polymer molecules of PANi were densely and uniformly distributed on the surfaces of TS nanofibers without any aggregation [26]. Furthermore, another parameter affected the morphology of polymer-coated TS fibers: Within the very short reaction time of 0.5 h, TS800 nanofibers became rough but could not be fully covered by the conductive polymer. However, prolonging reaction time would result in a very thick layer of conductive polymer, which will hinder photocatalytic activity. Therefore, in this work, the polymerization time was selected as 1 h for PPy coating. As shown in Fig. 2c, the peak centered at 2θ = 15° is the characteristic doping diffraction peak of PPy. However, other characteristic peaks were difficult to observe because most of them overlapped with the peaks of TS800 composite. Fig. 2d shows the optical absorption spectra of PPy@TS800, TS800 and pure PPy, respectively, in the region of 200–800 nm. The absorption of undoped TS800 nanofibers begins to rise rapidly once the wavelength decreases below 400 nm. With the PPy doping, the absorption shifts to longer wavelengths, significantly. After the in situ polymerization of PPy, the much greater absorption in the visible range from 400–800 nm indicated the possible enhancement of photocatalytic activity on PPy@TS800 nanocomposite.

|
Download:
|
| Fig. 2. a–b) SEM images of nanofibrous PPy@TS800 membrane obtained under × 2000 and × 11000, respectively; c) XRD patterns of the nanofibrous TS800 and PPy@TS800 membranes; d) UV–vis diffused reflectance spectra of PPy@TS800, TS800 and PPy, respectively. | |
The N2 adsorption-desorption isotherms of PPy@TS800 membrane (Fig. S5 in Supporting information) are used to analyze the properties of photocatalytic membranes, and the data of the pore size distribution, pore volume, and surface area are listed in Table 1. As shown in Fig. S5, the isotherm increases slowly at low relative pressure (below 0.5); but adsorption increases rapidly at high relative pressure (between 0.5 and 1.0). As shown in Table 1, the BET surface areas of the TS800 and PPy@TS800 membrane are 5.0586 m2/g and 15.806 m2/g, respectively, and the corresponding pore volumes are 0.044 cm3/g and 0.069 cm3/g. It is noted that surface area, pore volume, and pore diameter are much different between the two samples. It is reasonable to believe that the PPy coating on the TS membrane might change the relative surface area, and resulted in the larger pore volume and smaller pore diameter. The photocatalyst of PPy@TS800 with larger surface area may exhibit higher photocatalytic degradation efficiency compared with TS800, which can be confirmed by the following photocatalytic degradation results.
|
|
Table 1 Specific area distribution, pore volume distribution and pore diameter of PPy@TS800. |

The photocatalytic activities of nanofibrous membranes were evaluated by measuring MO degradation using xenon lamp as the light-source at room temperature. Before the photocatalytic degradation of MO, the photocatalyst was immersed in MO solution and kept in the dark for 2 h to ensure adsorption equilibrium. The values at 465 nm were chosen to illustrate the catalytic performance quantitatively. The MO adsorption capability of various membranes is shown in Fig. S6 (Supporting information). The PPy@TS800 present the highest adsorption capability as 0.12534 mg/g by contrast, MO uptake by TS600 and TS800 only 9.75 × 10⁻⁴ mg/g. It is also remarkable that the PPy modified TS membranes, PPy@TS400, PPy@TS600 and PPy@TS400, showed the better adsorption capability than that of TS membranes without PPy coating. The relative high adsorption of MO on TS400 might be caused by the porous structure of incomplete carbonized TS membrane.
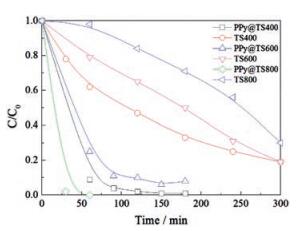
MO degradation by xenon lamp irradiation is negligible in the blank test in the absence of photocatalyst. As shown in Fig. 3, MO was not easily degraded by the samples of TS400, TS 600 and TS800 membranes. By comparing the photocatalytic activity, it was found that the TS membranes with PPy coating exhibit better photocatalytic performance. The photocatalytic degradation efficiency of MO using xenon lamp follows the order: PPy@TS800 > PPy@TS400 > PPy@TS600 > TS400 > TS600 > TS800. Among all the photocatalysts investigated here, the PPy@TS800 membrane possesses the best photocatalytic activity, as the MO is degraded nearly 100% in 60 min. These results demonstrated that the PPy coating on the surface of nanofibrous TS membranes significantly improved the photocatalytic activity of the as-prepared photocatalysts.

|
Download:
|
| Fig. 3. Photocatalytic degradation curves under irradiation. | |
The superior photocatalytic activity of the nanofibrous PPy@TS membrane mainly resulted from its ultrahigh surface area. Moreover, the PPy coating improved degradation efficiency by enhancing the light adsorption area. The possible mechanism of MO photocatalysis on PPy@TS nanofibers could be divided into several steps:
1) Light absorption. Light could not be used by the catalyst when the energy of incident photon is lower than the band-gap energy. By contrast, when the energy of incident photons is higher than the band-gap energy, the energy of photon could be absorbed to stimulate an electron to move through the forbidden band and into the conduction band. Thereafter, a hole will be left at the valance band (h+) and form the electron-hole (e−) pair.
2) Charge transfer. Given the existence of the discontinuous forbidden band, the electron-hole pair that is generated by light has a life span. During this life span, electron-hole pairs without sufficient kinetic energy will recombine and degrade in the form of radiation. However, electrons or holes with sufficient kinetic energy will be transferred to the photocatalyst surface with some being captured and degraded by the crystal internal defects.
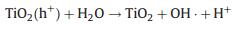
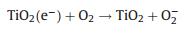
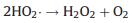
3) Surface reactions. The electron that is transferred on the photocatalyst surface is reductive and could participate in some of the reactions to produce hydrogen. Moreover, the holes have excellent oxidizability and could oxidize and decompose MO into small molecules.
The photocatalytic degradation processes could be explained with the following formulas:
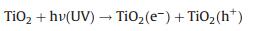
|
(2) |
|
(3) |
|
(4) |

|
(5) |
|
(6) |
|
(7) |

|
(8) |
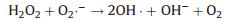
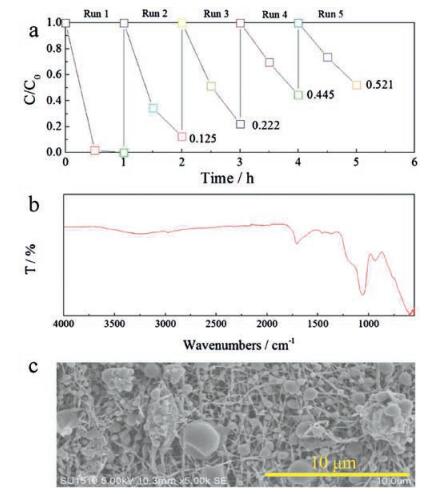
Furthermore, we investigated the stability of the PPy@TS800 membrane, which has the best photocatalytic activity. Fig. 4a shows the recycling test results for the PPy@TS800 membranes. The degradation of MO declines from 100% to 52% after five cycles. Such a decrease might be the reason that the presence of residual organic dye in the nanofibers blocks part of active sites on the photocatalyst [36]. Fig. 4b is the FTIR spectra of PPy@TS800 membrane after five circles photocatalytic tests. It can be noted that the main characteristic peaks are very similar with the as-prepared PPy@TS800 sample, as shown in Fig. S4b (Supporting information). Fig. 4c shows the SEM image of the membrane after five cycles. The PPy particles are still immobilized in the TS800 nanofibrous matrix, and there is no apparent change compared with Figs. 2a–b.

|
Download:
|
| Fig. 4. a) Recycling photocatalytic tests on PPy@TS800 membranes; b) FTIR spectra and c) SEM image of the PPy@TS800 membrane after five circles photocatalytic tests. | |
In summary, nanofibrous PPy@TS membranes were successfully prepared via the combination of sol-gel process, electrospinning, calcination, and in situ polymerization. The prepared membranes were used to degrade MO in waste water under light irradiation. The XRD and TEM results confirmed the formation of anatase TiO2 in the nanofibrous composites after calcination at 800 ℃. Furthermore, TGA results demonstrated that all of the organic compounds were removed during calcination and that only TiO2/SiO2 remained in the nanofibrous membranes. The in situ polymerization of PPy led to the occurrence of PPy particles not only on the surface but also in the matrix of TS nanofibers. The outstanding photocatalytic activity of the PPy@TS samples may result from the synergistic effect of TiO2 and PPy. The recycling tests reveal that the PPy@TS800 membrane is stable and effective for the degradation of dye pollutant. The photocatalytic efficiency of nanofibrous PPy@TS membranes have great potential applications in photocatalysis and water remediation fields.
AcknowledgmentsThis work was supported by National Natural Science Foundation of China (No. 51503083), the Fundamental Research Funds for the Central Universities (No. JUSRP51723B) and the National High-tech R & D Program of China (No. 2016YFB0302901).
Appendix A. Supplementary dataSupplementary data associated with this article can be found, in the online version, at http://dx.doi.org/10.1016/j.cclet.2017.05.020.
| [1] |
S. Eydivand, M. Nikazar, Chem. Eng. Commun. 202(2015) 102-111. DOI:10.1080/00986445.2013.826208 |
| [2] |
A.R. Silva, P.M. Martins, S. Teixeira, et al., RSC Adv. 6(2016) 95494-95503. DOI:10.1039/C6RA19202E |
| [3] |
S. Khanchandani, P.K. Srivastava, S. Kumar, S. Ghosh, A.K. Ganguli, Inorg. Chem. 53(2014) 8902-8912. DOI:10.1021/ic500518a |
| [4] |
B. Chouchene, T. Ben Chaabane, L. Balan, et al., J. Nanotech. 7(2016) 1338-1349. |
| [5] |
Y.X. Liu, J.X. Shi, Q. Peng, Y.D. Li, J. Chem. Eur. 19(2013) 4319-4326. DOI:10.1002/chem.201203316 |
| [6] |
M. Anpo, K. Chiba, M. Tomonari, et al., Chem. Soc. Jpn. 64(1991) 543-551. DOI:10.1246/bcsj.64.543 |
| [7] |
L. Pan, G.Q. Shen, J.W. Zhang, et al., Ind. Eng. Chem. Res. 54(2015) 7226-7232. DOI:10.1021/acs.iecr.5b01471 |
| [8] |
J. Chen, D.M. Zhao, Z.D. Diao, M. Wang, S.H. Shen, Sci. Bull. 61(2016) 292-301. DOI:10.1007/s11434-016-0995-0 |
| [9] |
Y.F. Zhao, B. Zhao, J.J. Liu, et al., Angew. Chem. Int. Ed. 55(2016) 4215-4219. DOI:10.1002/anie.201511334 |
| [10] |
Y.F. Zhao, G.B. Chen, T. Bian, et al., Adv. Mater. 27(2015) 7824-7831. DOI:10.1002/adma.201503730 |
| [11] |
H.J. Yu, R. Shi, Y.X. Zhao, et al., Adv. Mater.(2017), 1605148. |
| [12] |
L.H. Yu, Y. Shao, D.Z. Li, Appl. Catal. B:Environ. 204(2017) 216-223. DOI:10.1016/j.apcatb.2016.11.039 |
| [13] |
J.M. Wang, Z.J. Wang, Z.P. Zhu, Appl. Catal. B:Environ. 204(2017) 577-583. DOI:10.1016/j.apcatb.2016.12.008 |
| [14] |
F. Bensouici, M. Bououdina, A.A. Dakhel, et al., Appl. Surf. Sci. 395(2017) 110-116. DOI:10.1016/j.apsusc.2016.07.034 |
| [15] |
D.Z. Lu, M.C. Yang, P.F. Fang, C.H. Li, L.L. Jiang, Appl. Surf. Sci. 399(2017) 167-184. DOI:10.1016/j.apsusc.2016.12.077 |
| [16] |
C. Lai, M.M. Wang, G.M. Zeng, et al., Appl. Surf. Sci. 390(2016) 368-376. DOI:10.1016/j.apsusc.2016.08.119 |
| [17] |
B.A. Marinho, R.O. Cristovao, R. Djellabi, et al., Appl. Catal. B:Environ. 203(2017) 18-30. DOI:10.1016/j.apcatb.2016.09.061 |
| [18] |
X.Q. Wang, L.Y. Dou, L. Yang, J.Y. Yu, B. Ding, J. Hazard Mater. 324(2017) 203-212. DOI:10.1016/j.jhazmat.2016.10.050 |
| [19] |
X.Q. Wang, L. Doug, Z.L. Li, et al., ACS Appl. Mater. Inter. 8(2016) 34668-34676. DOI:10.1021/acsami.6b11294 |
| [20] |
Y.R. Ren, B. Yang, H.M. Wei, J.N. Ding, Solid State Ionics 292(2016) 27-31. DOI:10.1016/j.ssi.2016.05.002 |
| [21] |
Z.H. Liang, Q.M. Li, F. Li, S.D. Zhao, Res. Chem. Intermed. 42(2016) 7017-7029. DOI:10.1007/s11164-016-2513-z |
| [22] |
C. Wei, Y.H. Zhu, X.L. Yang, C.Z. Li, Mater. Sci. Eng. B:Solid 137(2007) 213-216. DOI:10.1016/j.mseb.2006.11.016 |
| [23] |
Z.L. Shi, X.Y. Zhang, S.H. Yao, Rare Met. 30(2011) 252-257. DOI:10.1007/s12598-011-0377-3 |
| [24] |
H. Zhang, J.L. Zhang, R.J. Sun, Y.X. Zhou, J. Mater. Res. 30(2015) 3700-3709. DOI:10.1557/jmr.2015.352 |
| [25] |
E. Kanchanatip, N. Grisdanurak, N. Yeh, T.C. Cheng, Int. J. Photoenergy(2014), 903612. |
| [26] |
Z.Y. Liu, Y.E. Miao, M.K. Liu, et al., J. Colloid Interf. Sci. 424(2014) 49-55. DOI:10.1016/j.jcis.2014.03.009 |
| [27] |
C.J. Brabec, N.S. Sariciftci, J.C. Hummelen, Adv. Funct. Mater. 11(2001) 15-26. DOI:10.1002/(ISSN)1616-3028 |
| [28] |
F.C. Krebs, Sol. Energy Mater. Sol. Cells 93(2009) 465-475. DOI:10.1016/j.solmat.2008.12.012 |
| [29] |
J. Chen, J. Feng, W. Yan, J. Colloid Interface Sci. 475(2016) 26-35. DOI:10.1016/j.jcis.2016.04.017 |
| [30] |
M.L. Zhang, H.Y. Zhang, D. Xu, et al., Desalination 271(2011) 111-121. DOI:10.1016/j.desal.2010.12.021 |
| [31] |
M. Karthikeyan, K.K. Satheeshkumar, K.P. Elango, J. Hazard. Mater. 167(2009) 300-305. DOI:10.1016/j.jhazmat.2008.12.141 |
| [32] |
C. Janaky, N.R. de Tacconi, W. Chanmanee, K. Rajeshwar, J. Phys. Chem. C 116(2012) 19145-19155. DOI:10.1021/jp305181h |
| [33] |
R.J. Nussbaumer, W.R. Caseri, P. Smith, T. Tervoort, Macromol. Mater. Eng. 288(2003) 44-49. DOI:10.1002/(ISSN)1439-2054 |
| [34] |
W. Feng, E. Sun, A. Fujii, et al., Chem. Soc. Jpn. 73(2000) 2627-2633. DOI:10.1246/bcsj.73.2627 |
| [35] |
H. Ullah, A.A. Tahir, T.K. Mallick, Sensor. Actuators B:Chem. 241(2017) 1161-1169. DOI:10.1016/j.snb.2016.10.019 |
| [36] |
X. Zhang, V. Thavasi, S.G. Mhaisalkar, S. Ramakrishna, Nanoscale 4(2012) 1707-1716. DOI:10.1039/c2nr11251e |