 2018, Vol. 29


b State Key Laboratory of Marine Environmental Science, Xiamen University, Xiamen 361005, China
Graphene, a two dimensional single atomic layer of sp2-hybridized carbon atoms, has been found to be a promising material in a wide range of potential applications including energy storage, electronics, sensing and catalysis [1, 2] owing to its large theoretical surface area, high electron mobility, superior thermal conductivity, remarkable optical transmittance and mechanical properties [3-6]. In addition, three-dimensional graphene (3Dgraphene) materials with the structure of aerogel, sponge or foam present their characteristics comparing with those of twodimensional graphene, such as larger specific surface area, higher mechanical strength, lower density, faster electron and mass transport kinetics [7]. Due to its unique properties, 3D-graphene has been widely used in the fields of catalysis, energy storage, environmental treatment, etc. [8, 9]. Especially, the ultrahigh surface area, porous and unique structure of 3D-graphene makes it to be a good candidate in adsorption [10-12]. The further functionalization of graphene is critical to its fine-tune chemical and physical properties [13]. Graphene oxide, the precursor of the 3D-graphene, can be easily modified chemically due to the various functional groups containing hydroxyl, carboxyl, or epoxy.
Phytic acid, composed of six phosphate groups, provides an excellent characteristic for the modification of numerous substrates [14] owning to the predominant properties such as renewable, non-toxic, environment-friendly and easily obtained from cereals and beans [15, 16]. For example, phytic acid can react with graphene oxide to import hydrophilic functional groups containing inositol triphosphate and phosphoric acid, which exhibits good capability of absorbing both water solutions and hydrophobic oil [17]. Ji et al. exhibited that phytic acid-stabilized Fe3O4-graphene oxide (GOPA@Fe3O4) was assembled by microwave-enhanced hydrothermal synthesis and was used as a sorbent for enrichment of eight polycyclic aromatic hydrocarbons (PAHs) from vegetable oils by magnetic solid-phase extraction (MSPE) [18]. Moreover, phytic acid has gain increasing attention for the anti-corrosion of metal [19], good antioxidant [20] and water treatment [14].
Solid phase microextraction (SPME) is considered as a simple, powerful, rapid and solventless sample preparation technique combining sampling, extraction and preconcentration, by which the desorption of total target compounds and sample introduction into a single step [21]. The key technique of SPME is the variety of fiber coating. SPME has attracted wide attention in the analysis of organic compounds. In the last years, different kinds of fiber coatings and their fabrication methods have been developed including sol-gel technology, electrospinning, electrodeposition, chemical grafting, liquid phase deposition, hydrothermal and physical adhesion approaches. Nerolidol (3, 7, 11-trimethyl-1, 6, 10-dodecatrien-3-ol) is a predominant sesquiterpene present in essential oils from plenty of plants [22]. It was approved as a fragrance ingredient and a food flavoring agent [23, 24]. In general, terpenes are applied to enhance effective skin permeation and nerolidol has been found to be a good candidate for the enhancement of hydrophilic drug transdermal delivery [25]. Moreover, nerolidol exhibits several medicinal benefits such as antibacterial, antiulcer, antitumor and antischistosomal properties [22, 26-28]. In particular, quantitative analysis of the volatile compound for nerolidol is considered as an indicator in the evaluation of tea qualities [29]. Ma et al. showed that higher grades of Wuyi rock tea possess higher content of nerolidol. It is beneficial to tea manufacturers in order to endow desirable flavour characteristics to tea and improve its quality. Therefore, to develop an effective and powerful tool for the analysis of nerolidol in tea samples is necessary.
In this work, a simple strategy to fabricate the 3D phytic acidinduced graphene (PAG) was performed by a hydrothermal method. The PAG was applied as SPME fiber coating. Its extraction performances were then evaluated and compared with those of 100 μm polydimethylsiloxane (PDMS) and 85 μm carboxen/ polydimethylsiloxane (CAR/PDMS) fibers in the analysis of nerolidol in tea samples.
3D heteroatom doped graphene aerogel was prepared by a hydrothermal synthesis method in this work. Graphene oxide was prepared from graphite powders based on a Hummers method with some modification [30, 31]. PAG was synthesized following the report [17]. In brief, 1 mL of phytic acid was mixed into a 15 mL of graphene oxide aqueous dispersion (2 mg/mL, mgraphene oxide : mphytic acid = 1:19), and the mixture was sonicated for 40 min. The obtained mixture was sealed in a 30 mL Teflon-lined stainless steel sealed vessel and maintained at 180 ℃ for 12 h. After the vessel was cooled to room temperature, the product was washed with ethanol and water several times, and then freeze-dried for 24 h. The fabrications of 3D dopamine-induced graphene (DAG) [32] and o-phosphorylethanolamine-induced graphene (PNG) were similar to the PAG, and the mass ratio of graphene oxide and dopamine or o-phosphorylethanolamine was 1:1 and 1:3, respectively. The resultant products exhibited an excellent adsorption ability for oil in these mass ratios [17, 32]. All the chemicals, instruments used in this work and the detailed preparation solutions were shown in the Supporting information (section 1.1-1.4).
The fabrication of solid phase microextraction fiber was illustrated as following. Prior to the coating fabrication, the stainless steel wire (17 cm) was sequentially cleaned with acetone and ultrapure water by ultrasonicator for 5 min, and then dried at room temperature. The treated stainless steel wire (1.5 cm) was immersed into AB glue until it became sticky. The fiber was then placed into the PAG, DAG or PNG powder in a tube, rotated and drawn out to dry. The prepared fibers were dried at 80 ℃ in an oven overnight, and further heated at 220 ℃ under a nitrogen atmosphere for 30 min to avoid any residual.
The different 3D-graphene coated fibers were assembled into a 5 μL microsyringe. The target analyte was conducted from different sample solutions in a 20 mL glass vial equipped with a PTFE-lined septum cap. During extraction, the SPME fiber was directly immersed into the sample solution and the stirring rate was controlled at 900 rpm. After extraction, the fiber was pulled out and immediately introduced into the GC injector for the thermal desorption and analysis. The sample preparation process was shown in the Supporting information (section 1.5).
The morphology of PAG was characterized by SEM. As shown in Fig. S1a (Supporting information), the PAG coating possessed a rough and homogeneous surface from the low magnification. The coating thickness was approximately 60 μm as indicated in Fig. S1b (Supporting information), and the coating was tightly adhered to the stainless-steel wire. Due to the same coating fabrication procedures and conditions, the similar morphology and thickness of DAG or PNG fiber could be found. The three fibers revealed a little different surface from that of the pure graphene due to the phytic acid-, dopamine-or o-phosphorylethanolamine-induced (Fig. S1c-f in Supporting information). The X-ray diffraction (XRD) pattern of the different-induced graphene illustrated a broad diffraction peak at approximately 25° (Fig. S2 in Supporting information), which was belonged to the (002) plane of stacked graphene sheets in the XRD pattern. These results were in accordance with the reports [17, 32].
In order to investigate the extraction ability toward nerolidol using the phytic acid-induced graphene coated fiber, two most commonly used commercial fibers (100 μm PDMS and 85 μm CAR/ PDMS) and the other two different-induced graphene coated fibers (DAG and PNG) were chosen for the comparison. As shown in Fig. 1, the extraction efficiency of PAG, DAG or PNG coatings towards nerolidol was 5.9, 4.3 and 1.2 folds higher than that using the commercial CAR/PDMS (85 μm) fiber. Obviously, PAG and DAG fibers exhibited outstanding extraction ability towards nerolidol comparing with those selected commercial fibers, while the PNG fiber showed slightly higher. The excellent extraction ability of PAG or DAG coated fiber may be attributed to the strong π-π stacking interactions between nerolidol and the highly delocalized π-electrons on the graphene surface. In addition to their specific structure as indicated by their SEM images (Fig. S1), the massive addition of phosphorus-containing or nitrogen-containing groups onto the PAG or DAG increase the dissolution of stationary liquid for the target compound, which presented superior extraction efficiency compared to the graphene coated fiber. Different induced graphene with substituent groups could effectively modulate the electronic characteristics, surface and local chemical features of graphene [33]. Thus, the modified graphene exhibits a high capacity for the adsorption of nerolidol. In the experiments, the results revealed that AB glue and the bare stainless steel did not obviously affect the extraction of nerolidol (Fig. S3 in Supporting information).

|
Download:
|
| Fig. 1. Comparison of extraction efficiency towards nerolidol using different fibers. Error bars show the standard deviation of the mean (n = 3). G: graphene; PAG: phytic acid-induced graphene; DAG: dopamine-induced graphene; PNG: o-phosphorylethanolamine-induced graphene. | |
In order to improve SPME efficiency, several experimental factors such as extraction time, extraction temperature, desorption time and temperature, pH and salt effect were systematically optimized. All experiments were carried out three times.
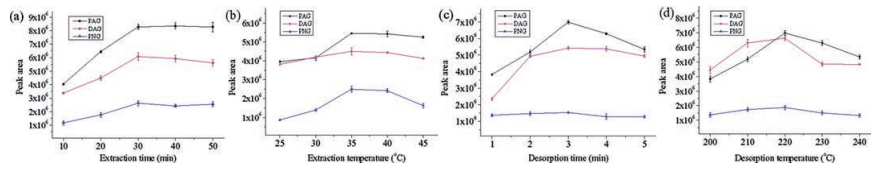
Extraction time is an important parameter in the extraction procedure based on the partition of the analytes between the sample matrix and the fiber coating. As shown in Fig. 2a, in the range of 10–30 min, the extraction capability increased for the longer extraction time. There was no significant change in the extraction efficiency even if the extraction time was over 30 min. It implied that the adsorption process reached equilibrium at 30 min. Thus, 30 min was selected as the optimum extraction time. Another key parameter, extraction temperature, was also considered in terms of kinetics and thermodynamics factors. As seen from Fig. 2b, the effect of extraction temperature was studied at the temperature ranging from 25 ℃ to 45 ℃. The results showed that the maximum response could be obtained when the extraction temperature was increased up to 35 ℃. Although the high extraction temperature benefits to accelerate the mass transfer of nerolidol, too high temperature was unsuitable for the exothermic adsorption. As a result, the extraction temperature of 35 ℃ was selected in the following research.

|
Download:
|
| Fig. 2. (a) The effect of extraction time on the extraction capability. (b) The effect of extraction temperature on extraction efficiency. (c) The effect of desorption time on peak areas. (d) The effect of desorption temperature on extraction efficiency. Concentration of nerolidol was 50 ng/mL. Error bars show the standard deviation of the mean (n = 3). | |
The desorption profiles including desorption time and temperature were optimized. As shown in Fig. 2c, the extraction efficiency was enhanced with desorption time up to 3 min, but then decreased after that. In order to find the suitable desorption temperature for the complete desorption of nerolidol from the fiber, the effect of desorption temperature was studied in the range of 200–240 ℃. The experiment result as shown in Fig. 2d indicated that the optimal temperature was 220 ℃. Thus, desorption conditions were selected at 220 ℃ for 3 min for the following experiments.
The influence of pH on the extraction of nerolidol was examined by adjusting the pH value (3-11) with appropriate HCl or NaOH solutions. As shown in Fig. S4a (Supporting information), the peak areas of nerolidol almost remained constant in both alkaline and acid solutions, implying the excellent stability of different induced graphene fiber in pH 3-11. The effect of ion strength on the extraction performance of nerolidol was studied by using NaCl in the range of 0-10% (w/v). Generally, ion strength can increase or decrease the extraction efficiency depending on the compound and salt concentration [34]. Fig. S4b (Supporting information) illustrated that the peak areas increased as NaCl concentration increased from 0 to 2% (w/v), and then decreased thereafter. Thus, 2% NaCl was recommended for the extraction of nerolidol.
To evaluate the analytical performance of the different induced graphene coatings, the parameters including limit of detection (LOD, based on S/N = 3), limit of quantification (LOQ, based on S/N = 10), linear dynamic range (LDR), correlation coefficients (R2) and reproducibility were investigated. The results were shown in Table S1 (Supporting information). For the PAG coated fiber, the linearity of the calibration curve was good in the range of 1– 1000 ng/g for nerolidol with a R2 of 0.9955. The LOD and the LOQ for nerolidol were found to be 0.18 ng/g and 0.59 ng/g, respectively. The relative standard deviations (RSDs) for single fiber repeatability and fiber to fiber reproducibility were less than 3.9% and 8.3%, respectively. Furthermore, the fiber could be used for more than 80 times without any evident damage of the coating (Fig. S5a and b in Supporting information).
To assess the method applicability, the detection recoveries of nerolidol were detected and calculated by extracting nerolidol from the spiked tea samples. As shown in Table 1, nerolidol was found in the tea samples ranging from 0.034 μg/g to 0.33 μg/g. Moreover, to evaluate the precision of this direct immersion-solid phase microextraction (DI-SPME) method, the relative recovery test was performed by the extractions from the spiked tea samples of 0.3 μg/g and 0.5 μg/g nerolidol. The acceptable recoveries for the spiked tea samples were in the range of 85.8%-108.7%, which illustrated the method was accurate and reliable. Typical SPMEGC-FID chromatograms of tea samples were shown in Fig. 3, Figs. S6A and B (Supporting information).
|
|
Table 1 Results for the analysis of the tea samples. |


|
Download:
|
| Fig. 3. Chromatograms of extraction nerolidol from (a) oolong tea sample and the internal standard (0.3 μg/g farnesol). (b) spiked oolong tea at 0.3 μg/g nerolidol. (c) spiked oolong tea at 0.5 μg/g nerolidol. | |
In this study, 3D phytic acid-induced graphene was used as a coating material for SPME fiber to extract nerolidol from tea samples. Compared with the commercial 100 μm PDMS or 85 μm CAR/PDMS fiber, the prepared fiber exhibited higher extraction efficiency, lower cost, more ease of fabrication and longer lifespan. Moreover, low LODs, wide linear ranges and acceptable recoveries of this DI-SPME method is applicable in the determination of nerolidol in tea samples.
AcknowledgmentsThis research is financially supported by Natural Science Foundation of Fujian Province (No. 2015J01058) and National Found for Fostering Talents of Basic Science (No. J1310024).
Appendix A. Supplementary dataSupplementary data associated with this article can be found, in the online version, at https://doi.org/10.1016/j.cclet.2017.10.008.
| [1] |
M. Zhou, Y.M. Zhai, S.J. Dong, Anal. Chem. 81(2009) 5603-5613. DOI:10.1021/ac900136z |
| [2] |
Z.S. Wu, G. Zhou, L.C. Yin, et al., Nano Energy 1(2012) 107-131. |
| [3] |
A.K. Geim, K.S. Novoselov, Nat. Mater. 6(2007) 183-191. DOI:10.1038/nmat1849 |
| [4] |
A.A. Balandin, S. Ghosh, W. Bao, et al., Nano Lett. 8(2008) 902-907. DOI:10.1021/nl0731872 |
| [5] |
X. Li, Y. Zhu, W. Cai, et al., Nano Lett. 9(2009) 4359-4363. DOI:10.1021/nl902623y |
| [6] |
V. Singh, D. Joung, L. Zhai, et al., Prog. Mater. Sci. 56(2011) 1178-1271. DOI:10.1016/j.pmatsci.2011.03.003 |
| [7] |
X. Liu, X. Zhou, C. Wang, Q. Wu, Z. Wang, Food Addit. Contam. Part A 32(2015) 40-47. DOI:10.1080/19440049.2014.983999 |
| [8] |
X.L. Liu, C. Wang, Q.H. Wu, Z. Wang, Chin. Chem. Lett. 25(2014) 1185-1189. DOI:10.1016/j.cclet.2014.03.030 |
| [9] |
M. Wang, Y.X. Xu, Chin. Chem. Lett. 27(2016) 1437-1444. DOI:10.1016/j.cclet.2016.06.048 |
| [10] |
S. Zhang, Z. Li, X. Yang, C. Wang, Z. Wang, RSC Adv. 5(2015) 54329-54337. DOI:10.1039/C5RA05616K |
| [11] |
S. Mahpishanian, H. Sereshti, J. Chromatogr. A 1443(2016) 43-53. DOI:10.1016/j.chroma.2016.03.046 |
| [12] |
H. Tabani, K. Khodaei, S.K. Movahed, et al., RSC Adv. 6(2016) 7198-7211. DOI:10.1039/C5RA21397E |
| [13] |
T.S. Sreeprasad, V. Berry, Small 9(2013) 341-350. DOI:10.1002/smll.201202196 |
| [14] |
H. Faghihian, S.N. Farsani, Pol. J. Chem. Technol. 15(2013) 1-6. |
| [15] |
V. Raboy, Trends Plant Sci. 6(2001) 458-462. DOI:10.1016/S1360-1385(01)02104-5 |
| [16] |
X.W. Cheng, J.P. Guan, G.Q. Chen, X.H. Yang, R.C. Tang, Polymers 8(2016) 122-140. DOI:10.3390/polym8040122 |
| [17] |
X. Song, Y. Chen, M. Rong, et al., Angew. Chem. Int. Ed. 55(2016) 3936-3941. DOI:10.1002/anie.201511064 |
| [18] |
W. Ji, M. Zhang, W. Duan, et al., Food Chem. 235(2017) 104-110. DOI:10.1016/j.foodchem.2017.05.054 |
| [19] |
H. Eivaz Mohammadloo, A.A. Sarabi, Prog. Org. Coat. 101(2016) 391-399. DOI:10.1016/j.porgcoat.2016.09.009 |
| [20] |
E. Graf, J.W. Eaton, Free Radical Bio. Med. 8(1990) 61-69. DOI:10.1016/0891-5849(90)90146-A |
| [21] |
C.L. Arthur, J. Pawliszyn, Anal. Chem. 62(1990) 2145-2148. DOI:10.1021/ac00218a019 |
| [22] |
G. Lang, G. Buchbauer, Flavour. Frag. J. 27(2012) 13-39. DOI:10.1002/ffj.v27.1 |
| [23] |
J. Koudou, A.A. Abena, P. Ngaissona, J.M. Bessière, Fitoterapia 76(2005) 700-703. DOI:10.1016/j.fitote.2005.06.004 |
| [24] |
A. Lapczynski, S.P. Bhatia, C.S. Letizia, A.M. Api, Food Chem. Toxicol. 46(2008) S247-S250. DOI:10.1016/j.fct.2008.06.063 |
| [25] |
M. Aqil, A. Ahad, Y. Sultana, A. Ali, Drug Discov. Today 12(2007) 1061-1067. DOI:10.1016/j.drudis.2007.09.001 |
| [26] |
Y. Inoue, A. Shiraishi, T. Hada, et al., Fems Microbiol. Lett. 237(2004) 325-331. |
| [27] |
F.C. Klopell, M. Lemos, J.P.B. Sousa, et al., Z. Naturforsch. C 62(2007) 537-542. |
| [28] |
M.P.N. Silva, G.L.S. Oliveira, R.B.F. de Carvalho, et al., Molecules 19(2014) 3793-3803. DOI:10.3390/molecules19033793 |
| [29] |
C. Ma, Y. Qu, Y. Zhang, et al., Food Chem. 152(2014) 285-290. DOI:10.1016/j.foodchem.2013.11.010 |
| [30] |
W.S. Hummers, R.E. Offeman, J. Am. Chem. Soc. 80(1958) 1339. DOI:10.1021/ja01539a017 |
| [31] |
H.A. Becerril, J. Mao, Z. Liu, et al., ACS Nano 2(2008) 463-470. DOI:10.1021/nn700375n |
| [32] |
X. Song, L. Lin, M. Rong, et al., Carbon 80(2014) 174-182. DOI:10.1016/j.carbon.2014.08.054 |
| [33] |
Y. Zhao, C. Hu, Y. Hu, et al., Angew. Chem. Int. Ed. 51(2012) 11371-11375. DOI:10.1002/anie.201206554 |
| [34] |
Y. Ke, F. Zhu, F. Zeng, et al., J. Chromatogr. A 1300(2013) 187-192. DOI:10.1016/j.chroma.2012.11.072 |