 2018, Vol. 29


b Key Laboratory of Environment and Health, Ministry of Education & Ministry of Environmental Protection, and State Key Laboratory of Environmental Health, School of Public Health, Tongji Medical College, Huazhong University of Science and Technology, Wuhan 430074, China;
c School of Life Sciences, Sun Yat-sen University, Guangzhou 510275, China
Bisphenols, a group of chemicals with two hydroxyphenyl moieties, have been used to make plastics and epoxy resins [1]. Benzophenones are chemical ultraviolet light absorbers. Parabens are a series of parahydroxybenzoates or esters of parahydroxybenzoic acid used as preservatives in personal care products, pharmaceuticals, food and beverages [2]. The compounds (Table S1 in Supporting information) are widely present in daily necessities and household products, including plastic food contact materials [3] and personal care products [4]. They are ubiquitous in the environment, and are thus detected in waste water, sewage sludge and other environmental samples [5, 6]. However, it has been reported that these chemicals have effects of endocrine disruption [7], reproductive toxicity [8] and genotoxicity [9], resulting in obesity [10], type 2 diabetes [11], breast cancer [12] and other diseases [13]. The endocrine disruption chemicals (EDCs) may also interfere with the normal hormone function in humans [14]. Urinary concentrations of several EDCs have been successfully used as biomarkers of internal exposure [15]. Therefore, it is important to develop a rapid and sensitive analytical method to evaluate the profiles of human exposure to the EDCs.
Several methods have been reported for the analysis of the EDCs, including high-performance liquid chromatography (HPLC) [16], gas chromatography-mass spectrometry [17] and capillary electrophoresis [18]. Mass spectrometry has been proved to be a powerful analytical tool for trace analysis [19-21]. Liquid chromatography-mass spectrometry (LC-MS) has been applied for the analysis of the EDCs in complex matrix due to its high sensitivity and specificity [22-24]. A method for simultaneous determination of thirteen endocrine disruptors including five phthalates, seven parabens and bisphenol A (BPA) in shower gels was developed by using ultra-high performance liquid chromatography coupled with a triple quadrupole mass spectrometer (UHPLC-TQ MS) [23]. In another study, eight bisphenols were determined in surface water samples by using LC-MS/MS [24]. Analytical methods for the EDCs in biomedical samples have also been reported [22, 25]. Urinary concentrations of six benzophenones, four parabens and BPA in the urine of 34 Tunisian women were determined [14]. The EDCs were detected in human serum by LC-MS [22, 26, 27]. However, only a few of them focused on simultaneous quantifying analyses of multiple EDC compounds in biomedical samples. Concerning the wide coexistence of EDCs, it is essential to develop a method, which can be applied in conduct exposure studies on human populations.
In this study, a method for the simultaneous determination of eighteen EDCs (six bisphenols, five benzophenones and seven parabens) in human urine was developed and validated. The method was applied for the analysis of urine samples collected from healthy volunteers
BPA, bisphenol S (BPS), bisphenol P (BPP), bisphenol Z (BPZ) and bisphenol AP (BPAP) were purchased from Sigma-Aldrich (St. Louis, U.S.A). Bisphenol B (BPB) was purchased from Tokyo Chemical Industry (Tokyo, Japan). 4-Hydroxybenzophenone (4-OH-BP), 2, 4-dihydroxybenzophenone (BP-1), 2, 2', 4, 4'-tetrahydroxy benzophenone (BP-2), 2-hydroxy-4-methoxybenzophenone (BP-3), 2, 2'-dihydroxy-4-methoxybenzo-bpenone (BP-8), paraben target analyte mix solution (10 μg/mL in acetone, analytical standard), containing methylparaben (MeP), ethylparaben (EtP), n-propylparaben (n-PrP), iso-PrP, n-butylparaben (n-BuP), iso-BuP, benzylparaben (BzP), were purchased from Sigma-Aldrich (St. Louis, U.S.A.).
Bisphenol-A-(diphenyl-13C12) (13C12-BPA, 99 atom% 13C) was purchased from Sigma-Aldrich. 13C12-BPS (13C12, 98%, 100 μg/mL in methanol) and 13C6-BP-3 were purchased from Cambridge Isotope Laboratories (Andover, MA, USA). Parabens internal standard mix solution (10 μg/mL in acetone, analytical standard), containing methylparaben-ring-13C6 (13C6 -MeP), ethylparaben-ring-13C6 (13C6 -EtP), n-propylparaben-ring-13C6 (13C6 -PrP) and n-butylparaben-ring-13C6 (13C6 -BuP), was purchased from Sigma-Aldrich.
β-Glucuronidase from Helix pomatia (Type H-2, aqueous solution, ≥85, 000 units/mL) was purchased from Sigma-Aldrich. Acetonitrile and methanol for the MS analysis were from VWR Chemicals (BDH PROLABO®, Fontenay-sous-Bois, France). All of the solvents were of HPLC grade unless otherwise specified. Pure water was prepared from Synergy® Water Purification System (Merck Millipore).
The standards were dissolved in methanol and diluted in acetonitrile/water (6/4, v/v). Mixed standards solution was prepared for method validation. The isotope-labeled standards, 13C12-BPA, 13C12-BPS, 13C6 -BP-3, 13C6 -MeP, 13C6 -EtP, 13C6 -PrP and 13C6 -BuP, were used as internal standards with the final concentrations of 20 ng/mL. All of the standard solutions were kept at -20 ℃ before use.
After thawing, 1 mL urine sample was placed into a tube; then incubated with 200 μL ammonium acetate (pH 5.0) and 10 μL β-glucuronidase, in a water bath at 37 ℃ overnight. The mixture was extracted for 3 times by adding 3 mL of solvent (methyl tert-butyl ether/ethyl acetate (5/1, v/v)) each time. The supernatants were combined into a glass vial and dried under a gentle nitrogen stream. The residue was re-dissolved with 200 μL of acetonitrile/water (6/4, v/v) and centrifuged at 13000 rpm for 10 min at 4 ℃. The supernatant was stored at-20 ℃ until LC-MS/ MS analysis.
Analyses were performed on an Ultimate 3000 UHPLC system (Dionex, Sunnyvale, CA, USA) coupled with a Thermo ScientificTM TSQ QuantivaTM Triple Quadrupole mass spectrometer (Thermo Scientific, San Jose, CA).
Thermo Scientific Betasil C18 column (2.1 mm × 100 mm, 3 μm) was used and kept at 30 ℃. Separation was performed by using a binary gradient mobile phase consisting of water (A) and acetonitrile (B). The elution program started with isocratic 25% B for 1.5 min, with linear gradient to 80% B until 10.0 min and then to 100% B until 10.2 min, isocratic 100% B until 12 min. Finally, back to 25% in 0.2 min and kept for 2.8 min to equilibrate the column. The flow rate was 0.3 mL/min and the injection volume was 5 μL.
Mass spectrometric analysis was performed in heated-electrospray ionization (H-ESI) negative ion mode. The parameters of mass detection were set as follows: spray voltage, 2600 V; sheath gas (N2) flow rate, 40 arbitrary units; auxiliary gas (N2) flow rate, 10 arbitrary units; Ion transfer tube temperature, 360 ℃; Vaporizer temperature, 350 ℃. Argon (99.999%) was used as collision gas. Dwell time for each compound was set at 25 ms. Multiple reaction monitoring (MRM) mode was used and the MS/ MS parameters were optimized individually for each compound by continuous infusion of 10 ng/mL standard solution in the acetonitrile/water (6/4, v/v) into the mass spectrometer. The selected ion transitions of the parent ion and their corresponding quantification ion for each chemical were shown in Table S2 (Supporting information).
The linearity of calibrations was obtained by plotting the peak area ratio (analyte/internal standard area responses) versus concentration. The calibration range of the method was tested at seven concentrations (0.5, 1, 2, 5, 10, 20, 50 ng/mL).
Precision, accuracy and matrix effect were evaluated for method validation according to Food and Drug Administration (FDA) guidelines [28]. Precision was determined by intra-and inter-day repetitions, respectively. Intra-day precision was assessed from the results of six replicates of the spiked samples measured on the same day. Inter-day precision was performed on six consecutive days. For accuracy tests, the mixed standards (in low, middle and high concentrations) and isotope-labeled standards (20 ng/mL in final concentration) were spiked to urine samples in triplicate and analyzed, respectively. Spiked samples were subjected to the same treatment as experimental samples. Accuracy was determined by calculating the difference between true and measured values.
The pure blank solutions (acetonitrile/water (6/4, v/v)) was injected before the first sample and every ten samples to monitor instrument background, and the procedural blank (method blank) was analyzed for monitoring the contamination during the sample preparation procedure. The procedural blank samples were prepared in the same way as samples, in which 1 mL urine sample was replaced with 1 mL Milli-Q water. Quality control (QC) samples were prepared by spiking the standards and internal standards (20 ng/mL in final concentration) to mixed urine to check for instrumental drift. The spiked urine samples were then treated according to the sample preparation procedure. QC samples were incorporated every ten samples.
The urine samples were collected from healthy women at the Wuhan Medical and Health Center, China. The study was approved by the ethics committees of Huazhong University of Science and Technology, with the consensus from the volunteers for urine donation. The samples were frozen at-80 ℃ until analysis. Human urine sample treatment and LC-MS/MS analysis were carried out according to the procedure described above.
Intensive [M–H]- ions of the EDCs (Fig. 1 and Table S1) were detected in H-ESI-MS negative ionization mode and selected as the precursor ions. The product ions were selected according to the fragmentation pathways [29]. The collision energy (CE) for each analyte and its corresponding stable isotope-labeled internal standard was optimized manually for all MRM transitions by injecting single standard solution (100 ng/mL) of each compound by the infusion pump. The optimized CE values and the retention times were summarized in Table S2. Other mass spectrometric parameters (including sheath gas, auxiliary gas, ion transfer tube temperature, vaporizer temperature) were optimized separately by using both a mixed standard solution and urine samples. Different C18 columns were tested under the same LC-MS conditions. The Betasil C18 column provided better peak shapes for the separation of the EDCs within 11 min. The MRM LC-MS/MS chromatograms of the mixed standards and the target analytes detected in a real human urine sample are shown in Fig. S1 (Supporting information) and Fig. 2 and the chromatograms of undetectable compounds in the urine sample (spiked of standards) are shown in Fig. S2 (Supporting information). The two pairs of structural isomers (n-PrP and iso-PrP as well as n-BuP and iso-BuP) could not be separated (Fig. S1), same as the previous studies [30]. Thus, the sums of the respective isomers were measured.

|
Download:
|
| Fig. 1. The structures of compounds (bisphenols, benzophenones and parabens). | |

|
Download:
|
| Fig. 2. LC-MS/MS chromatograms of a real human urine sample in MRM mode (a) bisphenols; (b) benzophenones; (c) parabens. | |
For the analysis of total form (free plus conjugated forms) concentrations of analytes, β-glucuronidase was added. The volume of β-glucuronidase was compared among 5 μL, 10 μL and 20 μL. The option 10 μL was chosen as it was enough for the enzymolysis of conjugate form to free form. Methyl tert-butyl ether/ethyl acetate (5/1, v/v) was chosen as the liquid-liquid extraction solvent [31].
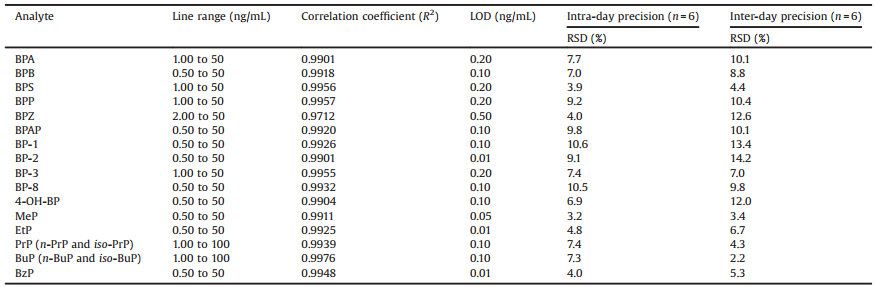
The limit of detection (LOD), defined as the concentrations producing a signal-to-noise (S/N) ratio equal to or more than 3 of each compound ranged from 0.01 to 0.5 ng/mL (Table 1). Calculation curves were made for each analyte in relative to its corresponding isotope-labeled internal standard or an isotopelabeled analog only if its isotope-labeled counterpart was unavailable (Table S2). The standard calculation curves for the analysis were fitted to a 1/x2 weighted linear regression model with to ensure maximum accuracy at the lower concentrations. The linear regression equations showed good linearity for the eighteen compounds (R2 > 0.99) and the linear ranges of each analyte were shown in Table 1.
|
|
Table 1 The LOD, line range of the calibration and precision results. |
The intra-and inter-day precision, expressed as the relative standard deviation (RSD), were determined in six replicates and the concentrations and RSD values of the intra-and inter-day precision data in urine samples are presented in Table 1. Intra-and inter-day precision were lower than 9.8% and 12.6% for bisphenols, 10.6% and 14.2% for benzophenones, 7.4% and 6.7% for parabens, respectively. The results (intra-and inter-day) were within acceptable variability limits (within 15%) [28].
In order to evaluate the trueness of the method, a study with spiked urine samples at three concentrations levels for each compound was performed. The accuracy was determined as the percentage of the concentrations calculated from calibration curve versus the theoretical concentrations of the analytes, respectively. The results of accuracy and RSD of all the target compounds were provided in Table S3 (Supporting information). According to FDA guidelines [28], the mean value should be within 15% of the actual value. In this study, the values of accuracy were in the range of 87.0% to 114.5% for bisphenols, 90.7% to 110.1% for benzophenones (except 4-OH-BP in low and high concentration) and 80.9% to 109.9% for parabens.
Matrix effect is one of the major problems affecting ESI efficiency, especially influenced by endogenous compounds from the matrix. The matrix effect was judged by comparing the relative peak area (analyte to its corresponding internal standard) in post-extracted spiked samples with that of the standards prepared in the pure solvent of less than 85% or more than 115% [32]. As shown in Table S3, most compounds showed no significant matrix effect for the targeted compounds, indicating that there was no obvious ion suppression or enhancement on these analytes. Since the stable isotope-labeled internal standards have similar structure and similar ionization suppression or enhancement, the use of multi-internal standard reduced relative matrix effect [33].
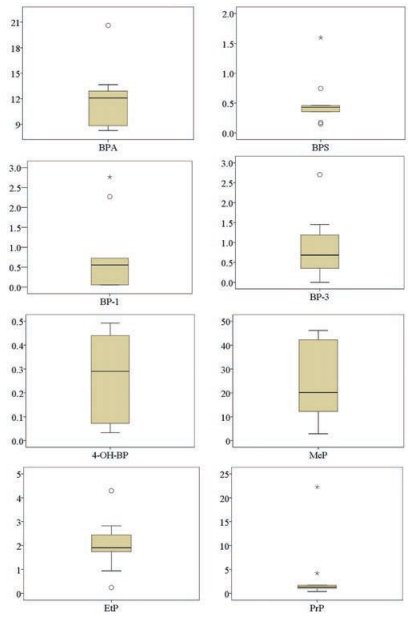
The comparison of the developed method and other methods is present in Table S4 (Supporting information). The method applicability was further validated with the analysis of real human urine samples collected from 9 volunteers. The analytical results are summarized in Fig. 3 and Table S5 (Supporting information). Eight compounds (BPA, BPS, BP-1, BP-3, 4-OH-BP, MeP, EtP and PrP) were detected in more than half of the samples. Interestingly, n-PrP was frequently detected (Fig. 2), while iso-PrP was only detected in a few samples, which is consistent with the results reported in previous studies [34]. The median concentrations of BPA (12.09 ng/mL), MeP (20.14 ng/mL), EtP (1.91 ng/mL) and PrP (1.34 ng/mL) were higher than those of the other targeted compounds. For the bisphenol analogs, the concentration ranges of BPA and BPS in the urine samples varied from 8.27 to 20.62 ng/mL and 0.15 to 1.60 ng/mL, respectively. The highest concentration of BP-3 in benzophenones group and MeP in the parabens were 2.70 ng/mL and 46.17 ng/mL, respectively.

|
Download:
|
| Fig. 3. Boxplots of the concentrations (ng/mL) of detected compounds (n = 9). For each substance, data is shown separately. Bottom and top of the box are the first (25th) and third quartiles (75th). The band inside the box shows the median (50th). The whiskers represent the 5th and the 95th percentile. The outliers values are represented by a "○" and the extreme outliers values are represented by an "*". | |
In conclusion, a LC-MS/MS method for the simultaneous quantification of eighteen EDCs in human urine samples was developed. This method was validated according to FDA guidelines in terms of sensitivity, linearity, precision, accuracy and matrix effect. The method was successfully applied to determine the EDCs in human urine samples. Eight of the targeted compounds were detected in more than 50% urine samples. With the expansion of the sample pool in the future study, this method may be applied for the investigation of EDCs exposure levels in a larger population, which may play a role in environmental evaluation, human health risk assessment and epidemiological study.
AcknowledgmentsThis work was supported by National Natural Science Foundation of China (Nos. 21505111, 21437002, 21507106) and the General Research Fund (Nos. 12301915, 12319716) from Research Grants Council of Hong Kong, China.
Appendix A. Supplementary dataSupplementary data associated with this article can be found, in the online version, at http://dx.doi.org/10.1016/j.cclet.2017.06.013.
| [1] |
A. Ponten, E. Zimerson, O. Sorensen, M. Bruze, Contact Dermat. 50(2004) 289-297. DOI:10.1111/cod.2004.50.issue-5 |
| [2] |
T. Tillett, Environ, Health Perspect. 120(2012) a437. |
| [3] |
J. Muncke, J. Steroid Biochem. Mol. Biol. 127(2011) 118-127. DOI:10.1016/j.jsbmb.2010.10.004 |
| [4] |
M. Rodas, L.A. Portugal, J. Avivar, et al., Talanta 143(2015) 254-262. DOI:10.1016/j.talanta.2015.04.055 |
| [5] |
F. Camino-Sánchez, A. Zafra-Gómez, N. Dorival-García, et al., Talanta 150(2016) 415-424. DOI:10.1016/j.talanta.2015.12.031 |
| [6] |
F. Tohidi, Z.W. Cai, Environ. Sci. Pollut. Res. 22(2015) 11387-11400. DOI:10.1007/s11356-015-4289-x |
| [7] |
K. Ji, S. Hong, Y. Kho, K. Choi, Environ. Sci. Technol. 47(2013) 8793-8800. DOI:10.1021/es400329t |
| [8] |
L.V. Laing, J. Viana, E.L. Dempster, M. Trznadel, et al., Epigenetics 11(2016) 526-538. DOI:10.1080/15592294.2016.1182272 |
| [9] |
S. Lee, X. Liu, S. Takeda, K. Choi, Chemosphere 93(2013) 434-440. DOI:10.1016/j.chemosphere.2013.05.029 |
| [10] |
J.M. Braun, Nat. Rev. Endocrinol. 13(2016) 161-173. |
| [11] |
C.C. Kuo, K. Moon, K.A. Thayer, A. Navas-Acien, Curr. Diab. Rep. 13(2013) 831-849. DOI:10.1007/s11892-013-0432-6 |
| [12] |
P. Deb, A. Bhan, I. Hussain, et al., Gene 590(2016) 234-243. DOI:10.1016/j.gene.2016.05.009 |
| [13] |
A. Zhou, H. Chang, W. Huo, et al., Pediatr. Res.(2017). DOI:10.1038/pr.2017.20 |
| [14] |
I. Jiménez-Díaz, F. Artacho-Cordón, F. Vela-Soria, et al., Sci. Total Environ. 562(2016) 81-88. DOI:10.1016/j.scitotenv.2016.03.203 |
| [15] |
X.Y. Ye, A.M. Bishop, J.A. Reidy, L.L. Needham, A.M. Calafat, Environ. Health Perspect. 114(2006) 1843-1846. |
| [16] |
C.A. Beasley, J. Shaw, Z. Zhao, R.A. Reed, J. Pharm. Biomed. Anal. 37(2005) 559-567. DOI:10.1016/j.jpba.2004.11.021 |
| [17] |
N. Morin, H.P.H. Arp, S.E. Hale, Environ. Sci. Technol. 49(2015) 7675-7683. DOI:10.1021/acs.est.5b01307 |
| [18] |
T. Ma, Z. Li, Q. Niu, Y. Li, W. Zhou, Electrophoresis 36(2015) 2530-2537. DOI:10.1002/elps.201500004 |
| [19] |
Y. Liu, X. H. Xun, J.M. Yi, Y. Xiang, J. Hua, Chin. Chem. Lett. 28(2017) 1093-1098. DOI:10.1016/j.cclet.2016.11.026 |
| [20] |
Y.L. Shi, Y.Y. Pan, L.N. Liang, Y.Q. Cai, Chin. Chem. Lett. 26(2015) 1073-1078. DOI:10.1016/j.cclet.2015.05.038 |
| [21] |
A. Naccarato, E. Gionfriddo, G. Sindona, A. Tagarelli, J. Chromatogr. A 1338(2014) 164-173. DOI:10.1016/j.chroma.2014.02.089 |
| [22] |
F. Vela-Soria, O. Ballesteros, A. Zafra-Gómez, L. Ballesteros, A. Navalón, Talanta 121(2014) 97-104. DOI:10.1016/j.talanta.2013.12.048 |
| [23] |
C. Esteve, L. Herrero, B. Gómara, J. Quintanilla-López, Talanta 146(2016) 326-334. DOI:10.1016/j.talanta.2015.08.064 |
| [24] |
E. Yamazaki, N. Yamashita, S. Taniyasu, et al., Ecotox. Environ. Safe 122(2015) 565-572. DOI:10.1016/j.ecoenv.2015.09.029 |
| [25] |
B.A. Rocha, B.R.B. da Costa, N.C.P. de Albuquerque, et al., Talanta 154(2016) 511-519. DOI:10.1016/j.talanta.2016.03.098 |
| [26] |
J.G. Teeguarden, N.C. Twaddle, M.I. Churchwell, et al., Toxicol. Appl. Pharmacol. 288(2015) 131-142. DOI:10.1016/j.taap.2015.01.009 |
| [27] |
E.J. Carrasco-Correa, F. Vela-Soria, O. Ballesteros, G. Ramis-Ramos, J.M. Herrero-Martinez, J. Chromatogr. A 1379(2015) 65-73. DOI:10.1016/j.chroma.2014.12.053 |
| [28] |
FDA, Guidance for industry: bioanalytical method validation, US Department of Health and Human Services, Food and Drug Administration, Center for Drug Evaluation and Research (CDER) Center for Veterinary Medicine (CV), 2001, pp. 1-19.
|
| [29] |
H. Zhao, L. Xiang, J. Li, et al., Rapid Commun. Mass Spectrom. 30(2016) 1901-1913. DOI:10.1002/rcm.7666 |
| [30] |
L. Schlittenbauer, B. Seiwert, T. Reemtsma, Anal. Bioanal. Chem. 408(2016) 1573-1583. DOI:10.1007/s00216-015-9265-2 |
| [31] |
T. Kunisue, Q. Wu, S. Tanabe, K.M. Aldous, K. Kannan, Anal. Methods 2(2010) 707-713. DOI:10.1039/b9ay00324j |
| [32] |
S. Yakkundi, H. Mulla, H. Pandya, M.A. Turner, J. McElnay, Bioanalysis 8(2016) 1173-1182. DOI:10.4155/bio-2016-0029 |
| [33] |
B. Matuszewski, J. Chromatogr. B 830(2006) 293-300. DOI:10.1016/j.jchromb.2005.11.009 |
| [34] |
R.K. Moos, H.M. Koch, J. Angerer, et al., Int. J. Hyg. Environ. Health 218(2015) 666-674. DOI:10.1016/j.ijheh.2015.07.005 |