 2017, Vol. 28


 ,
Tao Yangb,
Manshu Zhanga,
Renjie Liua,
Zhaohui Huanga,
Minghao Fanga,
Xiaowen Wua
,
Tao Yangb,
Manshu Zhanga,
Renjie Liua,
Zhaohui Huanga,
Minghao Fanga,
Xiaowen Wua
b College of Materials and Environmental Engineering, Hangzhou Dianzi University, Hangzhou 310036, China
As one of the crucial electrical energy storage facilities, lithiumion battery (LIB) attracts much attention due to its perfect property. Recently it has been used in many energy storage fields such as portable electronics and electric vehicles (EVs) [1-3]. However, the low capacity and energy density cannot meet the increasing LIB demands for electric vehicles and energy storage. The research of the anode materials with high power and capacity becomes one of the most important topics in this field [3]. Silicon has been one of the most potential anode materials owing to its high theoretical capacity of 4200 mAh/g by forming the alloy of Li22Si5 [4, 5], almost 10 times higher than that of commercial graphite anode (372 mAh/g) [6-9]. It also has advantages of availablity, abundance and environmental friendliness.
However, the huge volumetric change (about 300%) during lithiation/delithiation process can generate tremendous mechanical stress, which leads to the unstable solid electrolyte interphase (SEI) formation, electrode pulverization, loss of electrical contact and the subsequently fast capacity decay [3, 6]. Its poor intrinsic electrical conductivity also results in poor rate performance [10-13], hindering its industry applications.
Many studies have been focused on addressing these drawbacks of Si based materials in the past decade. One strategy is to design and fabricate nanostructured Si, such as nanoparticles, nanowires, nanotubes, thin films and porous silicon [14-20]. Nanostructured Si has high damage tolerance property and can provide short Li+ diffusion channel during battery cycling. Another strategy is to prepare conductive materials-coated nanostructure Si, such as carbon-based material, metals and conductive polymers, in order to alleviate the mechanical stress induced by the large volume change and increase electrical conductivities [9, 21-22].
Herein, a novel porous Si/C composite was first fabricated utilizing molecular sieve as silica source through magnesiothermic reduction method and subsequent carbonization. The magnesiothermic reduction has been demonstrated to be a useful way to prepare the Si materials from the precursor SiO2 [10, 23-25]. Its physic properties were characterized by X-ray diffraction (XRD), scanning electron microscope (SEM), Raman, thermogravimetry (TG) and Brunauer-Emmett-Teller (BET), and its electrochemical performance was investigated. The as-prepared porous structure of Si material can not only provide a high surface area which can enhance the kinetics of Li+ insertion/extraction, but also supply abundant inner interspace, alleviating the volume expanding during battery cycling [10].
Before the magnesiothermic reduction, the molecular sieve type 4 Å was grinded to powder, magnesium powder (1.457 g, 100-200 mesh, Sinopharm Chemical) and molecular sieve powder (10 g, Sigma) were mixed uniformity with molar ratio of 1:1. The above mixture was calcined at 600 ℃ for 2 h with heating rate of 5 ℃/min at Ar atmosphere, and then heated up to 900 ℃ for 2 h. The precursor was achieved after cooling down to the room temperature. During the magnesiothermic reduction, there are some side reactions happened, and a few side productions occurred in the precursor. To remove the Mg2Si and Mg2SiO4, the result product was immersed in 10 wt% HCl for 5 h. After the purification, it was immersed in 5 wt% HF for 5 h to remove the remaining SiO2.
In order to increase the conductivity of the result product, the carbon coated porous Si particles were synthesized by using the pitch as the resource. The mixture of porous Si (10 g) and the pitch (8%, 0.8 g) were put into the quartz tube and sintered at 300 ℃ for 2 h with the heating rate of 5 ℃/min. Then the temperature goes up to 900 ℃ for 2 h. All the process is at the Ar atmosphere. Finally, the as-prepared carbon-coated porous Si (Si@C) was fabricated.
The working electrode slurry is made up of the porous Si active materials, carbon black and sodium alga acid, and the gravimetric ratio is 13:4:3. Then the slurry was spread on the copper (Cu) foil, which is served as a current collector. After drying at 80 ℃ for 12 h, the copper foil was tailored to be the working electrode. The cell was then assembled using the CR2032-type coin cells. The counter electrode is pure Li. The electrolyte consisted of 1 mol/L LiPF6 in a non-aqueous solution of ethylene carbonate/dimethyl carbonate (EC/DMC, 1:1 by volume) with 10 wt% fluoroethylene carbonate (FEC). The separator is Celgard 2400 microporous membrane. All the assembled process is conducted in an Ar-filled glove box with concentrations of moisture and oxygen below 0.01 ppm.
XRD measurements was used to observe the crystallographic structures, which was carried out on an X-ray powder diffractometer (D/max-ⅢA, Rigaku, Japan) with a stepwise scanning mode over the 2θ range 10°-80° using Cu Kα radiation (1.5406 Å) with operating voltage 40 kV and current 100 mA. The morphology of the particles were examined by SEM (Merlin VP Compact) operated at 15 kV. The micro-structures of the particles were observed by a transmission electron microscopy (TEM, Hitachi HT-7700) using HR-TEM and STEM modes. X-ray photoelectron spectroscopy (XPS) measurements were collected with a Kratos Axis Ultra DLD, employing MCP stack & delay-line photoelectron detector with scanned & snapshot spectroscopymodes. TGA (Perkin-Elmer, Pyris 1) was conducted at air atmosphere from room temperature to 900 ℃ at 5 ℃/min. Nitrogen absorption-desorption isotherms and Barrett-Joyner-Halenda (BJH) pore size distribution of the porous Si particles were conducted by a Quadrasorb SI-MP automated surface area & pore size analyzer. Roman spectra were operated by a micro-Roman spectrometer (inVia-Reflex) using 638 nm excitation wavelength at room temperature. The galvanostatically cycling test was carried out at room temperature on a multichannel cell tester (LANHE, CT2001A system). Cyclic voltammetry (CV) test was conducted using a CHI604E electrochemical workstation at a scan rate of 0.2 mV/s with a voltage range of 0.01-3.0 V (vs. Li/Li+) at room temperature (25 ℃).
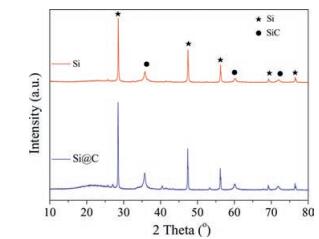
Fig. 1 shows the XRD patterns of the porous Si and Si@C, respectively. The Si phase is indexed to a single face-centered cubic crystal structure (JCPDS Card File 75-589). The characteristic peaks of SiC is also found in the XRD patterns, which is indexed to the cubic phase as exhibited in Fig. 1 (JCPDS No. 73-1665). Actually, the phase of SiC is originated from the raw materials (molecular sieve) rather than in the magnesiothermic reduction process. Compared with the porous Si, the slight diffraction peak of amorphous carbon can be discovered around 20° in the XRD patterns of Si@C. The carbon layer can increase the electrical conductivity and promote the cycling performance of Si anode. The XRD data calculation of the Si@C indicates that the content of Si accounted for 65% and the weight of SiC take possession of 30%. The rest, which represent 5% of the whole sample, is carbon layer. Considering the existence of the pristine SiC, the efficiency of the magnesiothermic reduction is relatively high.

|
Download:
|
| Fig. 1. XRD patterns of porous Si and Si@C. | |
Fig. 2a displays the Raman spectra for Si@C sample. Three peaks at 293 cm-1, 511 cm-1, 934 cm-1 are all assigned to crystalline Si. The strong and sharp peak around 511 cm-1 are corresponded to the first order optical phonon mode of crystalline Si, and the small peak around 293 cm-1 and 934 cm-1 corresponds to the amorphous Si component [3, 6, 26, 27]. Another two peaks appeared at 1348 cm-1, 1590 cm-1 are assigned to the D (disordered) and G (graphite) bands of carbon, respectively [26, 27], and the peakheight ratio of G band to D band is about 1.14. This agrees well with the previous reports [6, 26, 27]. The graphitic carbon layer coating on the porous Si can enhance the electrochemical performances and strengthen the electronic conductivity. The weight of Si and C layer in the Si@C compound was measured by TGA as shown in Fig. 2b. The weight loss before 200 ℃ is attributed to the evaporation of the absorbed water and crystal water. The weight loss from 200 ℃ to 800 ℃ is about 4%, which can be assigned to the oxidation of Si and the decomposition of C layer in the air. According to the XRD analysis result, the ratio of carbon layer should be 5%, however, Si will be oxidized to form SiOx under air. As a consequence, the final weight loss is less than 5%. The specific surface and main pore distribution of the Si@C were tested by the Brunauer-Emmett-Teller (BET) method (shown in Fig. 2c, d). The hysteresis loops of the nitrogen adsorption-desorption isotherms in Fig. 2c indicates the existence of mesoporous structure. The specific surface area of Si@C is 77.114 m2/g and the pore volume is 0.381 m3/g. The high surface area can increase the contact between Si and Li+, resulting in the high coulombic efficiency. The porous structure can provide channels for Li+, and the pore volume can alleviate the volume change during the lithium-ion intercalation/deintercalation [28]. The pore size distribution curve (Fig. 2d) indicated the pore diameter is mainly concentrated in 3.733 nm. Above all, the specific surface area, pore volume and pore diameter can reduce the huge volume change during the cycling process and increase the coulombic efficiency.

|
Download:
|
| Fig. 2. (a) Raman spectrum of Si@C; (b) Thermal gravimetric analysis of Si@C; (c) Nitrogen adsorption-desorption isotherms and (d) Barrett-Joyner-Halenda (BJH) pore size distribution of the Si@C. | |
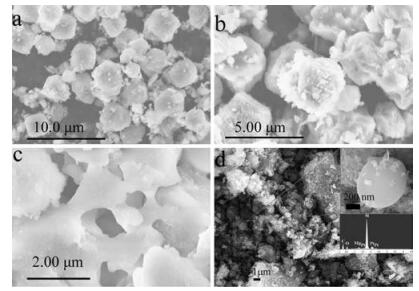
The morphologies of the samples were measured by SEM. Fig. 3a shows the SEM images of molecular sieve. The particle size is about 3 μm, and the initial morphology remains after the magnesiothermic reduction (Fig. 3b). The pore size of the porous Si is about 0.5-1 μm, as shown in Fig. 3c. However, the final Si@C particles after carbon-coating procedure have different sizes, and the size of these Si/C particles is less than 1 μm (Fig. 3d), indicating the pore structure of porous Si collapsed during the carbon-coating process, and then the porous Si dismembered to small particle size responsible for the size change, and the Si@C particles still remained the mesoporous structure as shown in Fig. 2c, d. The insert in Fig. 3d is the single particle and the homologous EDS spectrum, which indicates the uniform rounded particle is the porous Si.

|
Download:
|
| Fig. 3. SEM images of the sample: (a) molecular sieve, (b) porous Si, (c) the pore structure of the porous Si, (d) porous Si@C, and the insert is the local magnify image and the EDS spectrum of the single particle. | |
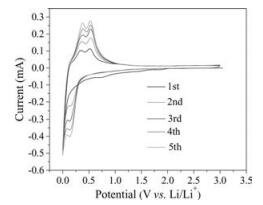
Fig. 4 shows the cyclic voltammetry (CV) curves of the Si@C at a scanning rate of 0.1 mV/s over the potential range of 0.01-3.0 V. A small cathodic peak at 0.75 V in the discharge process is corresponded to the decomposition of the electrolyte and the formation of SEI film on the surface of the Si particles, and the small peak disappeared in the subsequent cycles. After the first cycle, the broad cathodic peak around at 0.13 V is assigned to the formation of amorphous LixSi (Li+ alloying) according to the previous reports [3, 10], and the sharp peak on the verge of the cut-off potential is due to the lithiation of the carbon layer and Si particles. While the other two distinct anodic peaks at 0.36 V and 0.53 V in the charge process (Li+ dealloying) is ascribed to the phase change from amorphous LixSi to amorphous Si [10]. The increase in the peak intensities with unchanged positions for the subsequent cycles indicates the graduate activation of anode, which means the kinetic enhancement of the electrode [29-32].

|
Download:
|
| Fig. 4. The cyclic voltammetry (CV) curves of Si@C electrode at a scanning rate of 0.1 mV/s over the potential range of 0.01–3.0 V (vs. Li+/Li.). | |
Fig. 5 demonstrates the electrochemical performance of the porous Si@C electrodes. Fig. 5a presents the galvanostatic chargedischarge curves of the porous Si@C measured in the voltage window of 0.0-3.0 V at 0.1 A/g. The initial discharge and charge capacity is 2018.5 mAh/g and 1551.8 mAh/g, respectively, with the coulombic efficiency (CE) of 76.88%. The formation of the SEI film on the surface of the Si particles is mainly answerable to the irreversible capacity. After 100 cycles, the discharge/charge capacity still stabilized at 1005 mAh/g and 996.6 mAh/g, respectively. The initial discharge/charge capacity is 1848.6 mAh/g and 1411.5 mAh/g when the current density increased to 0.2 A/g (shown in Fig. 5b). The homologous coulombic efficiency is 76.36%. After 100 cycles, the capacity retention rate is 50.13%, the reversible capacity is 915 mAh/g. Fig. 5c displays the cycling stability and CE of porous Si@C electrode both at 0.1 mA/g and 0.2 mA/g. After 100 cycles, the reversible capacity remains at 900 mAh/g, with initial CE of 76%, and the CE of the subsequent cycles remains higher values close to 100%. Fig. 5d reveals the rate performances of the porous Si@C electrode. The initial distinct capacity damping is assigned to the formation of the SEI film. Then it illustrates better discharge/charge specific capacity of 1493.1/ 1425.7 mAh/g, and the CE of the subsequent cycles is close to 100%. Even at higher rate of 2 A/g, it still keeps higher specific capacity of 640.3 mAh/g with coulombic efficiency of 99.11%. After higher rate testing of 2 A/g, the specific capacity can return back to 1234.0 mAh/g with CE of 98.32% at 0.1 A/g, and after 20 cycles the specific capacity can stabilize at 900 mAh/g, presenting good cycling stability and rate performances. Actually, the SiC phase acts as a buffer matrix that can stabilize the nanostructure of the Si active phase and enhance the electrical conductivity of the electrode. With the existence of the SiC, the concentration of the active silicon was decreased, which can slow down the reaction with the lithium-ions and reduce the drastic capacity fading [33-35].

|
Download:
|
| Fig. 5. Discharge-charge profiles of the porous Si@C electrode measured at 0.1 A/g (a) and 0.2 A/g (b); cycling stability (c) and rate performance (d) of the porous Si@C anode. | |
Fig. 6 shows the electrochemical impedance spectroscopy (EIS) measured in the half-batteries before cycling and after five cycles. A semicircle and a sloped line were observed for both two spectra [36-38]. The impedance of the Si@C increased after the first cycle, and the original arc divided into two apparent arcs, which is correspound to the formation of thick solid-electrolyte interface (SEI). The following sloped line at low frequency is due to the Li+ diffusion impedance.

|
Download:
|
| Fig. 6. EIS of Si@C anode in half-battery after different cycles. | |
The porous Si material was synthesized through the magnesiothermic reduction using the molecular sieve as Si source. Although there are parts of SiC produced in the as-formed porous Si material during the carbon coating process, the material still presents good electrochemical performance. The porous Si@C electrode shows a high initial reversible specific capacity of 2018.5 mAh/g and a relative high coulombic efficiency of ca. 100% at the first cycle. The specific capacity still remains at 640.3 mAh/g after 20 cycles at a high current density of 2 A/g. The good electrochemical performance can be mainly attributed to the porous structure of the material, which is originated from the molecular sieve. The special pore structure can provide additional buffer space for the volume expansion during the lithiation/ delithiation process, and also shorten the ionic diffusion distance. All these findings provide a new method to produce porous Si material as high-performance anode materials for rechargeable lithium-ion battery.
AcknowledgmentThis work was supported by "the Fundamental Research Funds for the Central Universities" (Nos. 53200859564 and 53200859035).
| [1] |
M. Armand, J.M. Tarascon, Nature 451(2008) 652-657. DOI:10.1038/451652a |
| [2] |
J.B. Goodenough, Y. Kim, Chem. Mater. 22(2010) 587-603. DOI:10.1021/cm901452z |
| [3] |
J. Li, J. Wang, J. Yang, et al., J. Alloys Compd. 688(2016) 1072-1079. DOI:10.1016/j.jallcom.2016.07.148 |
| [4] |
W. Yao, J. Chen, L. Zhan, et al., ACS Appl. Mat. Interfaces 9(2017) 39371-39379. DOI:10.1021/acsami.7b11721 |
| [5] |
J. Liu, P. Kopold, Van Aken P.A., et al., Angew. Chem. Int. Ed. 127(2015) 9768-9772. DOI:10.1002/ange.v127.33 |
| [6] |
X. Lai, J.E. Halpert, D. Wang, Energy Environ. Sci. 5(2012) 5604-5618. DOI:10.1039/C1EE02426D |
| [7] |
W. Xu, S.S.S. Vegunta, J.C. Flake, J. Power Sources 196(2011) 8583-8589. DOI:10.1016/j.jpowsour.2011.05.059 |
| [8] |
H. Sohn, H.K. Dong, R. Yi, et al., J. Power Sources 334(2016) 128-136. DOI:10.1016/j.jpowsour.2016.09.096 |
| [9] |
S.H. Baek, J.S. Park, Y.M. Jeong, et al., J. Alloys Compd. 660(2016) 387-391. DOI:10.1016/j.jallcom.2015.11.131 |
| [10] |
X. Liu, R. Miao, J. Yang, et al., Energy Technol. 4(2016) 593-599. DOI:10.1002/ente.v4.5 |
| [11] |
C.K. Chan, R. Ruffo, S.S. Hong, et al., J. Power Sources 189(2009) 1132-1140. DOI:10.1016/j.jpowsour.2009.01.007 |
| [12] |
J. Deng, H. Ji, C. Yan, et al., Angew. Chem. Int. Ed. 52(2013) 2326. DOI:10.1002/anie.201208357 |
| [13] |
L. Zhang, J. Deng, L. Liu, et al., Adv. Mater. 26(2014) 4527-4532. DOI:10.1002/adma.v26.26 |
| [14] |
B. Wang, X. Li, T. Qiu, et al., Nano Lett. 13(2013) 5578-5584. DOI:10.1021/nl403231v |
| [15] |
H. Kim, M. Seo, M.H. Park, et al., Angew. Chem. Int. Ed. 49(2010) 2146-2149. DOI:10.1002/anie.v49:12 |
| [16] |
H. Wu, G. Chan, J.W. Choi, et al., Nat. Nanotechnol. 7(2012) 310. DOI:10.1038/nnano.2012.35 |
| [17] |
K. Karki, Y. Zhu, Y. Liu, et al., ACS Nano 7(2013) 8295-8302. DOI:10.1021/nn403895h |
| [18] |
P.R. Abel, Y.M. Lin, H. Celio, et al., ACS Nano 6(2012) 2506-2516. DOI:10.1021/nn204896n |
| [19] |
J. Liu, P. Kopold, Van Aken P.A., et al., Angew. Chem. Int. Ed. 54(2015) 9632-9636. DOI:10.1002/anie.v54.33 |
| [20] |
Q. Lv, L. Yuan, T. Ma, et al., ACS Appl. Mat. Interfaces 7(2015) 23501-23506. DOI:10.1021/acsami.5b05970 |
| [21] |
Y. Yao, N. Liu, M.T. Mcdowell, et al., Energy Environ. Sci. 5(2012) 7927-7930. DOI:10.1039/c2ee21437g |
| [22] |
H. Chen, J. Xu, P.C. Chen, et al., ACS Nano 5(2011) 8383-8390. DOI:10.1021/nn203166w |
| [23] |
J. Ahn, H.S. Kim, J. Pyo, et al., Chem. Mater. 28(2016) 1526-1536. DOI:10.1021/acs.chemmater.5b05037 |
| [24] |
M.P. Liu, C.H. Li, H.B. Du, et al., Chem. Commun. 48(2012) 4950-4952. DOI:10.1039/c2cc17083c |
| [25] |
Z. Bao, M.R. Weatherspoon, S. Shian, et al., Nature 446(2007) 172-175. DOI:10.1038/nature05570 |
| [26] |
L. Wu, X. Ma, M. Chen, Chemelectrochem 4(2017) 1463-1469. DOI:10.1002/celc.201700173 |
| [27] |
J. Su, J. Zhao, L. Li, et al., ACS Appl. Mat. Interfaces 9(2017) 17807-17813. DOI:10.1021/acsami.6b16644 |
| [28] |
T. Yang, Y.G. Liu, Z.H. Huang, et al., J. Alloys Compd. 735(2017) 1079-1087. |
| [29] |
X. Zhou, L. Wu, J. Yang, et al., J. Power Sources 324(2016) 33-40. DOI:10.1016/j.jpowsour.2016.05.058 |
| [30] |
F. Ling, B.P. Williams, H.Y. Sang, et al., ACS Appl. Mat. Interfaces 8(2016) 5243. DOI:10.1021/acsami.5b10548 |
| [31] |
L. Wei, Y. Wang, L. Wang, et al., ACS Nano 10(2016) 10524-10532. DOI:10.1021/acsnano.6b06517 |
| [32] |
J. Chang, X. Huang, G. Zhou, et al., Adv. Mater. 26(2014) 758-764. DOI:10.1002/adma.201302757 |
| [33] |
B.J. Jeon, J.K. Lee, J. Alloys Compd. 590(2014) 254-259. DOI:10.1016/j.jallcom.2013.12.122 |
| [34] |
D.T. Ngo, H. Le, X.M. Pham, et al., ACS Appl. Mat. Interfaces 9(2017) 32790-32800. DOI:10.1021/acsami.7b10658 |
| [35] |
X. Wang, Z. Wen, Y. Liu, Electrochim. Acta 56(2011) 1512-1517. DOI:10.1016/j.electacta.2010.10.020 |
| [36] |
X.H. Liu, L. Zhong, S. Huang, et al., ACS Nano 6(2012) 1522-1531. DOI:10.1021/nn204476h |
| [37] |
R. Yi, F. Dai, M.L. Gordin, et al., Adv. Energy Mater. 3(2013) 273-273. DOI:10.1002/aenm.v3.3 |
| [38] |
J. Song, S. Chen, M. Zhou, et al., J. Mater. Chem. A 2(2013) 1257-1262. |