 2017, Vol. 28


As the environmental pollution increasing and the fossil energy crisis growing, the demands for clean energy and the corresponding energy storage devices are higher than ever before. Due to the short-charging time, high power density and long cycle life, supercapacitors are used in the hybrid electric vehicles, mobile electronic equipment and other fields [1, 2]. Supercapacitors are divided into two types according to the energy storage mechanism: electrical double-layer capacitors (EDLCs) and pseudocapacitors [3, 4]. Carbon materials are regarded as the most widely used materials for EDLCs, and numerous reports have been published to promote the electrode performance of carbon materials in supercapacitors [5, 6]. Graphene has attracted much attention in the field of supercapacitors due to its large surface area, porous structure, excellent electrical conductivity and stable mechanical properties [7-11]. In order to avoid restacking of neighboring graphene layers, nanomesh graphene (NMG) with a pillarsupported structure and large surface wrinkles obtained via a MgO-templated chemical vapor deposition (CVD) have been demonstrated as a high performance electrode material for EDLCs, as reported in our previous publication [12].
Compared to the EDLCs, the pseudocapacitors exhibit much higher specific capacitance [13] but suffer from the worse stability of the electrode material (such as metal oxides) [14]. Introduction of heteroatoms (such as N, B, S and P) in the carbon network is capable of enhancing the conductivity of the material, improving the hydrophilic properties between the electrode and the electrolyte, and producing a reversible pseudo-capacitance [15, 16]. Our recent work has shown that the S doping is more efficient to improve the conductivity of carbons as compared to the N doping [17]. As a result, the S-doped carbons can exhibits superior capacitor performance [17, 18].
S-doped carbon materials have been synthesized by many different methods using various S-containing compounds as S source [19-21]. For example, Yang et al. [19] synthesized sulfurdoped graphene by directly annealing graphene oxide and benzyl disulfide in argon. Our group [17, 22] has prepared a S-doped porous carbon with a sulfur content up to 29.4 wt% using MgSO4 as S source. Here, we report a novel approach to synthesis of S-decorated NMG (S@G) by a simple mechanical mix of NMG and elemental sulfur. Covalent bonding of S atoms via oxygen bridges has been formed in the S@G materials after a 155 ℃ heat treatment, leading to a better stability of S species and higher conductivity for the S@G bulk materials. As a result, the S@G materials exhibit high electrochemical performance. Our results indicate that the S-decorated carbon materials are promising electrode materials for supercapacitors.
NMG was synthesized by a CVD method using CH4 as carbon source and porous MgO sheets as template (see Supporting information for details) [12]. To prepare the S-decorated NMG, NMG was mixed with elemental S. The mass fractions of S were 2%, 5% and 10% for S@G2, S@G5 and S@G10, respectively. Then 100 mL ethanol was added to the mixture to obtain a slurry. The slurry was magnetically stirred at room temperature until the ethanol evaporation. The obtained black powder was placed in a sealed vessel at 155 ℃ for 8 h. The scanning electron microscopy (SEM) and transmission electron microscopy (TEM) images of the S-decorated NMG with a S content of 5 wt% (S@G5) are shown in Fig. 1. S@G5 has a distinct crumpled structure, similar with the original NMG (Fig. S1 in Supporting information). In a wide view field of TEM observation (Figs. 1b-d), a porous and nearly transparent structure is observed for S@G5. The corrugations in NMG are in favor of avoiding agglomeration of graphene sheets, thus maintaining a porous morphology with a high surface area. No S particles are observed, showing an even distribution of S on the NMG surface. S@G2 and S@G10 have similar morphologies without observation of S particles (Figs. S2 and S3 in Supporting information).

|
Download:
|
| Fig. 1. SEM (a) and TEM (b–d) images of S@G5. | |
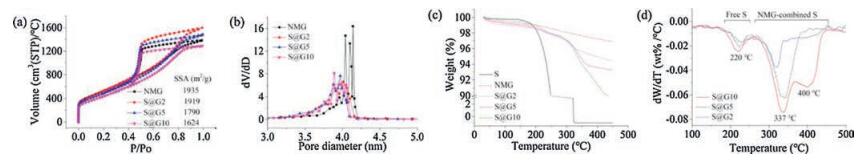
N2 adsorption-desorption isotherms of all the samples are shown in Fig. 2a, which exhibit the type Ⅳ isotherms. When the relative pressures are within the scope of 0.4-1, significant hysteresis loops are present in the curves, indicating the present of mesopores [23]. It implies that S did not block the mesopores in the S@G materials due to the limited S content. The pore size distributions for the S@G materials (Fig. 2b) slightly downshift as compared to that for the NMG. The specific surface areas (SSAs) of the as-obtained NMG, S@G2, S@G5 and S@G10 are 1934.7, 1919.1, 1790.3 and 1623.9 m2/g, respectively. The decreases in both pore size and SSA indicate that S has entered the mesopores of the NMG during the heating of the S and NMG mixture.

|
Download:
|
| Fig. 2. (a) Nitrogen sorption isotherms and (b) pore size distributions of NMG, S@G2, S@G5 and S@G10. (c) TG and (d) derivative TG curves tested with a N2 flow. | |
Fig. 2c shows the thermal gravimetry (TG) curves of sulfur, NMG, S@G2, S@G5 and S@G10 in a N2 flow, providing a valuable clue to understanding the interaction between S and NMG. In the TG curve of elemental S, only one weight loss step starting from 200 ℃, corresponding to the sublimation of elemental S, is observed. In the derivative TG curves of the S@G samples (Fig. 2d), the peaks centered at 220 ℃ correspond to the sublimation of free elemental S, and the peaks at 337 ℃ correspond to the chemically-bonded surface S (also see the below X-ray photoelectron spectroscopy (XPS) results). For S@G10, the weight loss peak around 400 ℃ might attributed to the release of pore-confined chemical-bonded S, because the S content in S@G10 is high enough to increase the diffusion resistance for S getting away. Based on the TG curve, it is determined that 15 wt% of the S atoms in S@G10 are free S and 85 wt % are NMG-combined S.
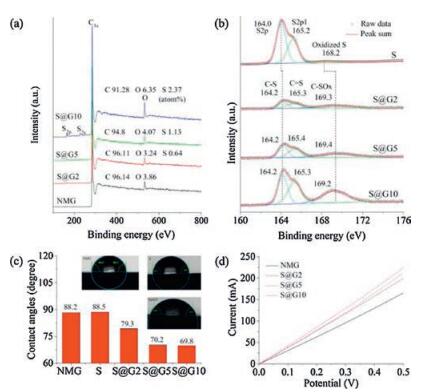
XPS analysis shows that the S concentration is 0.64 atom% (1.67 wt%) for S@G2, 1.13 atom% (2.92 wt%) for S@G5 and 2.37 atom% (5.96 wt%) for S@G10 (Fig. 3a). In the typical S2p pattern of elemental S (Fig. 3b), the peaks at 164.0 eV and 165.2 eV correspond to the 2p and 2p1 electron orbits of elemental S, and the weak peak at 168.2 eV corresponds to the oxidized S similar to SOx (168.1 eV). In the S2p patterns of the S@G samples (Fig. 3b), the three peaks appear at 164.2, 165.3-165.4 and 169.2-169.4 eV, showing obvious upshifts as compared to the peaks for elemental S. The peaks at 169.2-169.4 eV should be attributed to the S atoms in C-SOx (x=2-4) groups. More than 30% S atoms in the S@G samples connect with carbon frameworks via the C-SOx covalent bonds (Table S1 in Supporting information), much higher than that for elemental S (3%), implying that many S atoms have been chemically bonded with NMG with the aid of oxygen at the low temperature of 155 ℃. Considering the TG data and our previous XPS analysis of S-doped carbons [17, 24], the peaks at 164.2 and 165.3-165.4eV for the S@G samples are ascribed to the S atoms with covalent bonds of S—C and S=C, respectively. The XPS analysis reveals that most of the S atoms in the S@G samples are chemically bonded with carbon frameworks via a low temperature reaction at 155 ℃, well consistent with the TG analysis.

|
Download:
|
| Fig. 3. (a) XPS survey curves and (b) S2p patterns of the as-prepared S@G samples. (c) Contact angles of a water droplet on NMG, S, S@G2, S@G5 and S@G10. The inset of c shows the photos of contact angle tests. (d) Ⅰ–Ⅴ curves of the samples. | |
The chemically bonding of S atoms has led to great changes in the surface property and conductivity of the S@G materials. Contact angle tests were carried out for all the samples. As shown in Fig. 3c, the contact angles for the S@G samples are smaller than the values for NMG and S, showing better hydrophility for the S@G samples. The improved hydrophility is owing to the hydrophilic C-SOx (x=2-4) groups formed on the surface of NMG, as indicated by the XPS analysis. Ⅰ-Ⅴ curves of the samples are shown in Fig. 3d. The conductivities of the S@G samples are obviously higher than that of NMG. Theoretical calculation has indicated that the sulfurdoped graphene exhibits semiconducting properties at low sulfur doping levels (2 atom%) and exhibits better metallic properties at higher sulfur concentration (4 atom%) [25]. In a real system, when the S concentration is less than 2 atom%, the S-doped graphene can also exhibit enhanced conductivity, because S atoms distribute unevenly on the surface, generally centralizing at the edges [17]. Considering that introducing O-containing groups to a graphene sheet usually degrades its conductivity, the enhancement of conductivity in the S@G samples indicates most S atoms are connected via C-S or C=S covalent bonds rather than C-SOx, as indicated by the XPS analysis. Raman analysis (Fig. S4 in Supporting information) shows that the S@G samples have smaller D band to G band intensity ratio (ID/IG), corresponding to less defects as compared to NMG. It implies that the S atoms might have preferentially combined with the active C atoms in edges, thus reducing the amount of defects.
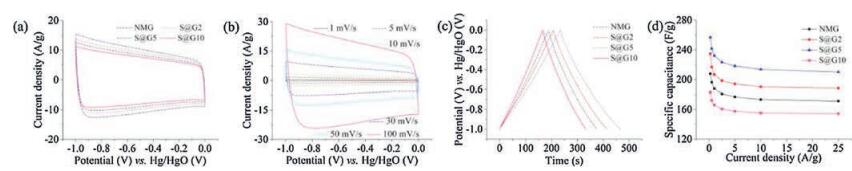
The as-prepared samples have been tested in three-electrode systems and two-electrode symmetrical supercapacitors for electrochemical behavior studying. Fig. 4a illustrates the cyclic voltammetry (CV) curves of the as-prepared materials at a scan rate of 50mV/s in the three-electrode system. The curves of all the electrodes exhibit an approximately rectangular shape which is characteristic of EDLCs. The difference in the relative specific capacitance can be evaluated by comparing the area under the CV curve within the potential window. The specific capacitance of S@G5 calculated from the CV curve reaches 103F/g at 50mV/s, much higher than NMG (84F/g). Fig. 4b illustrates the CV curves of S@G5 at different scan rates and S@G5 exhibits stable electrochemical behavior in a wide range of scan rates of 1-100mV/s. As the scan rate increasing, the shape of the CV curves distorts gradually, indicating that fast charge and discharge requires longer response times [18]. The response current density obviously increases with the increasing of scan rates, indicating that the S@G5 electrode has excellent rate ability performance.

|
Download:
|
| Fig. 4. (a) CV curves of NMG, S@G2, S@G5, S@G10 electrodes at a scan rate of 50mV/s. (b) CV curves of S@G5 electrode at different scan rates. (c) Charge-discharge curves of NMG, S@G2, S@G5 and S@G10 electrodes at a current density of 1A/g. (d) Specific capacitances of NMG, S@G2, S@G5 and S@G10 electrodes at different current densities. | |
Fig. 4c shows the charge/discharge curves at the currentdensity of 1A/g. The charge-discharge curves of all the materials are symmetrical triangles, which is another feature of ideal EDLCs. The potential drop (IR drop) is comparatively small, indicating the low internal resistance, so that less energy is consumed to produce useless heat in the process of charge and discharge, which is very important in energy storage equipment [26]. Specific capacitances at different current densities are calculated according to the galvanostatic charge/discharge tests (Fig. 4d). The specific capacitances of S@G5, S@G2, NMG, S@G10 at the current density of 0.25A/g are 257, 234, 208 and 183F/g, respectively. The specific capacitance increasesas the S content increasingto5wt%, showing that the decoration of a small amountof S is capable of significantly improving the specific capacitance of the porous NMG. The enhancement in the specific capacitance can be attributed to the following three factors: 1) The good hydrophility of the S@G materials is in favor of the good contact between electrode and electrolyte, thus reducing the charge transfer resistance on the interface; 2) The sulfur atoms incorporated into the graphene network can deliver a reversible pseudo-capacitance [27]; 3) The higher conductivity of the S@G materials is profitable to the quick charge transfer in the electrode. Compared to NMG, the lowered capacitance of S@G10 might be ascribed to the excess sulfur that has occupied the active sites and reduced the SSA. The specific capacitance of S@G5 (257 F/g at 0.25 A/g) is also higher than the recently-reported values for S-doped mesoporous carbon fibers (221 F/g) [17], and S-doped mesoporous carbon (191 F/g) [27].
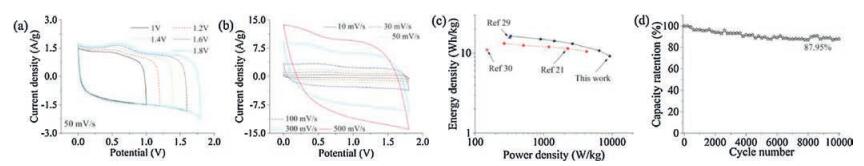
In order to provide a full-scale measurement for practical application, a symmetrical supercapacitor (two-electrode system) using S@G5 as electrode material is constructed and measured. It has been reported that the Na2SO4 electrolyte possesses a higher operation voltage than that of acid and alkali solutions. For example, Wang et al. [28] assembled a porous carbon symmetric supercapacitor with 1 mol/L Na2SO4 aqueous solution as electrolyte. It was found that the CV curves still retain a rectangular-like shape even when the voltage increases to 1.8 V with no obvious distortion in the anodic current. Therefore, the S@G5 symmetric cell was assembled with with 1 mol/L Na2SO4 aqueous solution as electrolyte. Fig. 5a shows typical CV curves of the S@G5 symmetrical supercapacitor at different potential windows. Even when the voltage window reaches 1.8 V, the CV curve of the S@G5 symmetrical supercapacitor still displays a rectangular shape, indicating that the electrolyte is stable in this voltage range, owing to the storage of nascent hydrogen on the porous carbon below the thermodynamic potential for water decomposition [28]. In Fig. 5a, there is an obvious redox peak centered at ~0.6 V in the CV curves. In the S@G5 composite, a certain number of S atoms exist in the form of C-SOx. The redox peak at ~0.6 V might be related to the redox transfer of S between C-SOx groups in the S@G5 composite and SO42- ions in the electrolyte. Moreover, CV curves of the symmetric supercapacitor at different scan rates are shown in Fig. 5b. All the CV curves display rectangular-like shape, indicating an ideal capacitive behavior. More interestingly, there is no obvious distortion even at very high scan rate of 500 mV/s, suggesting a fast charge-discharge stability and excellent rate capability. As shown in Fig. 5c, the S@G5 symmetrical supercapacitor exhibits a high energy density of about 16.4 Wh/kg at the power density of 328 W/kg, and the highest power density reaches to 9.18 kW/kg when the energy density is 9.18 Wh/kg. This result is much better than many reported symmetric supercapacitors based on carbon materials [21, 29, 30].

|
Download:
|
| Fig. 5. (a) CV curves of S@G5 symmetric supercapacitor at different potential windows. (b) CV curves of S@G5 symmetric supercapacitor at different scan rates. (c) Ragone plots of S@G5 symmetrical supercapacitors. (d) The cycle stability of S@G5//S@G5 at the current density of 0.5A/g. | |
The cycling stability of the S@G5 symmetrical supercapacitor was tested at the current density of 0.5 A/g and 87% of the initial specific capacitance is remained after 10, 000 cycles (Fig. 5d), showing excellent cycling stability. The coulombic efficiency is maintained 100% during the cycling test. The Nyquist plots before and after cycling (Fig. S5a in Supporting information) are consisted of a nearly vertical straight line and a semicircular curve, which is the third characteristic of an ideal capacitor. Equivalent circuit fitting shows that the charge transfer resistances for the S@G5// S@G5 supercapacitor before and after the cycling test are 0.26 Ohm and 0.21 Ohm, indicating a high conductivity of the electrode material. The capacitance calculated from the impedance data (Fig. S5b in Supporting information) decreases sharply at about 2 Hz and remains 0.032 F at 10 Hz.
To test the stability of the S@G composites in organic electrolyte, we added elemental sulfur and S@G5, respectively, into an orgnic electrolyte, 1 mol/L tetraethylammonium tetrafluoroborate/acetonitrile (TEATFB/AN). The operation was performed in an Ar-filled glove box. No dissolution of elemental sulfur or S@G5 was observed. It indicates that the S@G composites are stable in an organic electrolyte, and thus is promissing to be applied as electrode materials for high-voltage supercapacitors. Further work on this aspect is still on the way. Besides the above demonstrated application in supercapacitors, the S-decorated carbon materials widely exist in the S-carbon composite cathodes for Li-S batteries. We believe that similar changes in the carbon frameworks, such as the covalent-bonding of S atoms and the enhanced conductivity, have occurred in the S-carbon composites in many Li-S battery studies. Our results provide valuable clues to stabilize S in the cathodes of Li-S batteries.
In conclusion, S-decorated NMG was synthesized by a 155 ℃ heat treatment of a mixture of NMG and S. XPS and TG analysis indicate that most S atoms in the S@G samples are combined with NMG via covalent bonds rather than exist as free elemental S. The as-obtained S@G materials keep a high SSA, and exhibit obviously enhanced conductivity and hydrophilicity as compared to NMG. As electrode materials for aqueous surpercapacitors, the S@Gs exhibit significantly improved specific capacitance (corresponding to high energy density and power density) and excellent cycling stability. Our results provide a simple approach to scalable synthesis of S-doped porous carbon materials (e.g., active carbon), which have potential applications in the high-performance capacitive energy storage devices.
AcknowledgmentThis work was supported by the National Natural Science Foundation of China (No. 21776309).
Appendix A. Supplementary dataSupplementary data associated with this article can be found, in the online version, at https://doi.org/10.1016/j.cclet.2017.11.026.
| [1] |
W. Xing, C.C. Huang, S.P. Zhuo, et al., Carbon 47(2009) 1715-1722. DOI:10.1016/j.carbon.2009.02.024 |
| [2] |
B. Hsia, M.S. Kim, M. Vincent, C. Carraro, R. Maboudian, Carbon 57(2013) 395-400. DOI:10.1016/j.carbon.2013.01.089 |
| [3] |
P. Simon, Y. Gogotsi, Nat. Mater. 7(2008) 845-854. DOI:10.1038/nmat2297 |
| [4] |
K. Fic, M. Meller, E. Frackowiak, Electrochim. Acta 128(2014) 210-217. DOI:10.1016/j.electacta.2013.11.047 |
| [5] |
A.G. Pandolfo, A.F. Hollenkamp, J. Power Sources 157(2006) 11-27. DOI:10.1016/j.jpowsour.2006.02.065 |
| [6] |
R. Kötz, M. Carlen, Electrochim. Acta 45(2000) 2483-2498. DOI:10.1016/S0013-4686(00)00354-6 |
| [7] |
R. Ruoff, Nat. Nanotech. 3(2008) 10-11. DOI:10.1038/nnano.2007.432 |
| [8] |
Y. Huang, J. Liang, Y. Chen, Small 8(2012) 1805-1834. DOI:10.1002/smll.201102635 |
| [9] |
M.F. El-Kady, V. Strong, S. Dubin, R.B. Kaner, Science 335(2012) 1326-1330. DOI:10.1126/science.1216744 |
| [10] |
J. Chen, C. Li, G. Shi, J. Phys. Chem. Lett. 4(2013) 1244-1253. DOI:10.1021/jz400160k |
| [11] |
C. Xu, B. Xu, Y. Gu, et al., Energ. Environ. Sci. 6(2013) 1388-1414. DOI:10.1039/c3ee23870a |
| [12] |
G. Ning, Z. Fan, G. Wang, et al., Chem. Commun. 47(2011) 5976-5978. DOI:10.1039/c1cc11159k |
| [13] |
Y. Jiang, C. Zhou, J. Liu, Energy Storage Mater. 11(2018) 75-82. DOI:10.1016/j.ensm.2017.09.013 |
| [14] |
W. Zuo, R. Li, C. Zhou, et al., Adv. Sci. 4(2017) 1600539. DOI:10.1002/advs.v4.7 |
| [15] |
H.M. Jeong, J.W. Lee, W.H. Shin, et al., Nano Lett. 11(2011) 2472-2477. DOI:10.1021/nl2009058 |
| [16] |
L. Niu, Z. Li, W. Hong, et al., Electrochim. Acta 108(2013) 666-673. DOI:10.1016/j.electacta.2013.07.025 |
| [17] |
X. Ma, G. Ning, Y. Kan, et al., Electrochim. Acta 150(2014) 108-113. DOI:10.1016/j.electacta.2014.10.128 |
| [18] |
W. Si, J. Zhou, S. Zhang, et al., Electrochim. Acta 107(2013) 397-405. DOI:10.1016/j.electacta.2013.06.065 |
| [19] |
Z. Yang, Z. Yao, G. Li, et al., ACS Nano 6(2012) 205-211. DOI:10.1021/nn203393d |
| [20] |
Z. Yang, H. Nie, X.A. Chen, X. Chen, S. Huang, J. Power Sources 236(2013) 238-249. DOI:10.1016/j.jpowsour.2013.02.057 |
| [21] |
Y.S. Yun, V.D. Le, H. Kim, et al., J. Power Sources 262(2014) 79-85. DOI:10.1016/j.jpowsour.2014.03.084 |
| [22] |
G. Ning, X. Ma, X. Zhu, et al., ACS Appl. Mater. Inter. 6(2014) 15950-15958. DOI:10.1021/am503716k |
| [23] |
S.L. Candelaria, Y. Shao, W. Zhou, et al., Nano Energy 1(2012) 195-220. DOI:10.1016/j.nanoen.2011.11.006 |
| [24] |
D.S. Patil, S.A. Pawar, R.S. Devan, et al., J. Electroanal. Chem. 724(2014) 21-28. DOI:10.1016/j.jelechem.2014.04.006 |
| [25] |
P.A. Denis, R. Faccio, A.W. Mombru, ChemPhysChem 10(2009) 715-722. DOI:10.1002/cphc.v10:4 |
| [26] |
Q. Wu, Y. Xu, Z. Yao, A. Liu, G. Shi, ACS Nano 4(2010) 1963-1970. DOI:10.1021/nn1000035 |
| [27] |
X. Zhao, Q. Zhang, C.M. Chen, et al., Nano Energy 1(2012) 624-630. DOI:10.1016/j.nanoen.2012.04.003 |
| [28] |
Q. Wang, J. Yan, Y. Wang, et al., Carbon 67(2014) 119-127. DOI:10.1016/j.carbon.2013.09.070 |
| [29] |
J. Yan, Q. Wang, T. Wei, et al., ACS Nano 8(2014) 4720-4729. DOI:10.1021/nn500497k |
| [30] |
L. Bao, X. Li, Adv. Mater. 24(2012) 3246-3252. DOI:10.1002/adma.v24.24 |