 2017, Vol. 28


b School of Mechanical and Electronical Engineering, Lanzhou University of Technology, Lanzhou 730050, China;
c Laboratory of Clean Energy Chemistry and Materials, State Key Laboratory of Solid Lubrication, Lanzhou Institute of Chemical Physics, Chinese Academy of Sciences, Lanzhou 730000, China
Increasing interests in developing renewable and environmentfriendly electrodes has driven researchers for several years [1-3].Nanocellulose has attracted great attentions as electrode materialsbecause of low cost, large specific surface area, high porosity andbroad chemical-modification capacity [4, 5].Bacterial cellulose(BC) is one of the families of nanocellulose and it features not onlycommon cellulosic properties but also other useful properties asultrafine fiber network structure and rich hydrogen bonds [6].Thus, it shows the potential applications as electrodes inelectrochemical supercapacitors.
Significant efforts have been made to fabricate BC-basedcomposite electrodes, such as carbonization [7, 8], electro-deposition [9] and chemical polymerization [10].Among these methods, one-step carbonization has shown the advantage of convenient, environment friendly and potential of large scale synthesis.For BCcarbonization, the specific capacitances of electrodes preparedfrom pristine BC increase because of the enhanced specific surfacearea with the increase in carbonization temperature [7].In thiswork, we found that the specific capacitances of pyrolysis BC (pBC) increased first and then decreased in a KOH electrolyte withthe increase of carbonization temperature, exhibiting the maximum capacitance value of ~149.1 F/g at the current density of 1 A/gat 900 ℃.Further increase of the temperature above 900 ℃, thespecific capacitances of p-BC declined sharply.It indicates thatthere is a limitation to achieve higher capacitance of p-BC onlythrough increasing the annealing temperature.On the other hand, some efforts have also been made to enhance the specificcapacitance of p-BC electrodes by introducing heteroatoms intothe framework [11] or combining materials with high pseudo-capacitance, such as metal oxides [12, 13] and conductivepolymers [14].However, to the best of our knowledge, there arefew reports on the surface modified-BC (MBC) and the relationshipbetween the structure and supercapacitive performance of MBC.
Two commonly used modification methods of BC are chemical modification and bio-modification, with the former a moreefficient synthetic method. Via chemical modification, 2, 2, 6, 6-tetramethylpilperidine l-oxyl radical (TEMPO) -oxidized celluloseis widely used in the preparation of cellulose nanocrystals.Severalreports have explored to the TEMPO-oxidized cellulose as biopolymers for "greener" electronics, such as Li/Na-ion batteries [15, 16], supercapacitors [17-19] and soft actuators [20-22].According to those reports, the oxidized BC nanofibers frameworkusing TEMPO under mild conditions showed good dispersibilityand hydrophilicity [15, 21, 23], which is beneficial to synthesis BCbased nanocomposites [20, 23].The MBC, the introduction ofcarboxylate functional groups via TEMPO-oxidization on thesurface of BC, provides more effective active sites and, further, enables BC-based nanocomposites with higher loading ofelectroactive materials with pseudo-capacitance [24, 25].Furthermore, carboxylic acid groups of MBC can provide abundantprotons and large ion-exchange sites to enhance the absorption ofionic liquid and ion transport properties [20], which is beneficial tothe electrochemical performance of MBC.Most importantly, theintroduction of TEMPO oxidized only the hydroxymethyl group ofpolysaccharides, with no influences on the surface of hydroxideradical [26].As results, the obtained samples have a large numberof hydroxyl and carboxyl groups.
In this study, we proposed a method by using a renewablebiomass of MBC as a precursor to prepare functional carbonframeworks in one simple step.We focused on studying the changeof the morphology and the relationship between the structure andthe electrochemical performance of pyrolysis MBC (p-MBC) underdifferent carbonization temperatures.The obtained carbonmaterials are composed of carbon nanosheets and exhibited hierarchical structure with high porosity and rich oxygenated functionalities, the common features for high-performance supercapacitors.Besides, the large amount of stable oxygencontaining species and defects derived from carboxylic acid groupswould be beneficial not only increasing the possibility forelectrolyte diffusion into the electrode, but providing highpseudo-capacitance as well.It is demonstrated that, with a muchlower annealing temperature of 500 ℃, p-MBC electrode canachieve a specific capacitance of 137.3 F/g in 2 mol/L KOH aqueouselectrolyte, which is comparable with that of p-BC at 900 ℃ annealing temperature.Thus, the proposed method opens up anew way for achieving high specific capacitance of BC as electrodeswith less crucial processing conditions.
Fig.1a is the schematic illustration of sample preparation ofp-BC and p-MBC.Here, as prepared freeze-dried MBC fibrildispersions was fabricated by using the TEMPO-mediated oxidation method and subsequent pyrolysis by facile one-stepcarbonization under different temperatures.BC and MBC dispersion was prepared by adding, respectively, BC and MBC (0.6 g) intodeionized water (150 mL) under gentle agitation.As shown in Fig.1b, MBC solution was homogeneously dispersed and was clearand stable because of its high zeta potential [16].In comparison, BCsolution showed grainy appearance.SEM characterization of BCand MBC shows a dense 3D porous network structure composed ofnumerous ultra-thin nanofibers entangle each other (Figs.1c and d).It is seen from Fig.1g that, the disordered amorphous regionamong the oxidized cellulose easily adhered each other, resultingin the formation of sheet-like porous network.Meanwhile, somesmall nanofibrils fractured by fiber bundles after being carboxymethylated exposed on the surface of the MBC fibers.The reasonof the morphological changes is that there were a large number ofhydroxyl groups on the BC chains before modification.Once theintroduction of carboxyl groups, the interaction of hydrogen bondwas damaged resulting in the separation of fiber bundles andreduction in fiber length [24].In the process, the 3D network of BCbecame a disassembly structure and the individual fibers of the BCwere densely packed again because of the existing undamagedhydrogen bond and van der Waals, forming a more flat andcompact structure.XRD images of the pristine BC and MBC (Fig.1e)displayed peaks at 14.5°, 16.9° and 22.7° of polymorph cellulose I, which is Ia-rich.This means that MBC maintained the crystallinityand did not change from the original crystal width of BC [27, 28].Inaddition, the thermal stability of MBC was decreased comparedwith that of BC (Fig.S1 in Supporting information).From the FT-IRspectra of MBC and BC (Fig.S2a in Supporting information) it isseen that most of the main bands were unchanged, with theexception of C=O vibrations shifted from at 1646 cm-1 to1624 cm-1 (Fig.S2b), showing carboxylate groups at C6 positionof the molecules by TEMPO-mediated oxidation [20, 24].

|
Download:
|
| Fig. 1. (a) Schematic illustration of the preparation of p-BC and p-MBC samples; (b)Digital photos of BC and MBC suspension; Scanning electron microscope (SEM)images of (c) BC and (d) MBC; (e) X-ray diffraction (XRD) patterns of BC and MBC; Transmission electron microscopy (TEM) images of (f) BC and (g) MBC. | |
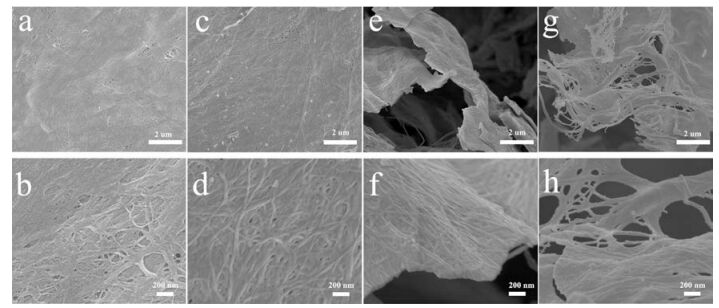
After carbonization at high temperature under Argon, both theBC and MBC samples turn black, indicating a successful transformation of cellulose into carbon.In this study, the pyrolysis sampleswere labeled as p-BCx and p-MBCx, where the suffix "x" refers tothe annealing temperature.Fig.2 shows SEM images of p-BC500, p-BC900, p-MBC500 and p-MBC900 with low and high magnification.The morphology of p-BC500 is similar to that of p-BC900 withnanofibrils packed irregularly forming a dense porous network.Because the fibers became shorter and thicker after TEMPOmodification, the structure of p-MBC500 and p-MBC900 is quiteunique, still remaining the 3D porous structure with a smallnumber of individual nanofibers and numerous sheet-like porousnetwork ranging from several hundreds of nanometers tomirometers.The unique structure provides not only the plentypassage of charge transfer and ion transport but also allows moreactive materials fully exposed to electrolytes.TEM images (Fig.S4 in Supporting information) show that p-MBC has layers andunzipped bundles microstructure, which are more flat andcompact than the fibers in p-BC.

|
Download:
|
| Fig. 2. (a) Low and (b) high magnification SEM images of p-BC500; (c) Low and (d) high magnification SEM images of p-BC900; (e) Low and (f) high magnification SEM imagesof p-MBC500; (g) Low and (h) high magnification SEM images of p-MBC900. | |
To further study the microstructure of p-BC and p-MBC, XRDand Raman spectroscopy are shown in Figs.S5 and S6 inSupporting information, respectively.All XRD patterns exhibitbroad peaks at 24° and 43°, indicating the crystallographic planesof (002) and (100) in the disordered carbon structure [29].Ramanspectra in Fig.S6 give the relative intensity ratio of the D peak to Gpeak, ID/IG, that indicates the amount of defects in the graphiticstructure [7, 30].The ID/IG values of p-BC500, p-BC700, p-BC900and p-BC1000 are 0.65, 0.89, 1.52 and 1.31, and those of pMBC500, p-MBC700, p-MBC900 and p-MBC1000 are 0.89, 1.06, 1.65 and 1.33.The results show that both group of p-BCx and pMBCx has a disordered structure and there are increasing numberof defects with the increase of carbonization temperature, which is beneficial for the high power output as electrode materials forsupercapacitors [30].
As we know, a large accessible surface area and suitable poresize is important for the capacitivity of supercapacitors.For p-BCx, with the increase of annealing temperature, the surface area of thesamples increases first and then decreases.In Fig.3a, it is clearlyobserved that p-BC900 has the largest specific surface area of 487.76 m2/g, while p-BC1000 exhibit smaller surface areas of342.86 m2/g.Fig.3b shows that p-BCx displays rich porousstructures that consist of a large number of mesopores, especiallyp-BC900.For samples of p-MBCx, the influence of annealing temperature on the specific surface area shows similar pattern asthat of p-BCx (Fig.3d).For p-MBC900, a large amount ofmicropores and mesopores are present, with the pore sizedistribution in the range of 1.4–3 nm (Fig.3e).However, thesurface area of the sample is only 198.46 m2/g much smaller than that of the p-BC900, the BC sample without TEMPO-oxidation.Similarly, the surface area of p-MBC500 is smaller than that of itscounterpart, p-BC500.However, the former, the modified sample, owns more mesopores, which is beneficial to the electrolyte accessto the electroactive sites.

|
Download:
|
| Fig. 3. (a) Nitrogen adsorption–desorption isotherms and (b) the pore size distributions of p-BCx; (c) O 1s XPS spectra of p-MBC500; (d) Nitrogen adsorption–desorptionisotherms and (e) the pore size distributions of p-MBCx; (f) O/C ratio based on XPS O 1s and the variation of the amount of oxygen groups for samples. | |
To study the effect of annealing temperature on the structureevolution, specifically, the oxygen functional groups of p-BC andp-MBC, X-ray photoelectron spectroscopy (XPS) analysis showsthat p-MBC and p-BC contains mainly carbon and oxygen elements(Fig.S7 in Supporting information).The O 1s can be divided intothree sharp peaks from C=O (531.3 eV), C—O (532.2 eV) and O=C—O (533.2 eV) bonds [31] (Fig.3c).Apparently, theconcentration of C—O decreases with an increase in annealing temperature, while the concentration of the total of O=C—O and C=O increases.Fig.3f reveals that the atom ratios of O/C forp-MBCx remains almost unchanged at the temperature below 700 ℃.It demonstrates that the labile hydroxyl groups cantransform to stable C=O groups.
The electrochemical performance of p-BCx and p-MBCxelectrode for supercapacitors was measured in a three-electrodesystem with 2 mol/L KOH as an aqueous electrolyte.The results areshown in Figs.4 and 5.

|
Download:
|
| Fig. 4. (a) CV curves of the p-BCx electrode at 50 mV/s; (b) Galvanostatic charge/discharge curves of p-BCx electrode at current density of 1 A/g; (c) CV curves of the p-MBCxelectrode at 50 mV/s; (d) Galvanostatic charge/discharge curves of p-MBCx electrode at current density of 1 A/g. | |

|
Download:
|
| Fig. 5. (a) CV curves of p-BC500 and p-MBC500 electrode at 10 mV/s, (b) Galvanostatic charge/discharge curves of p-BC500 and p-MBC500 electrode at current density of1 A/g; (c) Galvanostatic charge/discharge curves of p-BC500 and p-MBC500 electrode at current density of 5 A/g; (d) CV curves of p-BC900 and p-MBC900 electrode at | |
As shown in Fig.4a, the fusiform area enclosed by the CV curvesof p-BC500 at 50 mV/s is very small, and the redox peaks can hardlybe observed.With a rather low value of 30.8 F/g the sample ofp-BC500 does not show good performance of electrical doublelayer capacitive (EDLC) behavior.The reason could be attributed tothe low degree of carbonization of BC sample at 500 ℃, leading tothe low electric conductivity and low specific surface area.Withincreasing carbonization temperature over 500 ℃, the shape of theCV curves of p-BCx become rectangular gradually.When theannealing temperature reaches 900 ℃, the sample of p-BC900exhibits a maximum capacitance of 149.1 F/g at the current densityof 1 A/g (Fig.4b).At the high annealing temperature of 1000 ℃, thecapacitance value of only 115.5 F/g was obtained, although BETsurface area is 342.86 m2/g.Therefore, the pore size distributionshould also be considered.At 1000 ℃ the internal structure ofp-BC changed.Both of the number of mesopores and the porevolume of p-BC1000 were decreased.The pore volume of p-BC900is 0.40 cm3/g, while that of p-BC1000 is 0.33 cm3/g.For p-BCx, BETsurface area and pore size distribution played an important role indetermining the capacitance of carbonization samples in aqueousKOH electrolyte.There is no indication of faradaic reactionsobserved for all p-BCx samples.
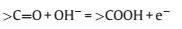
For p-MBCx, it can be seen that the area enclosed by the curvesof p-MBC500 is about the same as or even larger than those ofother samples of p-MBCx at higher annealing temperatures(Fig.4c).The specific capacitance of p-MBC500, p-MBC700, p-MBC900 and p-MBC1000 electrodes calculated from GCD curves(Fig.4d) are 137.4, 149.5, 160.2 and 87.5 F/g, respectively, at currentdensity of 1 A/g.According to Fig.3d, the BET surface area ofp-MBC1000 is much higher than that of p-MBC500, however, thecapacitance of p-MBC1000 was significantly lower than those of others.The different trends were particularly interesting becauseBET surface area played a significant role in determining thecapacitance of p-BCx.The oxygen-containing functional groupshould be considered.Fig.4c shows that the CV curve of p-MBC500deliver a couple redox peaks at -0.7 ~ -0.2 V, indicating thepesudocapacitive behavior of the electrode.These peaks areattributed to the redox of function groups of C=O and O—C=O according to the equation [31, 32]:

|
(1) |
|
(2) |

|
(3) |
With the increasing temperature of carbonization, the atomratios of O/C decreased (Fig.3f), and the disappeared peak around -0.8 V, indicates that oxygen-containing groups are brought in theadditional Pseudo-capacitance in aqueous KOH electrolyte.
Both p-BCx and p-MBCx display highly porous structures thatconsist of a large number of micropores and mesopores.Comparedto p-BCx, the capacitance of p-MBCx also increased first and thendecreased with an increase of annealing temperature, but withsome different characteristics, especially for p-BC500 andp-MBC500.Although the BET surface area of p-MBC500 is smallerthan that of p-BC500, the capacitance of the former is larger thanthat of the latter.As shown in Fig.5a, the area enclosed by the CVcurves of p-BC500 at 10 mV/s is very small and the redox peaks canhardly be observed.By comparison, that of p-MBC500 is muchlarger and the curves display a broad peak around -0.7 V, whichcould be attributed to the pseudo-capacitive contribution from theredox reactions of the oxygen-containing functional groups on thesurface of p-MBCs [33].The amount of functional groups on thesurface of p-MBC500 are more than that of p-BC500 (Fig.S9 inSupporting information), and the atom ratios of O/C for p-BC500(0.23) are lower than that for p-MBC500 (0.24).The increase in the functional groups of p-MBC500 not only increase the wettabilitybetween electrolyte and the electrode [34], but also providespseudo-capacitance.Therefore, the pseudo-capacitance formoxygen-containing functional groups on the surface ofp-MBC500 makes a major contribution to the capacitance of theelectrode.Besides, the ID/IG values increase from 0.65 of p-BC500to 0.89 of its TEMPO-oxidized counterpart, p-MBC500, suggestingthat there are more defects generated in the latter, which isbeneficial for the accumulate charges and charge transfer due tomore accessible surface area [7].From the above reasons, theysuggest that the p-MBC500 displays both EDLC behavior andpseudo-capacitance performance.
According to the comparison of CV and GCD curves, p-MBC900and p-BC900 displays the prominent electrochemical capacityamong them.As expected, the charge and discharge curves(Figs.5e and f) are symmetric, indicating a high reversibility of thereaction of p-MBC900 and p-BC900.For p-MBC900 sample, largeaccessible surface area and suitable pore size would facilitate electrolyte to enter into the pore and enabled the formation ofEDLC to store the charge.The results suggested that increasing BETsurface area and pore size both had a significant influence on thecapacitance value for p-MBC900.Therefore, p-MBC900 shows atypical electrical double layer capactive behavior.
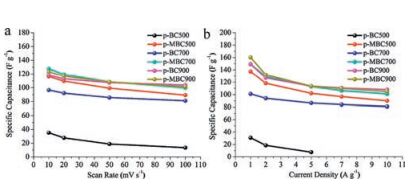
In addition to the high specific capacitance, the rate capabilityand cycle stability should also be considered as important factorsfor ideal supercapacitors.For p-BC900 and p-MBC900, voltagedrops are hardly observed at high current density of 20 A/g (Fig.5f).However, voltage drops of p-BC500 and p-MBC500 are verydistinct even at a current density of 5 A/g (Fig.5c).It indicates thatthe p-BC900 and p-MBC900 have good rate capacities with highercarbonization temperature.Additionally, the CV curve of p-BC900retained its rectangular shape even at 700 mV/s (Fig.S8a inSupporting information), while that of p-MBC900 could hardlykeep the rectangular shape when the scan rate was as low as200 mV/s (Fig.S8b), indicating a better rate electrochemical performance of the p-BC900 electrode.The specific capacitanceof the samples calculated based on the CV curves can be observedin Fig.6a, while those based on the GCD curves in Fig.6b.Thep-MBC700 electrode exhibits high gravimetric capacitance of127.6 F/g at 10 mV/s, while the p-MBC900 electrode presents 123.1 F/g at 10 mV/s.At high scan rate up to 200 mV/s, thegravimetric capacitance of p-MBC900 is slightly higher than that ofp-MBC700, indicating rate capability as the carbonization temperature rises.As shown in Fig.S10a in Supporting information, theequivalent series resistance of p-BC500 (≈0.89Ω) is lower thanthat of p-MBC500 (≈ 0.95Ω), however, the straight line with thereal axis angle of p-BC500 is larger than that of p-MBC500 in thelow frequency, suggesting that the diffusion impedance ofp-MBC500 is larger.According to Fig.S10b, it shows that theequivalent series resistance of p-BC900 and p-MBC900 are lowerthan the samples obtained at 500 ℃, suggesting very lowresistance and good ion response.So the cycling test of p-BC900shows 84.2% of capacitance retention over 10000 cycles at 1 A/g(Fig.5g), demonstrating good electrochemical stability.Comparedwith the previous reported carbon based supercapacitors inaqueous electrolyte, p-BC900 and p-MBC900 show outstanding electrochemical performance (Table S1 in Supporting information).

|
Download:
|
| Fig. 6. Comparison of gravimetric specific capacitances of p-BC500, p-MBC500, pBC700, p-MBC700, p-BC900 and p-MBC900 versus (a) scan rates, and (b) current densities | |
In conclusion, samples of p-MBC were successfully synthesizedfrom BC pellicles through a TEMPO-mediated oxidation andsubsequent carbonization.For p-BCx, the high BET surface areaand rich mesopores are beneficial to form EDLC to enhance thecapacity and rate capability.For p-MBCx, the oxygen-containing functional groups introduce the extra pseudo-capacitance.The pMBC electrode at 500 ℃ possesses a high specific capacitance of137.3 F/g in 2 mol/L KOH aqueous electrolyte with excellent ratecapability, which is much higher than the pristine BC under thesame annealing temperature.The results show that p-MBC500displays both electrical EDLC behavior and pseudo-capacitance performance, and the effect of the functional groups is thedominant factor for the capacitance of p-MBC500.In addition, pMBC pyrolysis at 900 ℃ also shows specific capacitance (160.2 F/g), rate performance and long-term cycling stability in 2 mol/L KOHaqueous electrolyte.This work provides a simple and effectivemethod to prepare hierarchical structure nanosheets with stableoxygen functional groups and rich pore structure, which beneficialfor the high capacitance, rate capability and cycling stability.Thesefindings promote the design for BC as electrode material forsupercapacitors and other energy-storage devices such as Na-ionbatteries, Li-ion batteries and Li–S batteries.
Materials: Bacterial cellulose (BC) was purchased from HainanYida Food Industry Co., Ltd., China.2, 2, 6, 6-Tetramethylpiperidine-1-oxyl radical (TEMPO) was obtained from Sigma-Aldrich.Sodiumhypochlorite (NaClO), sodium bromide (NaBr), ethanol and sodiumhydroxide (NaOH) were purchased from Lanzhou Zhongke KateEquipment Distribution Co., Ltd.
Preparation of MBC and BC: BC pellicles were first cut into smallpieces and pulped with a mechanical stirring.The obtainedmixture was freeze-dried.The MBC was fabricated using theTEMPO oxidation method [20-22].
Fabrication of p-MBC and p-BC: The as-prepared BC and MBCwas pyrolyzed at 500 ℃, 700 ℃, 900 ℃ and 1000 ℃ in a horizontaltube furnace for 2 h with a heating rate of 5 ℃/min in Argon.Aftercooling down to room temperature, the samples were washed withdeionized water several times, and dried at 60 ℃ overnight in avacuum oven.
Characterization: The morphology and the structure of p-BCxand p-MBCx was characterized by a field emission scanningelectron microscopy (FESEM, JSM 6701F) and a transmission electron microscopy (TEM, JEOL 2100 FEG).The chemicalcomponents were measured by an X-ray photoelectron spectrometer (XPS, ESCALAB250x).The thermal stability of the samples wascharacterized by thermo-gravimetric analysis (STA449C) at a rateof 10 ℃/min under air atmosphere from room temperature to800 ℃.The nitrogen adsorption-desorption isotherm measurements were performed on an ASAP 2020 volumetric adsorption analyzer (Micromeritics, USA) at 77 K.Powder X-ray diffraction(XRD, Rigaku D/Max-2400, Cu-Ka radiation, λ = 0.15405 nm).Raman spectroscopy (Horiba Jobin Yvon HR Evolution) and Fouriertransform infrared spectroscopy (FTIR, IFS120HR) were employedto investigate the microstructure of the as-prepared samples.
Electrochemical measurements: All electrochemical tests werecarried out in a three electrode testing system (CHI 660Delectrochemical workstation, Shanghai) with a platinum electrodeas a counter electrode and a saturated calomel (SCE) electrode as areference electrode.The mixture of active material, acetylenecarbon and polytetrafluoroethylene (PTFE) binder with a massratio of 80:10:10 was coated onto the nickel foams (about 1 mg ofactive material) under the pressure of 10 MPa and dried at 60 ℃ for 12 h in a vacuum oven.
Cyclic voltammetry (CV), Galvanostatic charge-discharge (GCD)and Electrochemical impedance spectroscopy (EIS) test weremeasured in 2 mol/L KOH aqueous electrolyte.The CV was carriedout over the potential range of -1 V to 0 V.The EIS measurementswere carried out at an open circuit potential with a frequencyrange from 0.01 Hz to 100 kHz.The long-term cycling stability wasassessed according to GCD with a potential range between -1 Vand 0 V for 10000 cycles.
The specific capacitance was calculated according to the GCDcurve [35]:

|
(1) |
Where I is the discharge current (A), Δt is the discharging time (s), m is the mass of active materials (g), and ΔV is the voltage dropupon discharge (excluding the IR drop) (V).
The specific capacitance (C) according to the CV curve [30]:
|
(2) |
Where I is the current density, V is the potential window, v is thepotential scan rate, and m is the mass of the active materials.
AcknowledgmentThis work was supported by the National Nature ScienceFoundations of China (Nos.21573265 and 21673263) and theIndependent Innovation Plan Foundations of Qingdao City of China(No.16-5-1-42-jch) and the plan of Youth Science foundations ofGansu Province (No.1610RJYA019).
Appendix A. Supplementary dataSupplementary data associated with this article can be found, in the online version, at http://dx.doi.org/10.1016/j.cclet.2017.08.013
| [1] |
H. Khalil, A.H. Bhat, A.F.I. Yusra, Carbohydr. Polym. 87(2012) 963-979. DOI:10.1016/j.carbpol.2011.08.078 |
| [2] |
T.H. Nguyen, A. Fraiwan, S. Choi, Biosens. Bioelectron. 54(2014) 640-649. DOI:10.1016/j.bios.2013.11.007 |
| [3] |
X.H. Lu, M.H. Yu, G.M. Wang, et al., Energy Environ. Sci. 7(2014) 2160-2181. DOI:10.1039/c4ee00960f |
| [4] |
D. Klemm, F. Kramer, S. Moritz, et al., Angew. Chem. Int. Ed. 50(2011) 5438-5466. DOI:10.1002/anie.201001273 |
| [5] |
K. Shi, X. Yang, E.D. Cranston, et al., Adv. Funct. Mater. 26(2016) 6437-6445. DOI:10.1002/adfm.v26.35 |
| [6] |
X. Chen, F. Yuan, H. Zhang, et al., J. Mater. Sci. 51(2016) 5573-5588. DOI:10.1007/s10853-016-9899-2 |
| [7] |
Y. Liu, T. Lu, Z. Sun, et al., J. Mater. Chem. A 3(2015) 8693-8700. DOI:10.1039/C5TA00435G |
| [8] |
L.F. Chen, Z.H. Huang, H.W. Liang, et al., Energy Environ. Sci. 6(2013) 3331-3338. DOI:10.1039/c3ee42366b |
| [9] |
S.H. Li, D.K. Huang, B.Y. Zhang, et al., Adv. Energy Mater. 4(2014) 7-10. |
| [10] |
H.H. Wang, L.Y. Bian, P.P. Zhou, et al., J. Mater. Chem. A 1(2013) 578-584. DOI:10.1039/C2TA00040G |
| [11] |
L.F. Chen, Z.H. Huang, H.W. Liang, et al., Adv. Funct. Mater. 24(2014) 5104-5111. DOI:10.1002/adfm.v24.32 |
| [12] |
L.F. Chen, Z.H. Huang, H.W. Liang, et al., Adv. Mater. 25(2013) 4746-4752. DOI:10.1002/adma.v25.34 |
| [13] |
L.Y. Liu, X. Zhang, H.X. Li, et al., Chin. Chem. Lett. 28(2017) 206-212. DOI:10.1016/j.cclet.2016.07.027 |
| [14] |
C. Long, D. Qi, T. Wei, et al., Adv. Funct. Mater. 24(2014) 3953-3961. DOI:10.1002/adfm.v24.25 |
| [15] |
H. Lu, M. Behm, S. Leijonmarck, et al., ACS Appl. Mat. Interfaces 8(2016) 18097-18106. DOI:10.1021/acsami.6b05016 |
| [16] |
F. Shen, H. Zhu, W. Luo, et al., ACS Appl. Mater. Interfaces 7(2015) 23291-23296. DOI:10.1021/acsami.5b07583 |
| [17] |
F. Wang, H.J. Kim, S. Park, et al., Compos. Sci. Technol. 128(2016) 33-40. DOI:10.1016/j.compscitech.2016.03.012 |
| [18] |
Z. Wang, D.O. Carlsson, P. Tammela, et al., ACS Nano 9(2015) 7563-7571. DOI:10.1021/acsnano.5b02846 |
| [19] |
Q.Z. Liu, S.S. Jing, S. Wang, et al., J. Mater. Chem. A 4(2016) 13352-13362. DOI:10.1039/C6TA05131F |
| [20] |
S.S. Kim, J.H. Jeon, H.I. Kim, et al., Adv. Funct. Mater. 25(2015) 3570. |
| [21] |
F. Wang, J.H. Jeon, S.J. Kim, . J, et al., Mater. Chem. B 4(2016) 5015-5024. DOI:10.1039/C6TB01084A |
| [22] |
F. Wang, J.H. Jeon, S. Park, et al., Soft Matter. 12(2016) 246-254. DOI:10.1039/C5SM00707K |
| [23] |
Y. Jia, X. Zhai, W. Fu, et al., Carbohydr. Polym. 151(2016) 907-915. DOI:10.1016/j.carbpol.2016.05.099 |
| [24] |
L.N. Yue, Y.D. Zheng, Y.J. Xie, et al., RSC Adv. 6(2016) 68599-68605. DOI:10.1039/C6RA07646G |
| [25] |
B. Bideau, L. Cherpozat, E. Loranger, et al., Ind. Crop Prod. 93(2016) 136-141. DOI:10.1016/j.indcrop.2016.06.003 |
| [26] |
W.N. Ren, W.W. Zhou, H.F. Zhang, et al., ACS Appl. Mater. Interfaces 9(2017) 487-495. DOI:10.1021/acsami.6b13179 |
| [27] |
W. Fan, K. Si-Seup, K. Chang-Doo, et al., Smart Mater. Struct. 23(2014) 074006-074016. DOI:10.1088/0964-1726/23/7/074006 |
| [28] |
W. Hu, S. Chen, X. Li, et al., Mater. Sci. Eng. C 29(2009) 1216-1219. DOI:10.1016/j.msec.2008.09.017 |
| [29] |
X.L. Zhu, P.Y. Wang, C. Peng, et al., Chin. Chem. Lett. 25(2014) 929-932. DOI:10.1016/j.cclet.2014.03.039 |
| [30] |
D.D. Shan, J. Yang, W. Liu, et al., J. Mater. Chem. A 4(2016) 13589-13602. DOI:10.1039/C6TA05406D |
| [31] |
L.L. Jiang, L.Z. Sheng, C.L. Long, et al., Adv. Energy Mater. 5(2015) 771-780. |
| [32] |
Y. Qiu, H. Dang, Z. Cheng, et al., Ionics 22(2016) 529-534. DOI:10.1007/s11581-015-1569-x |
| [33] |
Q. Liang, L. Ye, Z.H. Huang, et al., Nanoscale 6(2014) 13831-13837. DOI:10.1039/C4NR04541F |
| [34] |
B.S. Shen, H. Wang, L.J. Wu, et al., Chin. Chem. Lett. 27(2016) 1586-1591. DOI:10.1016/j.cclet.2016.04.012 |
| [35] |
L. Liu, J.W. Lang, P. Zhang, et al., ACS Appl. Mat. Interfaces 8(2016) 9335-9344. DOI:10.1021/acsami.6b00225 |