 2017, Vol. 28


b State Key Laboratory of Fine Chemicals, School of Chemistry, Dalian University of Technology, Dalian 116023, China
The intracellular pH, an important metabolic and cellular factor, plays critical roles in chemical reactions and biological processes such as cell proliferation, apoptosis, enzymatic activity and tumor growth [1]. In particular, the abnormal cellular pH values are considered to be closely related to cellular functional changes and some serious diseases such as stroke, Alzheimer disease and cancer [2-4]. Nowadays, cancer is still the leading cause of deaths worldwide. Early diagnosis of cancer which provides efficient remedy is very important for corresponding therapy and recovery. It is worth noting that the pH values of lysosomes in cancer cells is slightly lower than that in normal cells [5, 6]. This difference can be employed to distinguish cancer cells from normal cells, exhibiting great significance for the early diagnosis of cancer.
In recent years, fluorescent probes have been developed to be an important imaging tool for the measurement of intracellular pH, owing to their excellent selectivity, high sensitivity, operational simplicity, low cost and real time monitoring [7-9]. Among the common fluorophores that can be used to design pH probes, the rhodamine based fluorophore exhibits particular photophysical advantages in biological applications, due to its high fluorescence quantum yield, large molar extinction coefficient and good photostability etc. [10-15]. Based on the structure change between spirocyclic and open-cycle form, rhodamine-based fluorescent probes can distinguish a target from other species efficiently [16-18]. Normally, these spirocyclic compounds are non-fluorescent and colorless under neutral and basic conditions, while, under acid conditions, the spirocyclic form is open to restore the fluorescence intensity upon binding to H+, because the spirocyclic structure is highly sensitive to the environmental pH [19, 20]. Taking these advantages, in 2014, Yu's et al. synthesized two rhodamine-based pH probes via the click reaction [21]; Han's et al. reported N-(rhodamine B)-benzimidazole, featuring an intramolecular spirobenzimidazole, for selective sensing of protons via opening of the spiro-ring to give fluorescent and colored species [22]; Tan's et al. designed a rhodamine-morpholine fluorescent probe to detect lysosomal pH changes [23]; Zhao's et al. constructed a rhodamine– rhodamine-based pH probe [24]; Later in 2015, they further developed a rhodamine B-based fluorescent probe for lysosomal pH through integrating a 4-(2-aminoethyl)morpholine moiety, a lysosome-targetable group, into a rhodamine B fluorophore [25]. Though many rhodamine-based pH probes have been exploited, none of them can distinguish cancer cells from normal cells through a cellular pH aroused different fluorescent response. In 2015, Ge's et al. developed a pyridineium-2-yl Darrow Red analogue with a pKa of 2.4 for the selective detection of cancer cells [6]. Unfortunately, the status of normal cells cannot be visualized due to the absence of emission when the pH exceeds 4.0. A probe which can work well both in cancer and normal cells, and meanwhile can easily distinguish different cells on the basis of a cellular pH aroused different fluorescent response is highly desirable.
To fulfill this, a rhodamine B-based lysosomal pH probe was synthesized in our previous work [26], which can distinguish cancer cells from normal cells and detect tumors based on different fluorescent response. However, it should be noted that singleemission probe is easily affected by environmental factors such as laser intensity, temperature, viscosity, solvent polarity and concentration of analytes etc. To overcome this obstacle, ratiometric detection, which records the fluorescence output signal at two wavelengths simultaneously is emerging and their ratio is calculated for correlating with the concentration of analytes. Especially, ratiometric measurement can provide better accuracy with the built-in correction of two emission bands in a quantitative manner than that obtained by single-emission measurement, even in complicated biological samples [27-29]. In our previous work, ratiometric fluorescent detection of Pd2+ and cyanide ion have been performed [30, 31]. In recent years, some rhodamine-based ratiometric fluorescent probes have also been developed for pH detection. For instance, Liu et al. reported a rhodamine 6G hydrazide derivative that acted as a colorimetric and fluorescent "off-on" probe for the detection of pH [32]; Zhao's et al. developed a ratiometric lysosomal pH probe based on the coumarin–rhodamine fluorescence resonance energy transfer (FRET) system [33]; Tan et al. constructed an "off–on" colorimetric and fluorescent piperazine-rhodamine based pH chemosensor for extreme acidity [34]. Although most of them work well for lysosome imaging, none of them are able to distinguish normal and cancer cells through a cellular pH induced fluorescent response, because the intracellular pH difference between normal and cancer cells is not pretty much.
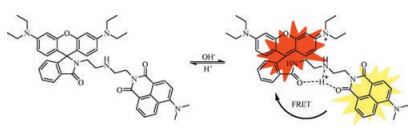
To continue our research, we designed and synthesized a new naphthalimide-rhodamine ratiometric pH probe RBN based on FRET in Scheme 1. The reason why naphthalimide was chosen here is that it has high electron affinity, excellent photostability, high fluorescent quantum yield, large Stoke's shift, and therefore has been widely used in many fields such as bioimaging [35]. Moreover, the emission spectrum of naphthalimide and the excitation spectrum of rhodamine have substantial overlap, which would fulfill a favourable platform for the FRET process [36]. In 2015, Zhao et al. designed a ratiometric lysosomal pH probe based on the naphthalimide-rhodamine system, which could provide ratiometric measurements of pH in the range of 4.50–5.50 [7]. Unfortunately, the pKa of the probe was 4.82 which was not suitable to distinguish the slight difference of lysosome pH between cancer and normal cell. To keep the fine pKa of 4.1 in our previous work [26], naphthalimide was grafted to rhodamine moiety through a simple acylation reaction (Scheme S1 in Supporting information). In this way, RBN was obtained with a pKa of 4.2. The emission intensity ratios of the naphthalimide moiety and the rhodamine moiety of RBN exhibited strong pHdependent performance and responded linearly to minor pH fluctuations within the range of 4.02–4.63, which provides more precise detection of cellular pH in a ratiometric manner. In particular, RBN not only showed excellent water solubility and low cell toxicity, but also displayed strong fluorescence in cancer cells while very weak fluorescence in normal cells, which can be employed to distinguish cancer cells from normal cells, indicating that RBN is indeed a ponderable probe.

|
Download:
|
| Scheme 1. The proposed mechanism of RBN for sensing H+. | |
Probe RBN was readily synthesized via the reaction of compounds 1 and 2 (Scheme S1). The final compound was fully characterized by 1H NMR, 13C NMR and HRMS (Figs. S1–S3 in Supporting information). RBN was designed as a ratiometric pH probe based on the FRET mechanism, comprising of a naphthalimide donor and a rhodamine acceptor. For an efficient FRET system, the spectral overlap between the emission spectrum of a donor and the absorption spectrum of an acceptor was essentially important. The absorption spectra and the emission spectra of RBN (5 μmol/L) at different pH values are shown in Fig. S4 (Supporting information) and Fig. 1a. Notably, the naphthalimide donor in RBN exhibited a broad emission band in the visible region (450– 650 nm) and maximum emission at 540 nm when excited at 480 nm. Moreover, the rhodamine acceptor showed the absorption region (500–650 nm) with the maximum absorption peak at 560 nm, overlapping with the donor emission spectrum significantly. Thus, the substantial spectral overlap would fulfill a favorable condition for the FRET process. Under neutral and basic conditions, the rhodamine moiety existed in the non-fluorescent spirocyclic form, so the fluorescence of RBN was completely attributed to the naphthalimide donor. On the other hand, RBN was ring-opened under acid conditions and the fluorescence of the naphthalimide donor would transfer to the rhodamine acceptor through FRET. As shown in Fig. S5 (Supporting information), RBN shows excellent water solubility, which is quite significant for potential biological applications.

|
Download:
|
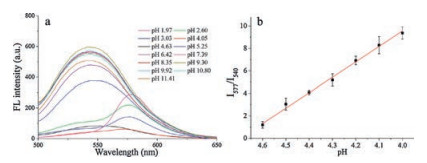
| Fig. 1. (a) Fluorescence spectra of RBN (5 μmol/L) in the B-R-E solution (BrittonRobinson buffer, which was mixed by 40 mmol/L acetic acid, boric acid, and phosphoric acid) at different pH values; and (b) the plot of the emission ratios (I577/I540) versus pH values. λex = 480 nm. | |
Optical properties of RBN were further studied. As indicated in Fig. S4, no absorption was noticed over 500 nm under neutral and basic conditions. While under acid conditions, obvious absorption peak of the rhodamine moiety at 560 nm can be observed. The results of fluorescence spectra at diverse pH values of RBN were consistent with the results of absorption spectra (Fig. 1a). Under neutral and basic conditions, RBN exhibited the stable fluorescence of naphthalimide at 540 nm (λex = 480 nm), which was not influenced by different pH values. Whereas, as the pH value decreased from 7.39, the emission band of naphthalimide centred at 540 nm decreased gradually. Meanwhile, a strikingly new peak evolved at 577 nm and increased gradually. The observation could be ascribed to the structure change of the rhodamine moiety at different pH values. The rhodamine moiety existed in the non-fluorescent spirocyclic form under neutral and basic conditions. As the pH value decreased, the spirocyclic form is converted to the fluorescent ring-opening form due to the H-bonding interaction [25, 38] between protonated piperazine N, rhodamine lactam O and naphthalimide carbonyl O, which was investigated using 1H NMR spectroscopy (Fig. S6 in Supporting information). The ring-opening form of rhodamine was an effective energy acceptor, and the FRET process from the naphthalimide donor to the rhodamine acceptor occurred accordingly. Thus, the emission peak of rhodamine increased concomitantly (Scheme 1). Ratios of the fluorescence emission intensities (I577/I540) as a function of pH are described in Fig. 1b. The ratio showed a good linear relation from pH 4.63–4.02. The pKa of the probe was calculated to be 4.2 using the HendersonHasselbalch equation [37], indicating its capability of biological application.
To check the practical application of RBN, the interference experiment was performed to estimate the influence caused by various metal ions (Ag+, Al3+, Ba2+, Ca2+, Cd2+, Ce3+, Co2+, Cr3+, Cu2+, Fe2+, Fe3+, Hg2+, K+, Li+, Mg2+, Mn2+, Na+, Ni2+, Pb2+, Zn2+), which may be present in the systems being analyzed. Moreover, some other anions (Br-, CH3COO-, Cl-, ClO4-, CO32-, F-, HCO3-, I-, NO2-, NO3-, P2O74-, S2-, S2O32-, SCN-, SO42-, SO32-) were also tested. At pH 4.63, the addition of those analytes caused no appreciable spectroscopic changes under the testing conditions (Fig. S7 in Supporting information). Similarly, the probe had no response to the above mentioned co-existing analytes at pH 7.39 (Fig. S8 in Supporting information). Therefore, probe RBN could be used to respond to acidic pH without interference from the complex intracellular environment.
Then, Fluorescence imaging and distribution of RBN was studied in living cells. Firstly, to evaluate the cell membrane permeability of RBN, imaging was monitored in the red channel with a 559 nm laser irradiation under a confocal laser scanning microscope. As shown in Fig. S9 (Supporting information), the probe can stain the human liver carcinoma cells (HepG-2 cells) in 30 min and focused mainly in the cytoplasm, demonstrating its good membrane permeability.
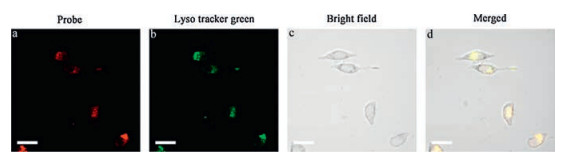
To further study the subcellular distribution of RBN, we used commercial Lyso Tracker Green to co-stain with the probe. After incubating with 5 μmol/L RBN for 30 min, HepG-2 cells were further stained with 1 μmol/L Lyso Tracker Green for 10 min. As shown in Fig. 2, the red emission of probe was almost overlapped with the green emission of Lyso Tracker Green. Further, human breast adenocarcinoma cells (MCF-7 cells) were also tested obtaining the consistent results (Fig. S10 in Supporting information).

|
Download:
|
| Fig. 2. Co-localization experiments of HepG-2 cells incubated with RBN for 30 min and then incubated with LysoTracker Green for 10 min. (a) Confocal image from RBN on red channel (λ = 559 nm); (b) Confocal image from LysoTracker Green on green channel (λ = 488 nm); (c) Bright field; (d) Merged image of a–c. Scale bar: 20 μm. | |
Furthermore, confocal fluorescent imaging was performed in HepG-2 cells and human normal liver cells (HL-7702 cells) using RBN. As shown in Fig. 3, RBN showed very intense red emission in HepG-2 cells, while only slightly weaker emission was observed in HL-7702 cells. To provide further evidence, cancer cell lines (MCF-7, PC-3) and normal cell lines (HUVEC) were used to repeat imaging (Fig. S11–S13 in Supporting information). The results indicate that for normal cells, such as HUVEC and HL-7702, only weak emission was found after incubation for 30 min, while, strong red emission can be observed for the above mentioned cancer cells in 30 min.

|
Download:
|
| Fig. 3. CLSM images of HepG-2 cells and HL-7702 cells incubated with RBN for 30 min: (a) and (d) fluorescence of probe; (b) and (e) bright field; (c) and (f) merged image. Scale bar: 20 μm. | |
In addition, to monitor lysosomal pH, RBN was incubated with five different cell lines for cellular imaging, and both green channel (490–550 nm) and red channel (550–610 nm) were recorded (Fig. S14a in Supporting information) respectively. Take HepG-2 cells and HL-7702 cells as examples, to compare the corresponding intensity, six arbitrarily fluorescent areas in every image were chosen to represent the lysosomal regions of the HepG-2 cells and HL-7702 cells, respectively. The values obtained were subsequently averaged for each case (Fig. S14b in Supporting information). And the results indicated that the intensity ratio (Iredchannel/Igreenchannel) of HepG-2 cells was indeed higher than that of HL-7702 cells (Fig. S14c in Supporting information), demonstrating that the acidity of lysosomes in cancer cells is lower than that in normal cells which is consistent with the results reported in previous literature [6]. The different fluorescent responses of RBN can be employed to separate cancer cells from normal cells. Moreover, the relative errors of the intensity ratio (Iredchannel/Igreenchannel) of both HepG2 cells and HL-7702 cells were much lower than that of the corresponding fluorescence intensity obtained from either red channel or green channel alone. The same trend can be observed in the case of the other cell lines (Fig. S14d and e in Supporting information), indicating that ratiometric measurement can provide better accuracy with the built-in correction of two emission bands in a quantitative manner than that obtained by single-emission measurement, even in complicated biological samples.
Besides, the effect of RBN on the cell viability of HepG-2 cells was investigated (Fig. S15 in Supporting information). After 24 h of cellular internalization of the probe RBN at the concentration of 2.5 μmol/L, 5 μmol/L, 10 μmol/L and 20 μmol/L, the cell viability was measured by MTT assay respectively. It could be concluded that the probe was not toxic to cells under the experimental conditions.
In summary, a FRET-based ratiometric pH probe RBN was developed. It could provide ratiometric measurements of pH in the range of 4.02–4.63. The probe showed low cytotoxicity and excellent water solubility. Especially, RBN can distinguish cancer cells from normal cell through a cellular pH induced different fluorescent response, which is quite significant for potential caner diagnose and therapy.
AcknowledgementThis work was financially supported by the National Natural Science Foundation of China (Nos. 21272030, 21472016, 21306019, 21576042).
Appendix A. Supplementary dataSupplementary data associated with this article can be found, in the online version, at http://dx.doi.org/10.1016/j.cclet.2017.09.014.
| [1] |
J.R. Casey, S. Grinstein, J. Orlowski, Nat. Rev. Mol. Cell Biol. 11(2010) 50-61. DOI:10.1038/nrm2820 |
| [2] |
H. Izumi, T. Torigoe, H. Ishiguchi, et al., Cancer Treat. Rev. 29(2003) 541-549. DOI:10.1016/S0305-7372(03)00106-3 |
| [3] |
G.K. Vegesna, J. Janjanam, J. Bi, et al., J. Mater. Chem. B 2(2014) 4500-4508. DOI:10.1039/C4TB00475B |
| [4] |
F. Yu, Y. Wang, W. Zhu, et al., RSC Adv. 4(2014) 36849-36853. DOI:10.1039/C4RA06834C |
| [5] |
J. Han, K. Burgess, Chem. Rev. 110(2009) 2709-2728. |
| [6] |
D.D. He, W. Liu, R. Sun, et al., Anal. Chem. 87(2015) 1499-1502. DOI:10.1021/ac5045912 |
| [7] |
X.F. Zhang, T. Zhang, S.L. Shen, J.Y. Miao, B.X. Zhao, J. Mater. Chem. B 3(2015) 3260-3266. DOI:10.1039/C4TB02082K |
| [8] |
M.H. Lee, N. Park, C. Yi, et al., J. Am. Chem. Soc. 136(2014) 14136-14142. DOI:10.1021/ja506301n |
| [9] |
J.Y. Han, K. Burgess, Chem. Rev. 110(2010) 2709-2728. DOI:10.1021/cr900249z |
| [10] |
Y. Long, J. Zhou, M.P. Yang, B.Q. Yang, Chin. Chem. Lett. 27(2016) 205-210. DOI:10.1016/j.cclet.2015.09.003 |
| [11] |
Q.J. Luo, Y.X. Li, M.Q. Zhang, P. Qiu, Y.H. Deng, Chin. Chem. Lett. 28(2017) 345-349. DOI:10.1016/j.cclet.2016.10.024 |
| [12] |
Y. Gao, J.L. Li, Z. Shi, Chin. Chem. Lett. 18(2007) 667-669. DOI:10.1016/j.cclet.2007.04.007 |
| [13] |
H.R. Cheng, Y. Qian, Chin. Chem. Lett. 27(2016) 879-886. DOI:10.1016/j.cclet.2016.01.039 |
| [14] |
X.M. Li, R.R. Zhao, Y.L. Wei, et al., Chin. Chem. Lett. 27(2016) 813-816. DOI:10.1016/j.cclet.2016.04.001 |
| [15] |
X.M. Li, R.R. Zhao, Y. Yang, et al., Chin. Chem. Lett. 28(2017) 1258-1261. DOI:10.1016/j.cclet.2016.12.029 |
| [16] |
K.K. Yu, K. Li, J.T. Hou, et al., RSC Adv. 4(2014) 33975-33980. DOI:10.1039/C4RA05215C |
| [17] |
R. Zhang, F. Yan, Y. Huang, et al., RSC Adv. 6(2016) 50732-50760. DOI:10.1039/C6RA06956H |
| [18] |
Y. Yang, C.Y. Gao, J. Liu, D. Dong, Anal. Methods U. K. 8(2016) 2863-2871. DOI:10.1039/C6AY00135A |
| [19] |
X.X. Zhao, X.P. Chen, S.L. Shen, et al., RSC Adv. 4(2014) 50318-50324. DOI:10.1039/C4RA07555B |
| [20] |
Z. Li, S. Wu, J. Han, S. Han, Analyst 136(2011) 3698-3706. DOI:10.1039/c1an15108h |
| [21] |
K.K. Yu, K. Li, J.T. Hou, et al., RSC Adv. 4(2014) 33975-33980. DOI:10.1039/C4RA05215C |
| [22] |
Z. Xue, M. Chen, J. Chen, J. Han, S. Han, RSC Adv. 4(2014) 374-378. DOI:10.1039/C3RA45329D |
| [23] |
X.L. Shi, G.J. Mao, X.B. Zhang, et al., Talanta 130(2014) 356-362. DOI:10.1016/j.talanta.2014.07.030 |
| [24] |
X.X. Zhao, X.P. Chen, S.L. Shen, et al., RSC Adv. 4(2014) 50318-50324. DOI:10.1039/C4RA07555B |
| [25] |
S.L. Shen, X.P. Chen, X.F. Zhang, J.Y. Miao, B.X. Zhao, J. Mater. Chem. B 3(2015) 919-925. |
| [26] |
B. Li, G.B. Ge, L.L. Wen, et al., Dyes Pigm. 139(2017) 318-325. DOI:10.1016/j.dyepig.2016.12.043 |
| [27] |
N. Lin, Q. Zhang, X. Xia, et al., RSC Adv. 7(2017) 21446-21451. DOI:10.1039/C6RA28551A |
| [28] |
Y. Zhang, B. Li, H. Ma, L. Zhang, W. Zhang, J. Mater. Chem. C 5(2017) 4661-4669. DOI:10.1039/C7TC00936D |
| [29] |
T.F. Brewer, G. Burgos-Barragan, N. Wit, K.J. Patel, C.J. Chang, Chem. Sci. 8(2017) 4073-4081. DOI:10.1039/C7SC00748E |
| [30] |
P.F. Xing, Y.Q. Xu, H.J. Li, et al., Sci. Rep. 5(2015) 16528. DOI:10.1038/srep16528 |
| [31] |
S.G. Sun, B. Qiao, N. Jiang, et al., Org. Lett. 16(2014) 1132-1135. DOI:10.1021/ol500284p |
| [32] |
L. Liu, P. Guo, L. Chai, et al., Sens. Actuators B:Chem. 194(2014) 498-502. DOI:10.1016/j.snb.2013.12.023 |
| [33] |
X.F. Zhang, T. Zhang, S.L. Shen, J.Y. Miao, B.X. Zhao, RSC Adv. 5(2015) 49115-49121. DOI:10.1039/C5RA06246B |
| [34] |
J.L. Tan, M.X. Zhang, F. Zhang, et al., Spectrochim. Acta A 140(2015) 489-494. DOI:10.1016/j.saa.2014.12.110 |
| [35] |
J. Zhang, G. Li, C. Kang, et al., Dyes Pigm. 115(2015) 181-189. DOI:10.1016/j.dyepig.2015.01.002 |
| [36] |
N.Z. Xu, M.M. Liu, M.A. Ye, et al., J. Lumin. 188(2017) 135-140. DOI:10.1016/j.jlumin.2017.03.067 |
| [37] |
R. de Levie, J. Chem. Educ. 80(2003) 146-146. DOI:10.1021/ed080p146 |
| [38] |
P. Wang, J. Liu, X. Lv, et al., Org. Lett. 14(2012) 520-523. DOI:10.1021/ol203123t |