 2017, Vol. 28


b Lab of Biosystem and Microanalysis, State Key Laboratory of Bioreactor Engineering, East China University of Science and Technology, Shanghai 200237, China
Selenium (Se), as a biologically essential trace element, plays vital roles in many physiological processes, such as cellular immune responses, inflammation protection, redox balance, and cancer prevention [1]. Inorganic element, Se, can be converted to organic forms, containing hydrogen selenide, selenocysteine (Sec), selenite, selenophosphate, selenodiglutathione, and charged SectRNA by biological systems [2]. Sec is a cysteine (Cys) analogue with a selenium-containing selenol group, which replaces the hydrosulfuryl group in Cys. It is genetically recognized as the 21st amino acid, and exists as the major form of selenium and can be incorporated into selenoproteins (SePs) in living organisms [3]. SePs have been confirmed to correlate with various cellular function and some diseases, for instance, inflammations, cardiovascular diseases, and cancers [4-9]. As the essential building block for SePs, Sec carries out the majority of the function of the various Se-containing species in living systems [10]. Thus, it is significant to develop selective, sensitive and biocompatible detection methods for rapid identification and visualization intracellular Sec.
Fluorescence sensing and imaging have emerged as the powerful tools to monitor and visualize trace amounts of analytes in complicated biological system due to their high sensitivity and spatiotemporal resolution [11-15]. However, development of specific fluorescent probes for monitoring selenol without suffering from the interference from biological thiols (such as glutathione) at the cellular level still remains challenging, in term of the high concentration of thiols (millimolar levels) in cells [16-19]. So far, some fluorescent probes have been developed for sensing Sec in cells [20-25], however, these probes still cannot meet the expectation when they are used in real application. For example, in addition to Sun's and Areti's Works [22, 25], these probes display low signal-to-background ratio (S/B < 150) due to the high background fluorescence of probes (Table S1 in Supporting information). And most of the developed probes are not used to detect selenol under oxidative stress and study the relationship between cellular selenol and oxidative stress. Therefore, there's still a large demand to fabricate new fluorescent probes with improved properties including ultralow background fluorescence, high selectivity and high sensitivity.
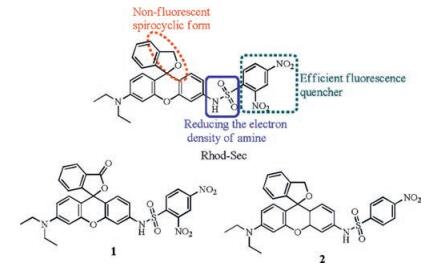
To obtain fluorescent probes with ultralow background fluorescence for sensing selenol, 2, 4-dinitrobenzenesulfonyl as quenching and recognition group was incorported into aminerhodamine. On the other hand, dinitrobenzenesulfonyl can quench the fluorescence of rhodamine via donor photoinduced electron transfer (d-PET) [26] and reducing the electron density of amine in rhodamine. In order to further reduce probe's background fluorescence, the carboxylic acid group of rhodamine dye was reduced to hydroxymethyl group, ensuring that the probe retain a non-fluorescent spirocyclic form in physiological condition (Scheme 1) [27, 28]. As a result, the obtained rhodamine should be almost non-fluorescence through multi-quenching effects. Consequently, the S/B of the probe after selenol treatment can be significantly improved. To this end, hydroxymethyl rhodaminebased fluorescent selenol probe Rhod-Sec with significant off-on response rationally was designed and synthesized (Scheme 1). In addition, compounds 1 and 2 are designed and synthesized working as control probes (Scheme 1).

|
Download:
|
| Scheme 1. The design and structures of candidate probes. | |
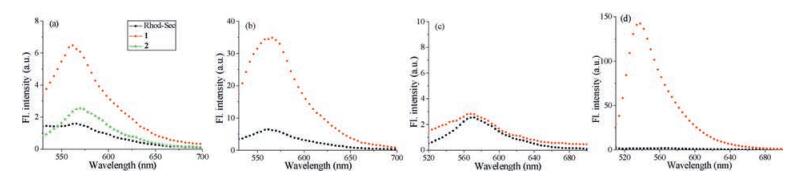
Probe Rhod-Sec, and reference compounds 1 and 2 were synthesized by sulfonylation the amine of rhodamine and characterized by 1H NMR, 13C NMR and HRMS (see Supporing information). As a proof-of-concept, the emission spectra of RhodSec, compounds 1 and 2 toward Sec was examined in PBS (pH 7.4, 1% DMSO). As shown in Fig. 1, compared with the compounds 1 and 2, probe Rhod-Sec displays very weak fluorescence under same condition, which indicates that both hydroxymethyl group and dPET play a vital role in reducing the background fluorescence of rhodamine-based probes. What's more, modest (5.4-fold) or negligible (1.1-fold) fluorescence enhancement were obtained after compound 1/2 reacting with Sec (preparation of the stock solution of Sec, see Supporing information), respectively (Figs. 1 and S1 in Supporting information). As expected, Rhod-Sec displays more significant fluorescence increase to Sec (50 μmol/L) than reference compounds 1 and 2 (Fig. 1). These results demonstrated our design that the rhodamine fluorescence in Rhod-Sec is heavily quenched through combined usage of multi-quenching mechanisms.

|
Download:
|
Fig. 1. Fluorescence spectra of probes 1, 2, and Rhod-Sec (5 μmol/L) (a), probes 1 (b), 2 (c) and Rhod-Sec (d) (5 μmol/L) in the absence (■) and presence of 50 μmol/L Sec ( |
|
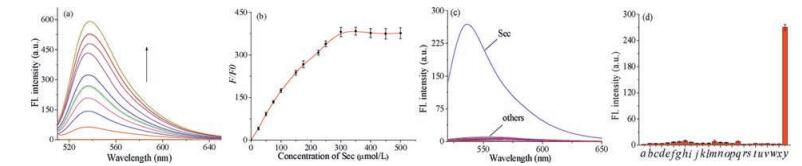
We then further investigated the sensing ability of Rhod-Sec to detect Sec in PBS buffer solution (25 mmol/L, 1% DMSO, pH 7.4) (Figs. 2a and S2 in Supporting informaiton). As shown in Fig. 2a, the free probe exhibits extremely low fluorescence under this condition. However, a dramatic fluorescence turn-on response at 538 nm (up to 380-fold) was observed upon addition of (Sec)2 (150 μmol/L) and DTT (150 μmol/L) (Fig. 2b). To the best of our knowledge, this large off-on response is the biggest among all of the reported fluorescent selenol probes (Table S1 in Supporting information) [20-25]. In addition, the fluorescence intensities at 538 nm have an excellent linear relationship with the concentrations of Sec (Fig. S3 in Supporting informaiton). The detection limit of Rhod-Sec for Sec was calculated to be ~28 nmol/L (S/N = 3), indicating that probe Rhod-Sec can be used to quantitatively detect Sec with high sensitivity. In addition, the probe Rhod-Sec is capable of responding rapidly to Sec, and the reaction was almost completed within 25 min (Fig. S4 in Supporting information). The pH effect studies suggest that the probe Rhod-Sec is suitable for detecting Sec in a widely pH range (Fig. S5 in Supporting informaiton).

|
Download:
|
| Fig. 2. (a) Fluorescence emission spectra of Rhod-Sec (5 μmol/L) in the presence of increasing concentrations of Sec at 37 ℃ in PBS (pH 7.4, containing 1% DMSO as a cosolvent); (b) Fluorescence intensity ratio (F/F0) changes at 538nm of Rhod-Sec (5 μmol/L) with increasing concentrations of Sec at 37 ℃ in PBS. Sec was generated by the treatment of equal molar (Sec)2 with DTT. (c, d) Fluorescence response of probe Rhod-Sec (5 μmol/L) with various analytes in PBS buffer (pH 7.4, containing 1% DMSO as a cosolvent). a, blank; b, Ca2+; c, Na+; d, K+; e, Mg2+; f, Zn2+; g, Cys; h, GSH; i, Hcy; j, Phe; k, Ala; l, Gly; m, Tyr; n, Arg; o, Lys; p, Trp; q, DTT; r, H2O2; s, HOCl; t, HNO; u, O2·-; v, ·OH; w, H2S; x, PhSH; y, Sec. Except for GSH (2 mmoI/L), the concentrations of all other analytes are 100 μmol/L. The data was recorded after incubation of Rhod-Sec with various reactive species for 30 min at 37 ℃. Data are expressed as mean ± SD for n = 3.λex/λem = 490/538 nm. | |
The reaction of Rhod-Sec with Sec was tested using mass spectra and 1HNMR. After addition of Sec, a peak at m/z 373.2 was observed, consistent with that of the expected product, Rhod-NH2 (Fig. S6 in Supporting information). 1H NMR analyses further confirm the production of Rhod-NH2 after separation and purification the reaction mixture (Fig. S7 in Supporting information). These results demonstrated that Rhod-Sec actually reacted with Sec to generate Rhod-NH2 as showed in Scheme S2 in Supporting information.
Next, we texted the selectivity of the Rhod-Sec toward various species including amino acids (Phe, Arg, Gly, Tyr, Trp, Ala, and Lys), metal ions (Ca2+, Mg2+, Na+, Zn+ and K+), thiols (Cys, Hcy, GSH, H2S, PhSH and DTT) and reactive oxygen/nitrogen species (H2O2, HOCl, HNO, O2·-, ·OH). As shown in among these analytes, only addition of Sec can induce an obvious fluorescence enhancement, while other species showed negligible changes. In addition, fluorescence intensity of Rhod-Sec remained essentially unchanged in the presence of other species (Fig. S8 in Supporting information), indicating negligible interferences from other competing species towards the probe. These results collectively proved the high selectivity of the developed probe to Sec over other biological relevant species.
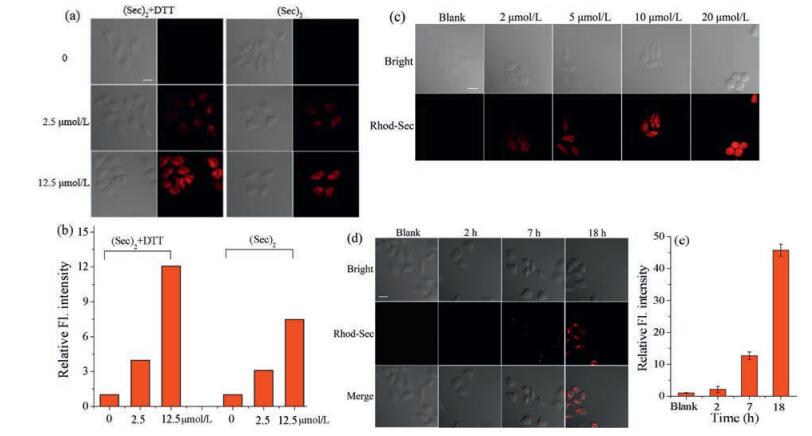
Encouraged by the above results, fluorescent sensing and imaging of selenol ex vivo was examined by using living HepG2 cells to explore the potential application of Rhod-Sec. We first investigated the response of probe Rhod-Sec to the exogenous Sec in cells at different concentrations. As shown in Fig. 3a and b, when the cells were treated with the free probe for 20 min, almost no fluorescence was observed. However, when the cells were pretreated with equal molar (Sec)2 with DTT (0–12.5 μmol/L), and then incubated with Rhod-Sec, a dose-dependent intracellular fluorescence was observed. Slightly less enhancement of fluorescence was also observed after only pre-incubation of cells with 0– 12.5 μmol/L (Sec)2 for 12 h (Fig. 3a and b). These results demonstrate the usage of Rhod-Sec to monitor the level of Sec, and implying that Sec can be from the transformation of (Sec)2 in living cells. We then confirm the distribution of probe at subcellular levels (Fig. S9 in Supporting informaion), and the results suggested that Rhod-Sec was mainly distributed in mitochondria (Pearson's correlation coefficient: 0.91). Moreover, the cytotoxicity of Rhod-Sec was performed by MTT assay in HepG2 cells (Fig. S10 in Supporting information), which indicated that the probeis nontoxictocells after24h incubation at thetested concentration.

|
Download:
|
| Fig. 3. (a) Confocal fluorescentimages of Sec in HepG2 cells with probeRhod-Sec. Columns 1 and 3: bright field images; Columns 2 and 4: fluorescence images.Row 1: HepG2 cellsweretreated with Rhod-Sec (5 μmol/L)for 20min; Rows 2 and 3: HepG2 cellswerepre-incubated Sec (2.5 μmol/L)(Sec)2+2.5 μmol/LDTT(or only 2.5 μmol/L (Sec)2) for 12h, and then treated with the Rhod-Sec (5 μmol/L) for 20min, respectively; Row 3: HepG2 cells were pre-incubated Sec (12.5μmol/L (Sec)2 and 12.5 μmol/L DTT (or 12.5 μmol/L (Sec)2)) for 12h, and then treated with the Rhod-Sec (5 μmol/L) for 20min, respectively. (b) Relative average fluorescence intensity shown in (a). Data are expressed as mean ±SD for n=3. (c) Confocal fluorescence images of HepG2 cells exposed to different concentrations of sodium selenite (0–20 μmol/L) for 12h. Column 1: The HepG2 cells were treated with 5μmol/L Rhod-Sec; Column 2–5: The HepG2 cells were pre-treated with different concentrations of sodium selenite (2–20 μmol/L Na2SeO3) for 12h, and then treated with 5μmol/L probe Rhod-Sec for 20min, respectively. (d) Confocal fluorescence images of HepG2 cells exposed to LPS (6 μg/mL) for different time (0–18h) and then incubated with Rhod-Sec (5 μmol/L) for 20min, respectively. Row 1: Bright field image; Row 2: Emission from the red channel; and Row 3: overlay of the bright field image and red channel. (e) Relative average fluorescence intensity shown in (d). Data are expressed as mean ±SD for n=3. Excitation wavelength at 488nm. The emission band at 530–600nm. Scale bar=10 μm. | |
Inspired by the above results of imaging exogenous Sec in living cells, we further proceeded to examine the capability of the probe to monitor endogenous Sec produced in living HepG2 cells by sodium selenium (Na2SeO3), a precursor of Sec biosynthesis, which can significantly increase the Sec level in cells [29]. As shown in Figs. 3c and S11 in Supporting information, when HepG2 cells were treated with different concentration sodium selenite (0–20 μmol/ L) for 12h and then treated with Rhod-Sec for 20min, a noticeable dose-dependent intracellular fluorescence enhancement were observed. In addition, an obvious fluorescence enhancement was also observed when the cells were incubated with 5– 20 μmol/L of SeO2 (another cellular selenol precursor) [23] for 12h and then incubated with Rhod-Sec for 20min (Fig. S12 in Supporting information). Taken together, these results indicate that Rhod-Sec is capable of detecting and imaging both exogenous and endogenous Sec in living cells.
It was reported that the living cells possess self-repairing function to achieve a redox balance after oxidative damage and inflammation, to some extent, which could be usually associated with selenol species [30]. Therefore, an in vitro oxidative stress model was established in which HepG2 cells were imaged after exposure to lipopolysaccharide (LPS) [31, 32]. As shown in a slight fluorescence enhancement was observed after the HepG2 cells were pre-incubated with LPS for 2 and 7 h and then were treated with Rhod-Sec for 20 min, an evident fluorescence enhancement were observed when the cells were pre-incubated with LPS for 18 h. These results indicated that intracellular selenol level will be up-regulated to against oxidative stress. This is the first work that reported the relationship between selenol level and oxidative stress with fluorescent probes till now.
In summary, we have rationally designed and synthesized a kind of "off-on" fluorescent probe, Rhod-Sec for specific detection of selenol. Rhod-Sec exhibits high sensitivity and selectivity toward selenol under physiological conditions. Notably, the probe with ultralow background fluorescence showed a 380-fold fluorescence signal enhancement in the presence of Sec. Importantly, we have demonstrated that the nontoxic Rhod-Sec is well suitable for detecting and imaging both exogenous and endogenous selenol in living cells, and it can be applied to successfully visualize the selenol level in HepG2 cells as a result of LPS-induced cells oxidation resistance for the first time.
AcknowledgmentsThis work was financially supported by the National Natural Science Foundation of China (Nos. 21622504, 21302050), the Hunan Provincial Natural Science Foundation of China (Nos. 14JJ2047), the Hunan University Fund for Multidisciplinary Developing (Nos. 2015JCA04), and Open Funding Project of the State Key Laboratory of Bioreactor Engineering.
Appendix A. Supplementary dataSupplementary data associated with this article can be found, in the online version, at http://dx.doi.org/10.1016/j.cclet.2017.08.021.
| [1] |
L. Schomburg, U. Schweizer, J. Kçhrle, Cell. Mol. Life Sci. 61(2004) 1988-1995. |
| [2] |
C.M. Weekley, H.H. Harris, Chem. Soc. Rev. 42(2013) 8870-8894. DOI:10.1039/c3cs60272a |
| [3] |
L. Johansson, G. Gafvelin, E.S. Arner, Biochim. Biophys. Acta 1726(2005) 1-13. DOI:10.1016/j.bbagen.2005.05.010 |
| [4] |
X. Du, C. Wang, Q. Liu, Curr. Top. Med. Chem. 16(2016) 835-848. |
| [5] |
M. Kucharzewski, J. Braziewicz, U. Majewska, S. Gozdz, Biol. Trace Elem. Res. 88(2002) 25-30. DOI:10.1385/BTER:88:1 |
| [6] |
J.R. Encinar, D. Schaumloffel, Y. Ogra, R. Lobinski, Anal. Chem. 76(2004) 6635-6642. DOI:10.1021/ac049280h |
| [7] |
G. Ballihaut, L.E. Kilpatrick, W.C. Davis, Anal. Chem. 83(2011) 8667-8674. DOI:10.1021/ac2021147 |
| [8] |
S.J. Fairweather-Tait, Y. Bao, M.R. Broadley, et al., Antioxid. Redox Signal. 14(2011) 1337-1383. DOI:10.1089/ars.2010.3275 |
| [9] |
S. Tanguy, S. Grauzam, J. de Leiris, F. Boucher, Mol. Nutr. Food Res. 56(2012) 1106-1121. DOI:10.1002/mnfr.201100766 |
| [10] |
D.L. Hatfield, P.A. Tsuji, B.A. Carlson, V.N. Gladyshev, Trends Biochem. Sci. 39(2014) 112-120. DOI:10.1016/j.tibs.2013.12.007 |
| [11] |
W. Xu, Z.B. Zeng, J.H. Jiang, Y.T. Chang, L. Yuan, Angew. Chem. Int. Ed. 55(2016) 13658-13699. DOI:10.1002/anie.201510721 |
| [12] |
S.L. Shen, X.P. Chen, X.F. Zhang, J.Y. Miao, B.X. Zhao, J. Mater. Chem. B 3(2015) 919-925. |
| [13] |
X. Gao, X. Li, L. Li, J. Zhou, H. Ma, Chem. Commun. 51(2015) 9388-9390. DOI:10.1039/C5CC02788H |
| [14] |
T.F. Brewer, C.J. Chang, J. Am. Chem. Soc. 137(2015) 10886-10889. DOI:10.1021/jacs.5b05340 |
| [15] |
D. Cheng, Y. Pan, L. Wang, et al., J. Am. Chem. Soc. 139(2017) 285-292. DOI:10.1021/jacs.6b10508 |
| [16] |
X. Chen, Y. Zhou, X. Peng, J. Yoon, Chem. Soc. Rev. 39(2010) 2120-2135. DOI:10.1039/b925092a |
| [17] |
K. Xu, M. Qiang, W. Gao, et al., Chem. Sci. 4(2013) 1079-1086. DOI:10.1039/c2sc22076h |
| [18] |
D. Jung, S. Maiti, J.H. Lee, J.H. Lee, J.S. Kim, Chem. Commun. 50(2014) 3044-3047. DOI:10.1039/c3cc49790a |
| [19] |
J. Liu, Y.Q. Sun, H. Zhang, et al., Chem. Sci. 5(2014) 3183-3188. DOI:10.1039/c4sc00838c |
| [20] |
F. Kong, B. Hu, Y. Gao, et al., Chem. Commun. 51(2015) 3102-3105. DOI:10.1039/C4CC06359G |
| [21] |
H. Maeda, K. Katayama, H. Matsuno, T. Uno, Angew. Chem. Int. Ed. 45(2006) 1810-1813. DOI:10.1002/(ISSN)1521-3773 |
| [22] |
Q. Sun, S.H. Yang, L. Wu, et al., Anal. Chem. 88(2016) 6084-6091. DOI:10.1021/acs.analchem.6b01545 |
| [23] |
B. Zhang, C. Ge, J. Yao, et al., J. Am. Chem. Soc. 137(2015) 757-769. DOI:10.1021/ja5099676 |
| [24] |
M.X. Li, W.Y. Feng, Q.S. Zhai, G.Q. Feng, Biosens. Bioelectron. 87(2017) 894-900. DOI:10.1016/j.bios.2016.09.056 |
| [25] |
S. Areti, S.K. Verma, J. Bellare, C.P. Rao, Anal. Chem. 88(2016) 7259-7267. DOI:10.1021/acs.analchem.6b01518 |
| [26] |
Z. Huang, S. Ding, D. Yu, F. Huang, G. Feng, Chem. Commun. 50(2014) 9185-9187. DOI:10.1039/C4CC03818E |
| [27] |
M. Kamiya, D. Asanuma, E. Kuranaga, et al., J. Am. Chem. Soc. 133(2011) 12960-12963. DOI:10.1021/ja204781t |
| [28] |
M. Sakabe, D. Asanuma, M. Kamiya, et al., J. Am. Chem. Soc. 135(2013) 409-414. DOI:10.1021/ja309688m |
| [29] |
G.V. Kryukov, S. Castellano, S.V. Novoselov, et al., Science 300(2003) 1439-1443. DOI:10.1126/science.1083516 |
| [30] |
C.M. Weekley, H.H. Harris, Chem. Soc. Rev. 42(2013) 8870-8894. DOI:10.1039/c3cs60272a |
| [31] |
E. Olm, A.P. Fernandes, C. Hebert, et al., Proc. Natl. Acad. Sci. U. S. A. 106(2009) 11400-11405. DOI:10.1073/pnas.0902204106 |
| [32] |
L. Bjorkhem-Bergman, K. Jonsson, L.C. Eriksson, et al., Biochem. Pharmacol. 63(2002) 1875-1884. DOI:10.1016/S0006-2952(02)00981-4 |