 2017, Vol. 28

 ,
Jordi Farjasb,
Xavier Fontrodonab,
Mohamed Dammaka
,
Jordi Farjasb,
Xavier Fontrodonab,
Mohamed Dammaka b University of Girona, Campus Montilivi, Edif. PⅡ, E17071 Girona, Catalonia, Spain
The revolutionary increase in the number of synthesized and structurally characterized coordination polymers in the last few decades reflects the effort devoted to the search for catalytic, conducting, luminescent, magnetic or porous materials [1, 2]. Besides, the use of tellurium as a potential node of the metalorganic framework allows a better understanding of the correlations between structural features and physical characteristic [3]. In addition, Te atoms act as a part of the heterometallic inorganic clusters [4, 5]. There are several types of interactions, such as the interaction with another metal [6, 7] or with halogens [8, 9]. Therefore, tellurium-coordination polymers are organic-inorganic hybrid materials with several potential applications [10].
Besides, there is a growing interest in m-Nitroaniline as nitrosubstituted derivatives of aromatic amines because aromatic amines are highly toxic and they are suspected of having carcinogenic properties [11]. For instance, 3-nitroaniline is extensively used to treat wastewater.
3-Nitroaniline contains three nitrogen atoms and three amino substituents and crystallizes as a hydrogen-bonded solid that comprises molecular tapes formed by C-H … N hydrogen bonds between the adjacent molecules. As a result, 3-nitroaniline represents an extremely interesting ligand system for supramolecular chemistry [12, 13]. Generally, the solid state complexation of m-nitroaniline with different organic and inorganic acids comprises mostly the weak hydrogen bonds of N-H…Cl and C…Cl types [14-16]. So, the use of 3-nitroaniline with hexahydrotellurate gives birth to a new [(C6H7N2O2)3 TeCl5·2Cl] complex. In this paper we report the synthesis of [C6H7N2O2]3TeCl5·2Cl single crystals. These crystals are characterized by XRD, FTIR and Raman studies. Their stability is characterized by means of thermal analysis.
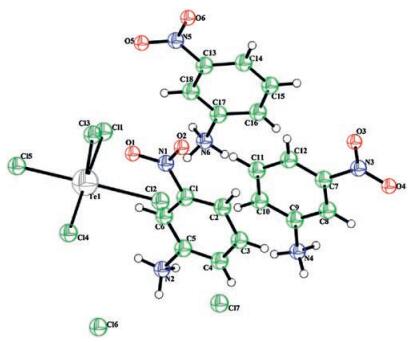
2. Results and discussion 2.1. Structure descriptionSingle crystal X-ray analysis shows that [C6H7N2O2]3TeCl5·2Cl compound crystallizes, at room temperature, in the space group (P-1) with two formula units in the unit cell (Z = 2). The cell dimensions are: a = 10.5330(11)Å, b = 10.6663(11)Å, c = 15.9751(16)Å, α = 82.090(2)°, β = 71.193(2)°, γ = 68.284(2)° and V = 1578.0(3)Å3. The asymmetric unit of the title compound is depicted in Fig. 1 and shows the presenceof an anionic entity formed bysquare pyramid [TeCl5]- entities, two isolated Cl- and three independent 3-nirtoanilinium [C6H7N2O2]+.

|
Download:
|
| Fig. 1. The asymmetric unit of [C6H7N2O2]3TeCl5·2Cl showing the atom-labeling scheme | |
Five chlorine atoms surround the tellurium atom in the anionic species and form a square-based pyramidal coordination. Indeed, the environment in the tellurium atom is characterized by five Te-Cl bonds. The Te-Cl distances are between 2.327(2)Å and 2.642(2)Å. Cl-Te-Cl bond angles fall in the range of 89.55(9)°-178.28(8)°. The selected bonds and angles are listed in Table S1 in Supporting information. The projection of the atomic arrangement of [C6H7N2O2]3TeCl5·2Cl compound in the (ac) plane is shown in Fig. S1 in Supporting information. The structure is parallel inorganic layers alternated by organic planes. Both planes are parallel to the (a b) one. The C-N bond lengths vary from 1.456(9)Å to 1.490(2)Å. C-C bond lengths vary from 1.353(15)Å to 1.402 (17)Å and angles C-C-C, N-C-C, C-N-O are between 114.7 (1)° and 126.9(1)°. In the title compound, the entire ring is planar and is built up by the atoms (C1, C2, C3, C4, C5, C6), (C7, C8, C9, C10, C11, C12), (C13, C14, C15, C16, C17, C18).
In the [(C6H7N2O2)3TeCl5·2Cl], the organic species interact with the inorganic group via N-H…Cl hydrogen bonds, as shown in Table S2 and in Fig. 2. Actually, there are six strong (3.089(7) and 3.184(7)Å) and four weak (3.279(6) and 3.581(7)Å) N-H…Cl hydrogen bonds [17]. The intermolecular hydrogen bonding contacts C-H…Cl provide a linkage between the (C6H7N2O2)+ entities and the [TeCl5]-anions (3.585(8)-3.646(9)Å).

|
Download:
|
| Fig. 2. Dotted lines: the intermolecular hydrogen bonds contacts of the title compound | |
2.2. Thermal analysis
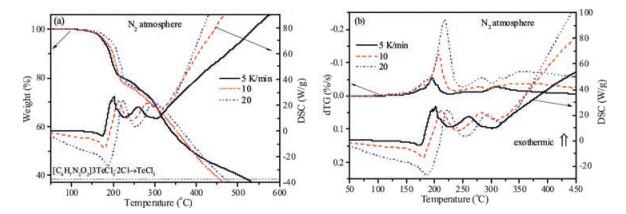
The evolution of the mass (TG signal) when the sample is submitted to a constant temperature rise is shown in Fig. 3. The sample is stable up to 130 ℃. The decomposition is triggered by an endothermic process. This endothermic process is not a melting or evaporation because it is thermally activated. The process shifts to higher temperature when the heating rate is increased [18]. Besides, the analysis of the morphology of the solid sample at 150 ℃ does not reveal any melting process.

|
Download:
|
| Fig. 3. Simultaneous TG-DSC evolution of [C6H7N2O2]3TeCl5·2Cl when the sample is submitted to a continuous heating ramp at different heating rates under N2 atmosphere: (a) TG-DSC signal, (b) DTG-DSC signal. The sample mass and the DSC signals are normalized to the initial sample mass | |
In Fig. 3.b, we have plotted the evolution of the time derivative of the TG signal (DTG) together with the DSC signal. Both parameters are directly related to the transformation rate and they allow an easier identification of the different stages of the decomposition process. Three decomposition stages can be clearly distinguished. The first of which is endothermic and appears as a shoulder in the DTG signal. As for the second stage, it is located around 200 ℃ and involves the larger mass loss. This stage is an exothermic process. Concerning the third stage, it is located approximately between 250 ℃ and 300 ℃ and is also an exothermic process. After the decomposition, the mass continues to decrease steadily because the final decomposition product is not stable. Indeed, the mass decreases up to 900 ℃ where no solid product is left.
2.3. Kinetic analysisIn this section we perform a kinetic analysis to determine the activation energy. Isoconversional methods allow the determination of the kinetic parameters without assuming any particular reaction mechanism, i.e., they are model-free. They are based on the determination of one or more of the system parameters (temperature, transformation rate, and etc.) at which the same degree of transformation, α, has been reached for the measurements performed at different constant temperatures (isothermal) or different heating rates (non-isothermal). In general, nonisothermal experiments are preferred [19] because they are easier and faster to perform and can explore a wider temperature range. Isoconversional methods rely on the hypothesis that at a given α, the transformation rate is only a function of temperature [19, 20].

|
(1) |
Where the subscript α indicates the degree of transformation, R is the gas constant and Eα is the activation energy. The integration of Eq. (1) results in a transformation governed by a single mechanism where the rate constant, kα(T)= Aαexp(-Eα/RT), depends on α [21]:

|
(2) |
A variation of Eα with α is usually related to the occurrence of complex transformations where several mechanisms are involved (such as heterogeneous transformations, multi-step reactions, or transformations depending on parameters other than α and T) [22-25]. In this context, Eq. (1) is an approximate relationship and Eα must be interpreted in terms of apparent activation energy.
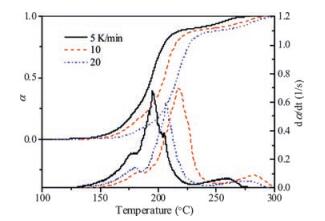
In Fig. 4, we have plotted the evolution of the transformation which was obtained directly from the TG analysis (Fig. 3). To calculatethedegree of the transformation, we have assumed that α depends linearly on the mass evolution:

|
Download:
|
| Fig. 4. Evolution of the transformed fraction and the transformation rate for the thermal decomposition of [C6H7N2O2]3TeCl5·2Cl measured by TG (Fig. 3) at several heating rates | |

|
(3) |
Where min and mfin are the initial and final masses, respectively.
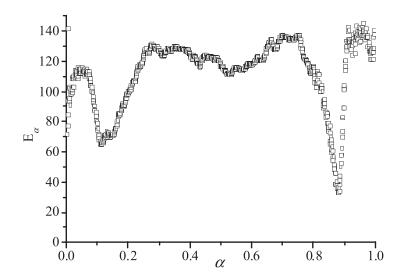
To determine the activation energy, we have used the Friedman method. The result is plotted in Fig. 5. From Fig. 5, it is apparent that the activation energy is not constant, this complex behavior is related to the overlapping of different processes. From Fig. 4, it is clear that at least three different mechanisms are involved in the decomposition process. Since from Fig. 4 three DSC peaks can be clearly distinguished, we also perform the Kissinger analysis which is based on the determination of the peak temperature TM. The peak temperature is the temperature at which the transformation rate is at its maximum. If we assume that, within the range where a peak is observed, the transformation is ruled by a single mechanism, the transformation rate is described by single process equation [26, 27].

|
Download:
|
| Fig. 5. Friedman analysis of the evolutions shown in Fig. 4 | |

|
(4) |
Contrarily to Eq. (2), E and A are assumed constant, they do not depend on α. From Eq. (4), it can easily derive the Kissinger equation [27] that relates the peak temperature, TM, with the kinetic parameters:

|
(5) |
Where β is the heating rate, 
Eq. (5) has been used to determine the activation energy for a large variety of transformations [28-35]. Kissinger method relies on the determination of the peak temperature TM, i from experiments carried out at different heating rates βi. The activation energy is obtained from a linear fit of the plot ln(βi/TM, i2) versus 1/TM, i. The results are plotted in Fig. 6 for the three DSC peaks observed in Fig. 3.

|
Download:
|
| Fig. 6. Kissinger plot of the three DSC peaks shown in Fig. 3 | |
The Kissinger analysis reveals that the endothermic process that triggers the decomposition exhibits a quite high energy barrier, 168 kJ/mol. Conversely, the Friedman analysis delivers significantly smaller activation energy. The reason is that the first process involves a very low mass loss as it is apparent from Fig. 3. For instance, the DTG curve shows only a small shoulder. Therefore, this process is not caught by the Friedman analysis that is based on the TG signal. On the other hand, the process is more evident in the DSC signal, thus Kissinger analysis of the first DSC peak is able to disclose the value of this initial barrier.
The Kissinger analysis of the second peak that is related to the second stage delivers activation energy of 109 kJ/mol. This second stage covers most of the decomposition process. Friedman analysis reveals a roughly constant activation energy of around 125 kJ/mol for 0.25 < α < 0.7. This discrepancy could be partly attributed to the experimental uncertainties in the determination of α and to the fact that Eα shows an evolution that points out that the kinetics of this second stage could not be reduced to a single mechanism description. From Figs. 3b and 4, it can be noted that the DTG, DSC and dα/dt curves show a structure that is characteristic of the occurrence of a complex behavior.
Finally, the Kissinger plot deviates significantly from linearity in the third process. As can be seen from Fig. 3, the DSC peaks obtained at 10 and 20 K/min nearly overlap and are far away from the peak obtained at 5 K/min. This behavior is in contradiction with the expected separation between the peaks for thermally activated process. The use of the Arrhenius equation to describe the reaction kinetics is based on the assumption that the reaction takes place in a parameter region far from equilibrium. The deviations from the Arrhenius behavior are to be expected when reactions take place near equilibrium. In these cases, the transformation rate is also governed by the temperature difference with respect to the equilibrium temperature. Indeed, when the temperature approaches that of equilibrium, the processes obtained at different heating rates tend to overlap. Therefore, the non-linearity of Kissinger plot may be interpreted in terms of a reaction kinetics controlled by the separation from equilibrium. In the Friedman plot, we observe anomalous and very low activation energy. The latter also indicates that the assumption that the reaction rate is governed by Arrhenius dependence does not hold.
2.4. EGA analysisThe main volatiles identified by EGA when [C6H7N2O2]3TeCl5·2Cl is heated at a rate of 5 K/min are shown in Fig. 7. In Fig. 7 only the evolution of the main fragments is exhibited, but volatile identification is based on the complete analysis of the defragmentation pattern. The first and main volatile is hydrochloric acid, so the decomposition of [C6H7N2O2]3TeCl5·2Cl is probably triggered by the release of the two chloride atoms. Next, we observe the formation of nitroaniline C6H4(NH2)(NO2). Therefore, the released chlorine atoms may react with [C6H7N2O2]3TeCl5 to form C6H4(NH2)(NO2), TeCl5 and 2HCl. The stoichiometry of the process is:

|
Download:
|
| Fig. 7. EGA analysis of [C6H7N2O2]3TeCl5·2Cl when is submitted to a constant temperature rise of 5 K/min in vacuum (10-5 mbar) | |

|
(6) |
The final solid residue is TeCl5 which is known to be a volatile, because the components of the form MXn with n = 1, 2, ...; M = Te, P, Cu, ... and X = Cl, Br, I, F, ... have boiling points around 150 ℃ to 300 ℃ for example the boiling point of SeBr6 is 180 ℃ [36]. So the final steady mass evolution after decomposition up to a null residue (zero final mass) is probably due to the evaporation of TeCl5.
The formation of small amounts of H2O is probably related to the reaction of HCl with residual O2. As for the formation of CO2 at higher temperature, it is probably related to the decomposition of nitroaniline in the gas phase.
2.5. Infrared and Raman spectroscopyThe IR spectrum of this compound (Fig. S5 and Table S1 in Supporting information), shows the characteristic absorption peaks of the [C6H7N2O2]+ cation [37, 38]. The peaks at 3426 cm-1 correspond to the (N-H) stretching vibrations. The symmetric stretching vibrations of (C-H) are observed at 3071 cm-1. The bands observed between 2850 and 2569 cm-1 are assigned to the asymmetric stretching vibrations of the (C-H) bond. The (N-H) bending is observed at 1614 cm-1. The symmetric and asymmetric stretching vibrations of (NO2) are observed at 1344 and 1528 cm-1. The (C-C-H) bending mode is located at 1087 cm-1. The vibrations modes between 891 and 806 cm-1 are due to the (C-N) asymmetric and symmetric stretching vibrations. The deformation of (C-C) bond is observed at 720 cm-1.
The Raman spectrum is illustrated in Fig. S2 and Table S1. In comparison with previous research works reported on similar compounds containing [TeCl5] [39, 40], the asymmetric stretching of (NO2) and the deformation of (C-H) are observed at 1355 and 1214 cm-1, respectively. Besides, the band located at 806 cm-1 is caused by the symmetric stretching of the (C-N). The observed bands at 673 cm-1 are associated with the (NO2) rocking mode.
The bands corresponding to the (Te-Cl) stretching in-plane mode appear at 340 cm-1. The stretching modes of (Te-Cl) occur between 265 cm-1 and 311 cm-1 and the deformation out-of-plane of (TeCl5) modes can be observed between 65 cm-1 and 108 cm-1.
2.6. Optical studyThe optical properties of solids provide an important tool for studying energy band structure. The optical absorption spectrum shown in Fig. S3 in Supporting information indicates that there is a strong absorption at 338 nm and 397 nm. This may be due to nitrogen-containing aromatic systems or electronic excitation in this region [41, 42]. Essentially, a high energy raises the electrons to higher bands, so the crystal structure absorbs the light, while the light without enough energy to raise the electrons to the following band will pass through the structure. The optical energy band gap for the [C6H7N2O2]3TeCl5·2Cl crystal was calculated by classical Tauc relation [43, 44] as given below:

|
(7) |
Where A is a constant, hv is the photon energy, Eg is the energy band gap, α is the absorption coefficient given by α = 2.303(Ab/t), where Ab is the absorbance and t is the thickness of cuvette which is 0.5 cm in the present case. The value of n = 1/2, 3/2, 2 or 3 depending on the nature of the electronic transition responsible for absorption. The value of n = 1/2 allows for the direct transition, thereby giving direct band gap. The direct optical band gap of the crystal has also been determined by plotting (αhv)2 against the photon energy (hv).
Fig. S4 in Supporting information shows the plot of (αhv)2 vs. photon energy (hv) for the [C6H7N2O2]3TeCl5·2Cl crystal. The optical energy gap Eg is determined from the intersection of the extrapolated line with the photon energy axis at (α = 0). The direct optical band gap of the crystal is found to be 3.12 and 3.67 eV. As a consequence of this wide band gap, the grown crystal has a large transmittance in the visible region. The large transmission in the entire visible region enables it to be a good candidate for electrooptic applications [45].
3. Conclusion[C6H7N2O2]3TeCl5·2Cl single-crystals have been grown by the slow evaporation method. The obtained material crystallizes in the space group (P-1) with triclinic system. The crystal structure is stabilized by the various types of N-H…Cl and C-H…Cl hydrogen bonds.
The TGA and DSC study shows that the compound is stable up to 130 ℃; thermal analysis reveals the existence of three decomposition stages at 130, 200 and between 250 ℃ and 300 ℃. The kinetic analysis reveals that the decomposition is a complex transformation that involves several processes and that the decomposition is triggered by and endothermic process whose barrier the activation energy is 168 kJ/mol. From Evolved gas analysis we observed that the decomposition is triggered by the release of two chloride atoms and that the decomposition entails the formation of hydrochloric acid of and nitroaniline as volatiles. The presence of all fundamental functional groups of the grown sample was confirmed by Raman scattering and infrared spectroscopy. From UV-visible spectrum, the cut-off wavelength and optical band gap were (397 nm) 3.12 eV and (338 nm) 3.67 eV.
4. Experimental 4.1. Synthesis of (C6H7N2O2)3TeCl5·2Cl compound[C6H7N2O2]3TeCl5·2Cl is obtained from a mixture of C6H6N2O2 (99.98%), and TeCl4 (98%), which was dissolved in 38% concentrated HCl acid and stirred for a few minutes at room temperature. After slow evaporation, neddles-shaped monocrystals appeared in the solution. The colorless crystals were collected by filtration and washed rapidly with cold ethanol. The stoichiometry of the process is:

|
The crystal data, collected reflections and parameters of the final refinement are reported in Table 1. Intensity data was collected using a Bruker APEXII CCD four circle diffractometer with graphite monochromated (Mo Kα). The positional parameters for the heavy atoms were obtained from a three-dimensional Patterson map, while the non-H atoms were found from successive difference Fourier Maps. The structure is refined by full matrix least squares using anisotropic temperature factors for all nonhydrogen atoms. The H atoms were all located in a difference map, but those attached to carbon atoms were repositioned geometrically. The H atoms were initially refined with soft restraints on the bond lengths and angles to regularize their geometry and Uiso (H) (in the range 1.2-1.5 times Ueq of the parent atom), after which the positions were refined with riding constraints. Calculations were performed with the SHELXS [46] and SHELXL [47] programs, using the scattering factors enclosed therein. The structural graph was created with ORTEP [48] and DIAMOND programs [49].
|
|
Table 1 Experimental data for X-ray diffraction study of [C6H7N2O2]3TeCl5·2Cl |

4.2.2. Spectroscopic measurement
Fourier transform infrared (FT-IR) measurements were performed at room temperature on a Perkin-Elmer FT-IR Paragon 1000 PC spectrometer over the 4000-400 cm-1 region. Samples were prepared in KBr pellets. As for the Raman scattering spectrum, it was recorded using a T-64000 Raman spectrometer (ISA, JobinYvon) with standard attachments. The beam sources were argon krypton titan-sapphire and semi-conductor lasers. The spectrum was recorded in the range of 50 cm-1 to 1500 cm-1. The UV-vis spectral analysis was carried out between 200 nm and 800 nm using UV-vis absorption spectrophotometer (T90 + UV/ visible).
4.2.3. Thermal analysisDifferential scanning calorimetric (DSC) analysis was performed using a DSC 822 METTLER TOLEDO instrument for temperatures ranging from 300 K to 750 K. The samples were heated at a constant rate of 10 K/min. A polycrystalline sample of 4.625 mg was placed in an aluminum crucible and the experiments were carried out under a nitrogen flowing atmosphere. Thermogravimetric (TG) analysis was performed with a Setaram apparatus model, Setsys Evolution 16. The temperature was increased from 300 K to 750 K at a constant rate of 10 K/min under a nitrogen atmosphere. To improve the signal-noise ratio, after experiments TG curves were corrected by subtracting a consecutive identical second measurement and by measuring the sample mass at room temperature after the experiment. The sample placed in a crucible of alumina (Al2O3), on a support suspended horizontally in the balance beam. Gas flow was controlled with mass flow meters. After experiments, TG and DSC curves were corrected subtracting a consecutive identical second measurement and by using the sample mass measured at room temperature after the experiment. Evolved gas analysis (EGA) was performed by placing the samples in a quartz tube at a pressure of about 10-5 mbar. Samples are heated at a constant rate of 5 K/min using an external furnace.
4.2.4. Kinetic analysisFriedman's isoconversional method [50, 51] and Kissinger method [52] were employed for the computation of the kinetic parameters. Since TG measurements allowed us to obtain an accurate determination of the evolution of the transformation, Friedman's analysis was used to determine the activation energy. Conversely, from the DSC curves it is impossible to determine unambiguously the baseline, so it is not possible to determine the evolution of the transformed fraction accurately enough to apply an isoconversional method. Thus, to perform the kinetic analysis of the DSC data, we used the Kissinger method that is not as accurate as Friedman's method but it allows determining the activation energy solely from the peak temperature.
AcknowledgmentsThis work was partially funded by the Tunisian Ministry of Higher Education and Scientific Research, the Spanish Programa Nacional de Materiales through project MAT2014-51778-C2-2-R and by the Universitat de Girona contract No. MPCUdG2016/059.D. Maraii acknowledges the financial support of the Tunisian Ministry of Higher Education and Scientific Research.
Appendix A. Supplementary dataSupplementary data associated with this article can be found, in the online version, at http://dx.doi.org/10.1016/j.cclet.2017.04.005.
| [1] | B. Moulton, M.J. Zaworotko. From molecules to crystal engineering:supramolecular isomerism and polymorphism in network solids. Chem. Rev. 101 (2001) 1629–1658. DOI:10.1021/cr9900432 |
| [2] | S. Kitagawa, R. Kitaura, S.I. Noro. Functional porous coordination polymers. Angew. Chem. Int. Ed. 43 (2004) 2334–2375. DOI:10.1002/(ISSN)1521-3773 |
| [3] | M. Dammak, T. Mhiri, J. Jaud, J.M. Savariault. Structural study of the two new caesium sulfate and selenate tellurate Cs2SO4·Te(OH)6 and Cs2SO4·Te(OH)6. Int. J. Inorg. Mater. 3 (2001) 861–873. DOI:10.1016/S1466-6049(01)00094-0 |
| [4] | K.A. Brylev, Y.V. Mironov, N.G. Naumov, V.E. Fedorov, J.A. Ibers. New compounds from tellurocyanide rhenium cluster anions and 3d-transition metal cations coordinated with ethylenediamine. Inorg. Chem. 43 (2004) 4833–4838. DOI:10.1021/ic040046j |
| [5] | S.B. Artemkina, N.G. Naumov, A.V. Virovets, V.E. Fedorov. 3D-coordination cluster polymers[Ln(H2O)3Re6Te8(CN)6]×nH2O (Ln:La3+, Nd3+):direct structural analogy with the mononuclear LnM(CN)6×nH2O Family. Cheminform 36 (2005) . DOI:10.1002/chin.200510023 |
| [6] | M. Bochmann, A.P. Coleman, K.J. Webb, M.B. Hursthouse, M. Mazid. Synthesis of sterically hindered tellurophenols and the structure of[Cd (μ-TeC6H2M3)2]∞. Angew. Chem. Int. Ed. 30 (1991) 973–975. DOI:10.1002/(ISSN)1521-3773 |
| [7] | J. Lee, D. Freedman, J.H. Melman, et al., Trivalent lanthanide chalcogenolates:Ln(SePh)3, Ln2(EPh)6, Ln4(SPh)12, and [Ln(EPh)3]n (E=S. Se). How metal, chalcogen, and solvent influence structure. Inorg. Chem. 37 (1998) 2512–2519. DOI:10.1021/ic9716161 |
| [8] | P.H. Bird, V. Kumar, B.C. Pant. Crystal and molecular structures of the (4-alkoxyphenyl)tellurium (Ⅳ) trihalides:(4-EtOPh)TeCl3, (4-EtOPh)TeBr3, and (4-MeOPh)TeI3. Inorg. Chem. 19 (1980) 2487–2493. DOI:10.1021/ic50211a002 |
| [9] | N.W. Alcock, W.D. Harrison. Structure of catena-μ-bromo-dibromo(phenyl)-tellurium(Ⅳ). Acta Cryst. B 38 (1982) 2677–2679. DOI:10.1107/S0567740882009571 |
| [10] | C. Janiak. Engineering coordination polymers towards applications. Dalton Trans. (2003) 2781–2804. |
| [11] | A.D. Dimou, V.A. Sakkas, T.A. Albanis. Photodegradation of trifluralin in natural waters and soils:degradation kinetics and influence of organic matter. Int. J. Environ. Anal. Chem. 84 (2004) 173–182. DOI:10.1080/0306731031000149660 |
| [12] | N. Singh, A. Ahmad. Synthesis and spectrophotometric studies of charge transfer complexes of p-nitroaniline with benzoic acid in different polar solvents. J. Mol. Struct. 1074 (2014) 408–415. DOI:10.1016/j.molstruc.2014.05.076 |
| [13] | N.N. Wang, T. Zheng, J.P. Jiang, P. Wang. Cu(Ⅱ)-Fe(Ⅱ)-H2O2 oxidative removal of 3-nitroaniline in water under microwave irradiation. Chem. Eng. J. 260 (2015) 386–392. DOI:10.1016/j.cej.2014.09.002 |
| [14] | J.A. Zerkowski, J.C. McDonald, G.M. Whitesides. Investigations into the robustness of secondary and tertiary architecture of hydrogen-bonded crystalline tapes. Chem. Mater. 6 (1994) 1250–1257. DOI:10.1021/cm00044a024 |
| [15] | J. Janczak, G.J. Perpétuo. Melaminium chloride hemihydrate. Acta Crystallogr. 57 (2001) 1120–1122. |
| [16] | M. Ratajczak-Sitarz, Z. Kałuski, A. Ostrowicz, S. Bałoniak. Molecular and crystal structure of 3-(4-chlorophenylthio)-1-(2, 4-dinitrophenylamino)-pyrrolidine-2, 5-dione. J. Crystallogr. Spectrosc. Res. 20 (1990) 535–539. DOI:10.1007/BF01221893 |
| [17] | G. C. Pimental, A. L. Mc Clellan, The Hydrogen Bond, Freeman, San Fransisco, 1971. |
| [18] | J. Farjas, P. Roura. Exact analytical solution for the Kissinger equation:determination of the peak temperature and general properties of thermally activated transformations. Thermochim. Acta 598 (2014) 51–58. DOI:10.1016/j.tca.2014.10.024 |
| [19] | S. Vyazovkin, C.A. Wight. Isothermal and nonisothermal reaction kinetics in solids:in search of ways toward consensus. J. Phys. Chem. A 101 (1997) 8279–8284. |
| [20] | S. Vyazovkin. Thermal analysis. Anal. Chem. 82 (2010) 4936–4949. DOI:10.1021/ac100859s |
| [21] | J. Farjas, P. Roura. Isoconversional analysis of solid-state transformations. A critical review. Part Ⅲ. Isothermal and non isothermal predictions. J. Therm. Anal. Calorim 109 (2012) 183–191. DOI:10.1007/s10973-011-1642-2 |
| [22] | S. Vyazovkin, C.A. Wight. Kinetics in solids. Annu. Rev. Phys. Chem. 48 (1997) 125–149. DOI:10.1146/annurev.physchem.48.1.125 |
| [23] | S. Vyazovkin. On the phenomenon of variable activation energy for condensed phase reactions. New J. Chem. 24 (2000) 913–917. DOI:10.1039/b004279j |
| [24] | F.W. Wilburn. Kinetics of overlapping reactions. Thermochim. Acta 354 (2000) 99–105. DOI:10.1016/S0040-6031(00)00455-X |
| [25] | J. Farjas, P. Roura. Isoconversional analysis of solid state transformations. A critical review. Part Ⅱ. Complex transformations. J. Therm. Anal. Calorim. 105 (2011) 767–773. DOI:10.1007/s10973-011-1447-3 |
| [26] | M. Brown, D. Dollimore, A. Galwey. Theory of solid state reaction kinetics, in:C. H. Bamford, C.F.H. Tipper (Eds.), Comprehensive Chemical Kinetics, Vol 22, Reactions in The Solid State. Elsevier, Amsterdam (1980) pp. 41–113. |
| [27] | J. Šesták, Thermophysical Properties of Solids, Their Measurements and Theoretical Thermal Analysis, Elsevier, Amsterdam, 1984. |
| [28] | J. Farjas, P. Roura. Modification of the Kolmogorov-Johnson-Mehl-Avrami rate equation for non-isothermal experiments and its analytical solution. Acta Mater. 54 (2006) 5573–5579. DOI:10.1016/j.actamat.2006.07.037 |
| [29] | R.L. Blaine, H.E. Kissinger. Homer Kissinger and the Kissinger equation. Thermochim. Acta 540 (2012) 1–6. DOI:10.1016/j.tca.2012.04.008 |
| [30] | S. Vyazovkin, A.K. Burnham, J.M. Criado, et al., ICTAC Kinetics Committee recommendations for performing kinetic computations on thermal analysis data. Thermochim. Acta 520 (2011) 1–19. DOI:10.1016/j.tca.2011.03.034 |
| [31] | A. Khawam, D.R. Flanagan. Basics and applications of solid-state kinetics:a pharmaceutical perspective. J. Pharm. Sci. 95 (2006) 472–498. DOI:10.1002/jps.20559 |
| [32] | E.J. Mittemeijer. Analysis of the kinetics of phase transformations. J. Mater. Sci. 27 (1992) 3977–3987. DOI:10.1007/BF01105093 |
| [33] | M.J. Starink. On the applicability of isoconversion methods for obtaining the activation energy of reactions within a temperature-dependent equilibrium state. J. Mater. Sci. 32 (1997) 6505–6512. DOI:10.1023/A:1018655026036 |
| [34] | T. Ozawa. Thermal analysis-review and prospect. Thermochim. Acta 355 (2000) 35–42. DOI:10.1016/S0040-6031(00)00435-4 |
| [35] | J.P. Elder. The general applicability of the Kissinger equation in thermal analysis. J. Therm. Anal. 30 (1985) 657–669. DOI:10.1007/BF01913612 |
| [36] | O. Reich, S. Hasche, K. Büscher, I. Beckmann, B. Krebs. Neue oxoniumbromochalkogenate(Ⅳ)-darstellung, struktur und eigenschaften von [H3O] [TeBr5]·3C4H8O2 und [H3O]2[SeBr6]. Z. Anorgan. Allgem. Chem. 622 (1996) 1011–1018. DOI:10.1002/(ISSN)1521-3749 |
| [37] | V. Krishnakumar, R. Nagalakshmi. Studies on the first-order hyperpolarizability and terahertz generation in 3-nitroaniline. Phys. B 403 (2008) 1863–1869. DOI:10.1016/j.physb.2007.10.341 |
| [38] | M. Karabacak, E. Kose, A. Atac. Molecular structure (monomeric and dimeric structure) and HOMO-LUMO analysis of 2-aminonicotinic acid:a comparison of calculated spectroscopic properties with FT-IR and UV-vis. Spectrochim. Acta Part A 91 (2012) 83–96. DOI:10.1016/j.saa.2012.01.072 |
| [39] | J. Pietikäinen, A. Maaninen, R.S. Laitinen, R. Oilunkaniemi, J. Valkonen. Halogenation of tellurium by SO2Cl2. Formation and crystal structures of (H3O)[Te3Cl13]·1/2SO2. [(C4H8O)2H] [TeCl5]· (C4H8O), [(Me2SO)2H]2[TeCl6], and [Ni (NCCH3)6] [Te2Cl10]. Polyhedron 21 (2002) 1089–1095. DOI:10.1016/S0277-5387(02)00909-9 |
| [40] | J.B. Milne, E.J. Gabe, C. Bensimon. The structure of the tetrachlorohydroxotellurate(Ⅳ) anion in KTeC14(OH)·0.5H2O and KTeC14(OH). Can. J. Chem. 69 (1991) 648–652. |
| [41] | K. Jarraya, N. Gublin, N. Ghermani, T. Mhiri. Decomposition behavior of the NaH2(PO4)0.48(AsO4)0.52·H2O compound above room temperature shown by the study of Raman X-ray powder and ac-conductivity. IOP Conf. Ser.:Mater. Sci. Eng. 28 (2012) 012046. DOI:10.1088/1757-899X/28/1/012046 |
| [42] | V. Sangeetha, K. Gayathri, P. Krishnan, et al., Growth optical, thermal, dielectric and microhardness characterizations of melaminium bis (trifluoroacetate) trihydrate single crystal. J. Cryst. Growth 389 (2014) 30–38. DOI:10.1016/j.jcrysgro.2013.11.026 |
| [43] | J. Tauc. Amorphous and Liquid Semiconductors. Springer-Verlag, U.S (1974) pp. 171. |
| [44] | J. Tauc, R. Grigorovici, A. Vancu. Optical properties and electronic structure of amorphous germanium. Phys. Status Solidi B 15 (1996) 627–637. |
| [45] | P. Rajesh, P. Ramasamy. Growth of DL-malic acid-doped ammonium dihydrogen phosphate crystal and its characterization. J. Cryst. Growth 311 (2009) 3491–3497. DOI:10.1016/j.jcrysgro.2009.04.020 |
| [46] | G. M. Sheldrick, SHELXS-97: Program for the Crystal Structure Determination, University of Göttingen, Germany, 1990. |
| [47] | G. M. Sheldrick, SHELXL-97: Program for the Crystal Structure Determination, University of Göttingen, Germany, 1997. |
| [48] | L.J. Farrugia. ORTEP-3 for windows-a version of ORTEP-Ⅲ with a graphical user interface (GUI). J. Appl. Cryst. 30 (1997) 565. |
| [49] | K. Brandenburg, Diamond Version 2. 0 Impact GbR, (1998) Bonn, Germany. |
| [50] | H.L. Friedman. Kinetics of thermal degradation of char-forming plastics from thermogravimetry. Application to a phenolic plastic. J. Polym. Sci.:Polym. Symp 6 (1964) 183–195. |
| [51] | J. Farjas, P. Roura. Isoconversional analysis of solid state transformations. A critical review. Part I. Single step transformations with constant activation energy. J. Therm. Anal. Calorim 105 (2011) 757–766. DOI:10.1007/s10973-011-1446-4 |
| [52] | H.E. Kissinger. Reaction kinetics in differential thermal analysis. Anal. Chem. 29 (1957) 1702–1706. DOI:10.1021/ac60131a045 |