 2017, Vol. 28


b College of Materials Science and Opto-Electronic Technology, University of Chinese Academy of Sciences, Beijing 100049, China
Materials exhibiting negative thermal expansion (NTE) property are that the materials volumes would decrease with increasing temperature, which is opposite to the conventional materials with positive thermal expansion coefficients [1]. The most popular example of NTE materials is the water in the temperature range of 273-277 K. Since 1990s, some new families of NTE materials have been discovered including AM2O7 [2], AM2O8 [3-5], A2M3O12 [6-8], alloy [9] and zeolites [10], etc. Among these materials, the orthorhombic A2M3O12 (A: trivalent cations, M: W6+ or Mo6+) have drawn more and more attention especially in recent years, for the reason that A cation in A2M3O12 could be many ions from Al3+ (radius of 0.51 Å) to rare earth ions, e.g. Gd3+ (radius of 0.94 Å) [11-13], and it is the A cation which mainly determines the different positive or negative thermal expansion properties of A2M3O12. Therefore, A cation can be partially replaced by other trivalent cations in order to achieve artificial control of thermal expansion coefficient of A2M3O12.
The A2M3O12 compounds, adopting orthorhombic crystal structure (Pnca or Pbcn space group, No. 60), contain independent rigid AO6 octahedra sharing all six corners with independent rigid MO4 tetrahedra. When the temperature is rising, the bending or rotation about the A-O-M linkages causes polyhedral rotation and slight distortion in some or all the rigid polyhedra, which is known as quasi rigid unit modes (QRUMs) and results in NTE phenomenon [14]. In terms of molybdate, A2Mo3O12 (A = Y3+, Yb3+, Ho3+, Tm3+, Lu3+, Sc3+, In3+, etc.) compounds have negative linear coefficients of thermal expansion (αl =αV/3) [15-19]. Upon reducing the A cation size, the AO6 octahedra decrease in size, thus oxygen-oxygen distances contract resulting in increase in repulsion. The increased interaction strength in oxygen repulsions enhances the rigidity of the metal-oxygen polyhedra which inhibiting distortions and rotations [20]. Hence, it is implied that the NTE coefficients of A2Mo3O12 can be controlled by adjusting the rigidity of polyhedra. This was confirmed by experimental results on Y2Mo3O12 which had a stronger negative coefficient of thermal expansion, αl = -12.6 ×10⁻⁶ K-1 [7], differing from orthorhombic A2Mo3O12 with smaller A cations as Lu2Mo3O12 (αl = -5.59 ×10⁻⁶ K-1) and Sc2Mo3O12 (αl = -2.1 ×10⁻⁶ K-1) [21, 22]. Consequently, it is obvious that the decrease of A cation size could inhibit thermal contraction of A2Mo3O12 materials remarkably. On the basis of above analysis, we performed a research work of control on thermal expansion property of rare earth molybdate in which rare earth ions were substituted by small metal ions step by step.
In this study, Yb3+ (radius of 0.86Å) was partially substituted by Fe3+ (radius of 0.64Å) in order to form Yb2-xFexMo3O12 (x=0.0, 0.6, 1.0, 1.1, 1.4) solid solutions. The AO6 octahedra therefore decreased in size with doping of Fe3+ inducing stronger repulsions in oxygen anions, and the linear thermal expansion coefficients of Yb2-xFexMo3O12 increased synchronously, as expected. For the reason that the framework of Fe2Mo3O12 adopts monoclinic structure at a temperature range from room temperature to 773K differing from the orthorhombic crystal structure of Yb2Mo3O12 [23, 24], Yb3+ could not be substituted by Fe3+ in all composition ranges. Otherwise, the detailed investigations on crystal structures of Yb2-xFexMo3O12 revealed the fundamental causes for the positive or negative thermal expansion.
2. Results and discussionRietveld refinements were performed for every Yb2-xFexMo3O12 compound using XRPD data. Details of refinement protocols for Yb1.4Fe0.6Mo3O12 and Yb1.0Fe1.0Mo3O12, as examples, are given in Table 1. XRPD patterns of the samples showing experimental, calculated, difference profiles and Bragg positions after Rietveld refinement are illustrated in Fig. 1. Atomic coordinates for Yb1.4Fe0.6Mo3O12 at 873K and Yb1.0Fe1.0Mo3O12 at 453K are presented in Tables S1 and S2 (Supporting information), respectively.
|
|
Table 1 Details of refinement. |


|
Download:
|
| Fig. 1. Rietveld refinements of XRPD data for Yb2-xFexMo3O12 (x=0.6, 1.0). Experimental (solid line), calculated (+), difference profiles (lower trace) and Bragg positions (|) are shown. | |
According to the XRPD patterns (Fig. 2) and Rietveld structural refinement results, Yb2-xFexMo3O12 (x=0.0, 0.6, 1.0, 1.1, 1.4) adopted orthorhombic crystal structure (space group No. 60). At the same time, all diffraction lines were observed to shift to higher two-theta angles in Fig. 2 with substituting of Fe3+ for Yb3+. Diffraction line of (123) plane was marked as an example. The interplanar spacing d of (123) in Yb2-xFexMo3O12 (x=0.0, 0.6, 1.0, 1.1, 1.4), calculated using Bragg equation (Table S3, in Supporting information), decreased with more Yb3+ replaced by the smaller Fe3+. In addition, Yb2-xFexMo3O12 (x=1.0, 1.1) would decomposed when heated up to high temperature, which might be induced by the distortion of polyhedra, considering the over 25 percent difference in ionic radius between Yb3+ and Fe3+. This kind of instability of crystal structure had been also observed in other A2M3O12 solid solutions even at room temperature [25]. A comparison of XRPD patterns between Yb0.6Fe1.4Mo3O12 and Yb0.9Fe1.1Mo3O12 is illustrated in Fig. 3. Yb0.9Fe1.1Mo3O12 was found to decompose when the temperature was up to 873K and the same instability of Yb1.0Fe1.0Mo3O12 was observed at 923K, while no phase transition was found in the whole testing temperature range for Yb2-xFexMo3O12 (x=0.0, 0.6, 1.4). As the temperature increased from 423K to 1073K, shift of diffraction lines can also be observed in XRPD pattern of Yb0.6Fe1.4Mo3O12 (Fig. 3), which indicates the changes of interplanar spacing d especially when the temperature is higher than 873K (Table S4 in Supporting information).

|
Download:
|
| Fig. 2. XRPD patterns of Yb2-xFexMo3O12 (x=0.0, 0.6, 1.0, 1.1, 1.4). | |

|
Download:
|
| Fig. 3. XRPD patterns of (a) Yb0.6Fe1.4Mo3O12 and (b) Yb0.9Fe1.1Mo3O12 collected at different temperatures. | |
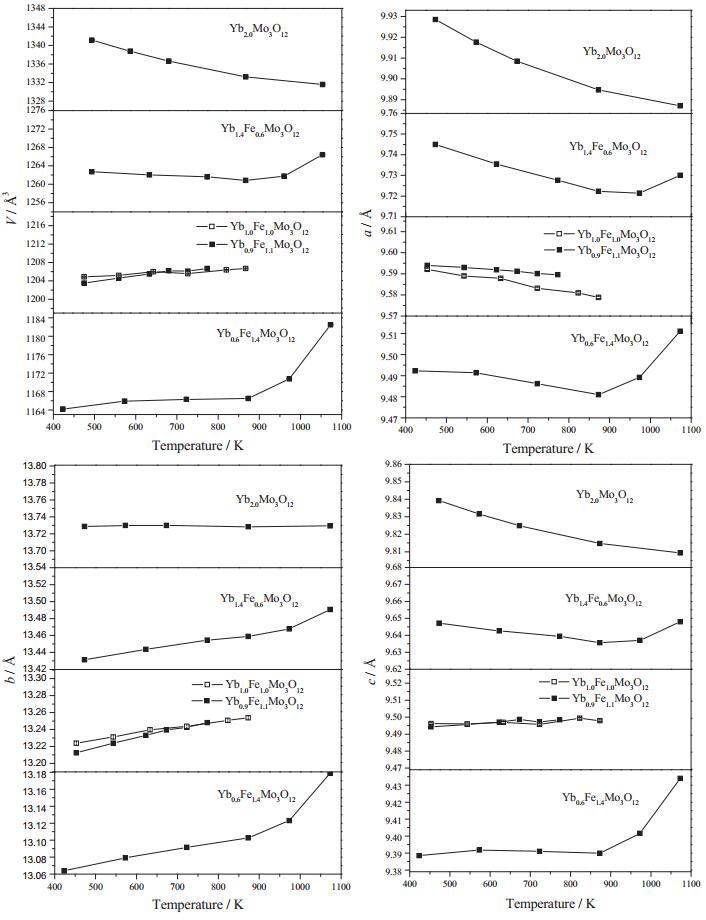
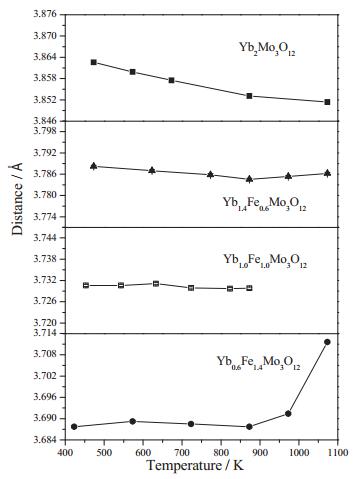
Besides d values, unit cell volumes V and lattice parameters a, b, c of all the prepared samples at different temperature were figured out using the Rietveld refinement method. Contraction of V, as well as lattice parameters, caused by the substitution of smaller Fe3+ for Yb3+ is evident in Fig. 4. Moreover, the doping iron ions in crystal structure of Yb2Mo3O12 resulted in decrease of average Yb-Mo or Yb/Fe-Mo nonbonded distance (Fig. 5) and increase of linear thermal expansion coefficients (Table 2). Moreover, a comparison between Figs. 4 and 5 reveals that the variation trend of average Yb-Mo or Yb/Fe-Mo nonbonded distance is very similar to that of unit cell volume V, which implies the close connection between NTE property of Yb2-xFexMo3O12 and average Yb-Mo or Yb/Fe-Mo nonbonded distance.

|
Download:
|
| Fig. 4. Unit cell volumes (V) and lattice parameters (a, b, c) as a function of temperature for Yb2-xFexMo3O12. Error bars are included, but they are smaller than the symbols. | |

|
Download:
|
| Fig. 5. Average Yb–Mo or Yb/Fe–Mo distances at different temperature. | |
|
|
Table 2 Thermal expansion coefficients of Yb2-xFexMo3O12. |

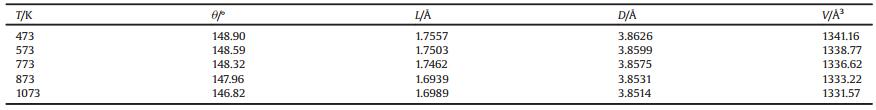
Fig. 6 shows a corner sharing framework of YbO6 octahedra and MoO4 tetrahedra in orthorhombic Yb2Mo3O12, which exhibits anisotropic negative thermal expansion property with a linear thermal expansion coefficient (αl) of -3.97 ×10⁻⁶K-1. The linear thermal expansion coefficients of a and b axis (αa and αb) are -6.59 ×10⁻⁶K-1 and -5.06 ×10⁻⁶K-1, while c axis shows a nearzero linear thermal expansion coefficient of 0.07 ×10⁻⁶K-1 in the temperature range of 473-1073K. When the temperature is rising, rocking of the polyhedra in the Yb2Mo3O12 structure occurs because the average Yb-O-Mo angle reduces continually (Table 3). This contraction of A-O-Mo bridging bond angles has also been observed in other A2Mo3O12 compounds [6, 16]. At the same time, the average apparent Mo2-O (Mo2 site in Fig. 6) bond length in Yb2Mo3O12 (Table 3 and Fig. 7) decreases from 1.7557Å (473K) to 1.6939Å (873K) which indicates that distinct distortions took place in the Mo2O4 tetrahedra, while change of average bond length has been hardly observed in Mo1O4 (Mo1 site in Fig. 6) and YbO6 (Yb sitein Fig. 6) polyhedra (Fig. 7). It isbelievedthat both the rocking and the distortion of polyhedra shorten the Yb-Mo nonbonded distances and give rise to NTE phenomenon [6, 14]. Therefore, it is conclude that the negative thermal expansion activity of Yb2Mo3O12 could be ascribed to the reductions in both the average Yb-O-Mo angle and the average apparent Mo2-O bond length with increasing temperature, which induce decrease in average Yb-Mo nonbonded distances ultimately (Table 3). It was suggested by Liang et al. that stretching and bending modes of MoO4 tetrahedra contribute to the NTE of Y2Mo3O12 partially [26]. In this work, Mo2O4 tetrahedra are confirmed playing more roles than Mo1O4 tetrahedra in the NTE of Yb2Mo3O12 by the changes in average apparent Mo-O bond lengths at different temperature, which is revealed for the first time.

|
Download:
|
| Fig. 6. Schematic structure of Yb2Mo3O12 with atom symbols (Rietveld refinement results of XRPD data at 473 K, Table S5 in Supporting information). In this orthorhombic structure, each YbO6 octahedron is connected to six MoO4 tetrahedra by bridging oxygens and each MoO4 shares its corners with four YbO6 octahedra. | |
|
|
Table 3 Average Yb–O–Mo angles (θ), average apparent Mo2–O bond lengths (L), average Yb–Mo distances (D) and unit cell volumes (V) of Yb2Mo3O12 at different temperature. |

|
Download:
|
| Fig. 7. AverageapparentYb/Fe–Oand Mo–Obond lengthsofmetal-oxygenpolyhedrain Yb2-xFexMo3O12 (x=0.0, 0.6, 1.0, 1.4) at differenttemperature(a: x=0.0at 473K, x=0.6 at 473K, x=1.0 at 453K, x=1.4 at 423K). | |
Fig. 7 shows that Fe3+ dopant in crystal structure has influence on the average bond lengths of Yb/FeO6 and MoO4 polyhedra. Compared to the lower temperature, when the temperature increased to 873K, the distortions of Mo2O4 tetrahedra were more remarkable than that of Mo1O4 and YbO6 polyhedra in Yb1.4Fe0.6-Mo3O12 and Yb0.6Fe1.4Mo3O12. As for Yb1.0Fe1.0Mo3O12, the average Yb/Fe-O-Mo angle reduced from 137.396° (at 435K) to 133.999° (at 873K), which indicated the slight rotations of Yb/FeO6 and MoO4 polyhedra.Atthesametime, theincreaseof averageYb/Fe-O and Mo1-O bond length and decrease of average Mo2-O bond length were observed in Fig. 7. Thus the cell volume of Yb1.0Fe1.0Mo3O12 expanded from 1204.8Å3 to 1206.6Å3 induced by the synergetic effect of rotations and distortions of metaloxygen polyhedra. Evidently, the changes of average metal-oxygen bond length are more complicated in Yb1.0Fe1.0Mo3O12 than in other Yb2-xFexMo3O12 (x=0.0, 0.6, 1.4) compounds, indicating the instability of crystal structure as the ratio of rare earth ions to iron ions is 1/1, which can be related to the decomposition of Yb1.0Fe1.0Mo3O12 at 923K.
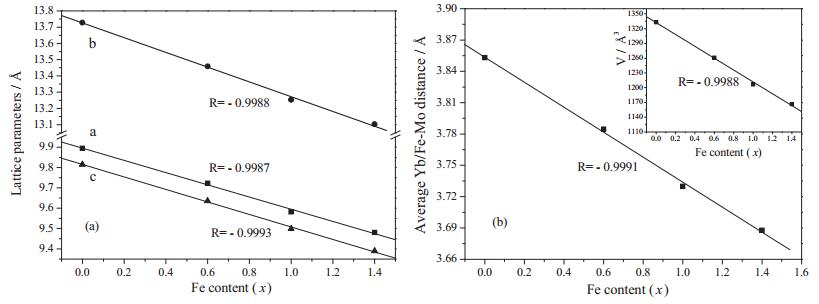
The linear relationships between the lattice parameters, unit cell volume and Fe content (x) in Yb2-xFexMo3O12 at 873K are illustrated in Fig. 8, which are perfect proof for the substitution of Fe3+ to Yb3+ at Yb 3+ sites in crystal structures. This kind of linear relationship is exactly identical with the change of average A-Mo (A: Yb-Mo or Yb/Fe) nonbonded distances as a function of Fe content. Therefore, the average A-Mo distance is more accurate than the average A-O and Mo-O bond length and average A-O-Mo angle in studying the thermal expansion properties of Yb2-xFexMo3O12 solid solutions, for the reason that neither the average A/ Mo-O bond length nor the average A-O-Mo angle can explain the changes of unit cell volume and lattice parameters independently. Furthermore, it can be deduced from Figs. 5 and 8 that the variation of average A-Mo nonbonded distances at different temperature should be a direct structural origin of negative or positive thermal expansion for orthorhombic A2Mo3O12 compounds [16, 23].

|
Download:
|
| Fig. 8. (a) lattice parameters, (b) average Yb–Mo or Yb/Fe–Mo distances and unit cell volume (the inset) as a function of x for Yb2-xFexMo3O12 at 873K. | |
The radius of Fe3+ is 0.64 Å, much smaller than that of Yb3+ (0.86 Å). The substitution of Fe3+-Yb3+ reduces the oxygen-oxygen distances in AO6 octahedra directly, causing stronger repulsions between oxygen anions. The increased interaction strength in oxygen-oxygen repulsions promotes the rigidity of the polyhedra. As a result, the distortions and rotations of metal-oxygen polyhedra are inhibited [20]. Therefore, the thermal expansion coefficients of Yb2-xFexMo3O12 increase from negative to positive with more ytterbium cations substituted by iron cations (Table 2), which means the NTE coefficients of A2Mo3O12 can be controlled by doping smaller A cations at the octahedral sites in crystal structure. Yb1.4Fe0.6Mo3O12 has a NTE coefficient of -1.24 ×10⁻⁶ K-1 (473-873 K) and a positive coefficient of 7.36 ×10⁻⁶ K-1 (873-1073 K). Yb1.0Fe1.0Mo3O12 has a low positive thermal expansion coefficient of 1.19 ×10⁻⁶ K-1 (453-873 K). What is more interesting is that a near-zero thermal expansion coefficient of 0.55 ×10⁻⁶ K-1 and a very high positive thermal expansion coefficient of 22.80 ×10⁻⁶ K-1 for Yb0.6Fe1.4Mo3O12 are observed in the temperature range of 573-873 K and 873-1073 K, respectively. Such materials as Yb0.6Fe1.4Mo3O12 with sudden change in thermal expansion coefficient might be of potential applications in area of high-temperature ceramic components.
3. ConclusionRietveld structural refinements of XRPD data revealed that the reductions in average Yb-O-Mo angle and average apparent Mo2-O bond length played important roles for the NTE of Yb2Mo3O12. The varieties of average apparent metal-oxygen bond length of AO6 and MoO4 polyhedra in Yb1.0Fe1.0Mo3O12 are more complicated than in other Yb2-xFexMo3O12 (x = 0.0, 0.6, 1.4) compounds. The changes of average A-Mo distances with increasing temperature are direct structural origins of negative or positive thermal expansion for orthorhombic Yb2Mo3O12 compound. The linear thermal expansion coefficients of Yb2-xFexMo3O12 increased from negative to positive with Yb3+ substituted by Fe3+, which indicated that the thermal expansion property of Yb2Mo3O12 (NTE coefficient of -3.97 ×10⁻⁶ K-1) could be efficiently adjusted by doping of Fe cations with smaller ionic radius. In addition, a near-zero thermal expansion coefficient of 0.55 ×10⁻⁶ K-1 for Yb0.6Fe1.4Mo3O12 was observed in the temperature range of 573-873K. The negative or positive thermal expansion properties of orthorhombic Yb2-xFexMo3O12 solid solutions are attributed to the changes of average metal-metal nonbonded distances with increasing temperature directly.
4. ExperimentalThe samples were prepared by the conventional solid state techniques from stoichiometric quantities of the constituent oxides. All the starting materials were purchased from Sinopharm Chemical Reagent Co., Ltd. (Shanghai, China), and preheated to 773K before weighting to protect from H2O and CO2. Reactants Fe2O3 (purity 99.99%), Yb2O3 (purity 99.9%) and MoO3 (purity 99.5%) werethoroughlygroundand heat treatedat 1073-1173K for two 24h periods with intermittent grinding in alumina crucibles. All samples were quenched in air. high temperature X-ray powder diffraction (XRPD) data were collected on PANalytical X'Pert PRO MPD with Cu Kα radiation (λ=1.54056Å, 40kV, 40mA) in 2θ range from 10° to 70° with a step size of 0.017° at Beijing Normal University. The heating rate was 30K/min and data were collected after the temperature was kept constant for 5min. Considering the hygroscopicity of orthorhombic rare earth molybdates at room temperature [13, 17], which would affect the thermal expansion property of A2Mo3O12, XRPD data were recorded at high temperature (≥423K). Rietveld refinements of XRPD data were performed using FullProf software suite to obtain accurate parameters of crystal structure [27, 28].
AcknowledgmentsThis work was supported by the National Natural Science Foundation of China (No. 21403129), the Project of Shandong Province Higher Educational Science and Technology Program (No. J13LD13 & J15LC09) and "Hundred Talents Project" of the Chinese Academy of Sciences.
Appendix A. Supplementary dataSupplementary data associated with this article can be found, in the online version, at http://dx.doi.org/10.1016/j.cclet.2017.03.002.
| [1] | T.A. Mary, J.S.O. Evans, T. Vogt, A.W. Sleight. Negative thermal expansion from 0.3 to 1050 Kelvin in ZrW2O8. Science 272 (1996) 90–92. DOI:10.1126/science.272.5258.90 |
| [2] | Y. Yamamura, A. Horikoshi, S. Yasuzuka, H. Saitoh, K. Saito. Negative thermal expansion emerging upon structural phase transition in ZrV2O7 and HfV2O7. Dalton Trans. 40 (2011) 2242–2248. DOI:10.1039/c0dt01087a |
| [3] | J.S.O. Evans, T.A. Mary, T. Vogt, M.A. Subramanian, A.W. Sleight. Negative thermal expansion in ZrW2O8 and HfW2O8. Chem. Mater. 8 (1996) 2809–2823. DOI:10.1021/cm9602959 |
| [4] | C.A. Perottoni, J.A.H. da Jornada. Pressure-induced amorphization and negative thermal expansion in ZrW2O8. Science 280 (1998) 886–889. DOI:10.1126/science.280.5365.886 |
| [5] | L.C. Gallington, K.W. Chapman, C.R. Morelock, P.J. Chupas, A.P. Wilkinson. Orientational order-dependent thermal expansion and compressibility of ZrW2O8 and ZrMo2O8. Phys. Chem. Chem. Phys. 15 (2013) 19665–19672. DOI:10.1039/c3cp52876f |
| [6] | X.L. Xiao, Y.Z. Cheng, J. Peng, et al., Thermal expansion properties of A2(MO4)3(A=Ho and Tm; M=W and Mo). Solid State Sci. 10 (2008) 321–325. DOI:10.1016/j.solidstatesciences.2007.09.001 |
| [7] | B.A. Marinkovic, P.M. Jardim, R.R. de Avillez, F. Rizzo. Negative thermal expansion in Y2Mo3O12. Solid State Sci. 7 (2005) 1377–1383. DOI:10.1016/j.solidstatesciences.2005.08.012 |
| [8] | M.M. Wu, X.Z. Liu, D.F. Chen, Q.Z. Huang, H. Wu, Y.T. Liu. Structure phase transition, and controllable thermal expansion behaviors of Sc2-xFexMo3O12. Inorg. Chem. 53 (2014) 9206–9212. DOI:10.1021/ic501271t |
| [9] | M.P. Attfield. Strong negative thermal expansion in siliceous faujasite. Chem. Commun. (1998) 601–602. |
| [10] | M.P. Attfield, A.W. Sleight. Exceptional negative thermal expansion in AlPO4-17. Chem. Mater. 10 (1998) 2013–2019. DOI:10.1021/cm9801587 |
| [11] | J.S.O. Evans. Negative thermal expansion materials. J. Chem. Soc. Dalton Trans. (1999) 3317–3326. |
| [12] | T.A. Mary, A.W. Sleight. Bulk thermal expansion for tungstate and molybdates of the type A2M3O12. J. Mater. Res. 14 (1999) 912–915. DOI:10.1557/JMR.1999.0122 |
| [13] | Z.Y. Li, W.B. Song, E.J. Liang. Structures phase transition, and crystal water of Fe2-xYxMo3O12. J. Phys. Chem. C 115 (2011) 17806–17811. DOI:10.1021/jp201962b |
| [14] | W. Miller, C.W. Smith, D.S. Mackenzie, K.E. Evans. Negative thermal expansion: a review. J. Mater. Sci. 44 (2009) 5441–5451. DOI:10.1007/s10853-009-3692-4 |
| [15] | Y. Yamamura, S. Ikeuchi, K. Saito. Characteristic phonon spectrum of negative thermal expansion materials with framework structure through calorimetric Study of Sc2M3O12(M=W and Mo). Chem. Mater. 21 (2009) 3008–3016. DOI:10.1021/cm900965p |
| [16] | B.A. Marinkovic, M. Ari, R.R. de Avillez, F. Rizzo, F.F. Ferreira, K.J. Miller, M.B. Johnson, M.A. White. Correlation between AO6 polyhedral distortion and negative thermal expansion in orthorhombic Y2Mo3O12 and related materials. Chem. Mater. 21 (2009) 2886–2894. DOI:10.1021/cm900650c |
| [17] | X.L. Xiao, M.M. Wu, J. Peng, Y.Z. Cheng, Z.B. Hu. Negative thermal expansion of Yb2Mo3O12 and Lu2Mo3O12. Key Eng. Mater. 368- 372 (2008) 1662–1664. |
| [18] | X.L. Xiao, Y.Z. Cheng, M.M. Wu, J. Peng, Z.B. Hu. The study of thermal expansion properties in solid solutions Ln2-xCrxMo3O12(Ln=Ho and Lu) by high temperature X-ray diffraction. J. Phys. Chem. Solids 73 (2012) 275–279. DOI:10.1016/j.jpcs.2011.10.029 |
| [19] | B.A. Marinkovic, M. Ari, P.M. Jardim, R.R. de Avillez, F. Rizzo, F.F. Ferreira. In2Mo3O12: a low negative thermal expansion compound. Thermochim. Acta 499 (2010) 48–53. DOI:10.1016/j.tca.2009.10.021 |
| [20] | P.M. Forster, A. Yokochi, A.W. Sleight. Enhanced negative thermal expansion in Lu2W3O12. J. Solid State Chem. 140 (1998) 157–158. DOI:10.1006/jssc.1998.7967 |
| [21] | M.M. Wu, J. Peng, Y. Zu, R.D. Liu, Z.B. Hu, Y.T. Liu, D.F. Chen. Thermal expansion properties of Lu2-xFexMo3O12. Chin. Phys. B 21 (2012) 116102. DOI:10.1088/1674-1056/21/11/116102 |
| [22] | J.S.O. Evans, T.A. Mary. Structural phase transitions and negative thermal expansion in Sc2(MoO4)3. Int. J. Inorg. Mater. 2 (2000) 143–151. DOI:10.1016/S1466-6049(00)00012-X |
| [23] | Y.Z. Cheng, M.M. Wu, J. Peng, Z.X. Li, Z.B. Hu, R. Kiyanagi, J.S. Fieramosca, S. Short, J. Jorgensen. Structures, thermal expansion properties and phase transitions of ErxFe2-x(MoO4)3(0.0≤x≤2.0). Solid State Sci. 9 (2007) 693–698. DOI:10.1016/j.solidstatesciences.2007.04.018 |
| [24] | A.W. Sleight, L.H. Brixner. A new ferroelastic transition in some A2(MO4)3 molybdates and tungstates. J. Solid State Chem. 7 (1973) 172–174. DOI:10.1016/0022-4596(73)90152-7 |
| [25] | Y.Z. Cheng, X.L. Xiao, X.F. Liu, et al., Study of the structures and thermal expansion properties of solid solutions Yb2-xDyxW3O12(0≤x≤1.5 and 1.8≤x≤2.0). Phys. B: Condens. Matter 411 (2013) 173–177. DOI:10.1016/j.physb.2012.12.006 |
| [26] | E.J. Liang, H.L. Huo, J.P. Wang, M.J. Chao. Effect of water species on the phonon modes in orthorhombic Y2(MoO4)3 revealed by Raman spectroscopy. J. Phys. Chem. C 112 (2008) 6577–6581. DOI:10.1021/jp8013332 |
| [27] | H.M. Rietveld. A profile refinement method for nuclear and magnetic structures. J. Appl. Crystallogr. 2 (1969) 65–67. DOI:10.1107/S0021889869006558 |
| [28] | L.B. McCusker, R.B. Von Dreele, D.E. Cox, D. Lou, P. Scardi. Rietveld refinement guidelines. J. Appl. Crystallogr. 32 (1999) 36–50. DOI:10.1107/S0021889898009856 |