 2017, Vol. 28


 ,
Xiao-Quan Lub
,
Xiao-Quan Lub
b College of Chemistry and Chemical Engineering, Northwest Normal University, Lanzhou 730070, China
Tartrazine (TT) has been extensively used in peoples foods and drinks thanks to the excellent performance including brightness in color, inexpensive and free solubility in water, it also make foods more attractive. However, the TT would induce allergic and asthmatic reactions on the premise of intake some kinds of drugs (e.g. aspirin, benzoic acid), especially people with poor immunity [1]. More seriously, the studys have been reported that the excess level of TT can be harmful to health and cause diseases such as childhood hyperactivity, neurobehavioural poisonousness, reproductive toxicity and cancer [2-4]. Consequently, the use of TT in food products is strictly controlled by different national legislation. The United Nations Food and Agricultural Organization (FAO) and the World Health Organization (WHO) are identified and evaluated the acceptable daily intakes [5, 6]. The use of TT has formulated maximum limit of 0.1 g/kg (GB2760-2014) in China. Thus, it is significantly important to control the content and detect the concentration of TT in foods quickly.
Up to date, many methods have been reported for determination of TT, including visable spectrophotometry [7], fluorescence emission spectrometry [8], high performance liquid chromatography (HPLC) [9] and HPLC with tandem mass detectors (HPLC-MS/MS) [10]. Recently, electrochemical methods have obtained more and more application for determination of TT, owing to the advantages of convenience, speediness, high sensitivity and friendly to environment. Meanwhile, TT has electrochemical activity due to containing nitrogen-nitrogen double bond and phenolic hydroxy groups [11]. For example, Qiu et al. used graphene oxide and multi-walled carbon nanotubes nanocomposite to modify glassy carbon electrode (GO/MWCNTs/GCE) for determination of TT [12]. Wang et al. used ionic liquid graphene oxides and multi-walled carbon nanotubes to modify GCE (IL-GO-MWCNTs/GCE) for determination of TT was developed too [13]. Song et al. used exfoliation of graphite to produce a highly-sensitive electrochemical sensor for determination of TT [14]. It was reported that Cheng et al. used porous carbon to modify GCE (PC/GCE) for determination of TT [11].
N-Doped graphene natively grown on hierarchical porous carbon (N-PC-G), a novel nitrogen-doped hybrid carbon material, which is composed of hierarchical porous carbon micro blocks interconnected with in-situ grown graphene, has been reported by Liang et al. Remarkably, owning to the satisfactory structural properties, including large surface area, accessibility and good conductivity, this metal-free material has been used for electrochemical applications [15]. However, like porous carbon or graphene, N-PC-G is hydrophobic and tends to agglomerate irreversibly which limit its further application [16, 17]. Chitosan (CS), has been widely used for constructing sensors not only its dramatic properties including excellent film-forming ability, good adhesion and avirulence, but also its protonated to polycationic material in acid media and facilitates the electron transfer after its swelling in reaction mixture due to its hydrophilic nature [18-20]. In this paper, a kind of functionalized nanocomposite was prepared via a simple ultrasonic method of N-PC-G with CS. Furthermore, the prepared nanocomposite (N-PC-G/CS) was used as a novel electrochemical sensor platform for determination of TT and applied to soft drinks samples.
2. Results and discussion 2.1. Characterization of PC N-PC and N-PC-GThe morphology of prepared N-doped porous carbon (N-PC) and N-doped graphene natively rooted on hierarchical porous carbon (N-PC-G) samples were analysed using the scanning electron microscopy (SEM) and transmission electron microscopy (TEM). Fig. 1A shows the SEM images of the N-PC product, it was found that the ordered macropores of N-PC arranged regularly, and the diameter was about 150 nm. The images of the N-PC-G clearly show that typically crumpled and wrinkled of these graphene nanosheets, indicating it grown in-situ in porous carbon successfully (Fig. 1B). For observing further information of the samples microstructure, high resolution TEM measurement was employed, as shown in Fig. 1C. N-PC-G has a large number of mesoporous and microporous which located at the walls of large 3D ordered macropores, the diameter of the macropores measured from TEM images is about 150 nm, which is consistance with the SEM observations.

|
Download:
|
| Fig. 1. Typical SEM (scale bar = 200 nm) images of (A) N-PC (B) N-PC-G and (C) TEM (scale bar = 50 nm) images of N-PC-G. | |
In order to investigate and compare the status of elements in materials of analyzed by X-ray photoelectron spectroscopy (XPS). The survey sweep shows that primary elements of C1s N1s and O1s in samples Fig. 2A, and the atomic percentages are calculated to be 93.11%, 3.38% and 3.51%, indicating that nitrogen of successfully doped in hybrid carbon materials. The high resolution XPS scans C1s spectrum in Fig. 2B can be deconvoluted into four peaks, the higher peak at 284.7 eV is mainly close to the sp3 C—C bond in aromatic ring, another peak at 286.6 eV corresponds to C—OH, which is commonly observed on carbon material [21]. The emergence of the peak at 288.9 eV corresponding to C—N—C coordination suggested the bonding formation of doped nitrogen atoms to be sp3-C atoms, respectively [22]. And the enhancement of the peak at 292.05 eV corresponds to —COOH coordination [23]. The N1s peak can be also deconvoluted into three components (as shown in Fig. 2C), and the fitted peaks at 401.2, 399.5 and 398.2 eV are consistent with pyridinic-N, pyrrolic-N and graphitic-N [23, 24].

|
Download:
|
| Fig. 2. XPS spectra of N-PC-G: (A) the survey scan, (B) C 1s, and (C) N 1s XPS spectrum. (D) N2 adsorption–desorption isotherms of N-PC-G. Inset is pore size distribution. | |
The porosity of the materials was analyzes by nitrogen adsorption-desorption (Fig. 2D). The isotherm of N-PC-G shows significant hysteresis loop extending from 0.05 to 1.0, which indicate that porous carbon are consisting of mesopores and macropores, the raised adsorption amount at low pressure (P/P0 < 0.05) also suggests the existence of micropores. N-PC-G have a high BET surface area (541.627 m2/g) and the mesoporous size was calculated by BJH method is approximately 4.1 nm, which is consistance with the TEM observations.
Fourier transform infrared (FTIR) spectrum was taken to illustrate intermolecular interactions between components in the novel nanocomposites. Fig. 3A shows the FT-IR spectra of CS, N-PC-G and N-PC-G/CS. For CS, the spectrum showed the typical characteristic absorption bands, which are bands of peaks around 1045, 1087, 1153 cm-1 corresponding to the C—O stretching vibrations (υ(C—O—C)), while 1411 cm-1 and 1658 cm-1 are the characteristic peaks of CH3 symmetrical deformation mode and carbonyl group (C=O), and characteristic bands of peaks around 3421 cm-1 corresponding to the stretching vibration of N—H [25]. Moreover, the characteristic stretching frequency of N-PC-G was observed which are CH, υ(COOH) and OH at 1217 cm-1, 1666 cm-1 and 3437 cm-1, which are consistance with the XPS observations. Especially, FT-IR spectrum of N-PC-G/CS nanocomposites depicted a sharp and strong absorbance at 1638 cm-1 (corresponding to amide group), indicating that the —COOH groups of N-PC-G reacted with the —NH2 of CS and converts it to amide (—CONH—) group [26]. This unique band frequency clearly indicates the formation of new bonds between CS and N-PC-G.

|
Download:
|
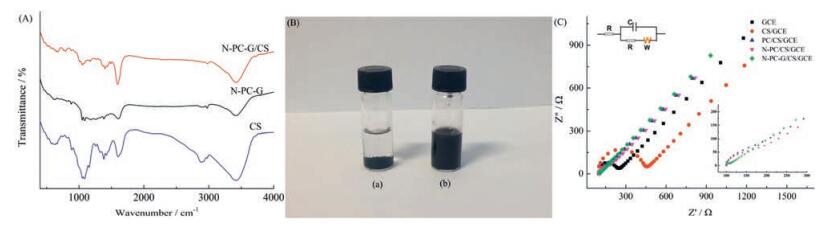
| Fig. 3. (A) FT-IR spectra for the images of CS, N-PC-G and N-PC-G/CS; (B) Digital photographs for aqueous dispersions of 1 mg/mL (a) N-PC-G and (b) CS dispersed N-PC-G; (C) Nyquist plots for 5.0 mmol/L Fe(CN)63-/4- in 0.1 mol/L KCl solution recorded at GCE, CS/GCE, PC/CS/GCE, N-PC/CS/GCE and N-PC-G/CS/GCE. | |
Fig. 3B shows the digital photographs that are aqueous dispersions of N-PC-G (a), and CS modified N-PC-G (b) stand 24 h after ultrasonication. It was found that the N-PC-G suspended in water eventually settled down after a period time, but the addition of CS resulted in a black colloidal dispersions without visible precipitation, implying that the colloidal dispersion of N-PC-G/CS have good dispersion and found to be stable for at least months.
2.2. Electrochemical characterization the interface of different modified electrodesThe different electrodes evaluate the conductivity by using electrochemical impedance spectroscopy (EIS). Fig. 3C shows the Nyquist diagrams of EIS for different modified electrodes, respectively. The semicircle portion at higher frequencies is related to the electron-transfer resistance (Ret), and the Nyquist plots are fitted using the Randle's equivalent circuit. It can be seen that a well-defined semicircle at higher frequencies is obtained at the bare GCE and the Ret value is about 149.7V. As for CS/GCE, the Ret value is ca. 335.5V, indicating that the CS on GCE hindered the electron transfer between the redox probe of Fe(CN)63-/4- and the electrode surface. For the PC/CS and N-PC/CS, the Ret value decreases to 61.98V and 60.79V, which indicated that the electron transfer resistance of Fe(CN)63-/4- is greatly decreased due to its good conductivity. Obviously, the EIS is almost straight lines of the decoration electrodes by N-PC-G/CS. It demonstrates that graphene improve the conductivity of materials and the N-PCG/CS nanocomposite is successfully immobilized on the GCE surface.
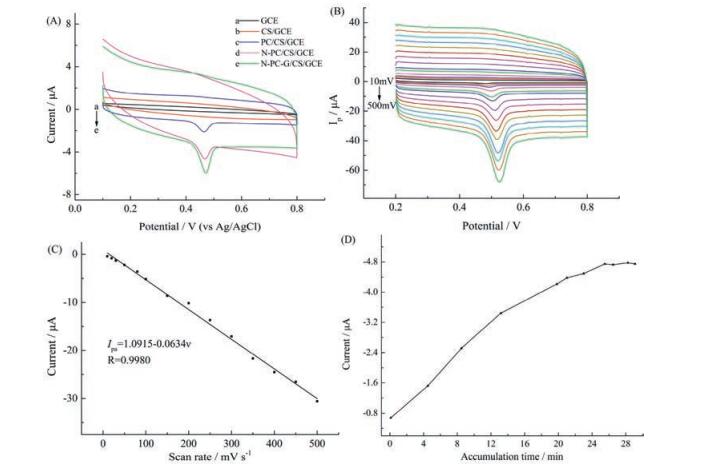
2.3. Electrochemical behaviors of TT at different modified electrodesThe electrochemical behavior of tartrazine (TT) is investigated by cyclic voltammetry (CV) in the 0.1 mol/L H2SO4. As show in Fig. 4A, an oxidation peak of TT and no reduction peak is observed in the reverses, suggesting it is a irreversible process, the bare GCE and CS modified GCE, they all have no obvious peak in the test, which indicates that the bare GCE and CS have poor electrochemical responses toward TT. Interestingly, for PC/CS modified GCE shows obvious oxidation peaks, suggesting that PC has some electrical conductivity and catalytic activity for TT [11]. The oxidation currents of TT on N-PC/CS/GCE, oxidation currents increases slightly to compare with previous one electrodes, this may be doping nitrogen improves the conductivity of materials. Interestingly, the oxidation peaks increase markedly on the surface of N-PC-G modified GCE, this excellent conductivity of N-PC-G results from the specific surface area and the synergistic effects of N-doped porous carbon and N-doped graphene. In conclusion, the prepared N-PC-G/CS increases effectively electrical conductivity and signal amplification ability, and further uses to construct electrochemical sensor for determination TT.

|
Download:
|
| Fig. 4. (A) CVs in 0.1 mol/L H2SO4 containing 5 μmol/L TTon the (a) GCE, (b) CS/GCE, (c) PC/CS/GCE, (d) N-PC/CS/GCE, (e) N-PC-G/CS/GCE; (B) CVs of N-PC-G/CS/GCE in 0.1 mol/L H2SO4 containing 5 μmol/L TT with different scan rates (10, 20, 30, 50, 80, 100, 150, 200, 250, 300, 350, 400, 450 and 500 mV/s); (C) Plot of peak current density vs. scan rates for TT; (D) The influence of accumulation time on the oxidation currents of 5 μmol/L TT. | |
2.4. Effect of scan rate
The influence of the scan rate (10-500 mV/s) on the oxidation current of tartrazine (TT) on this sensor is also investigated by CV (Fig. 4B). As can be seen in Fig. 4C, a linear correlation is found between anodic (Ipa) peak currents and scan rate (υ), suggesting that the oxidation of TT is still a typical adsorption-controlled electrode process, and the linear equation can be expressed as Ipa = 1.0915 -0.0634 υ (mV/s) (R = 0.9980) [12].
2.5. Effect of accumulation timeThe accumulation time of 5 μmol/LTT is demonstrated from 0 to 28 min with 0.1 mol/L H2SO4 on the N-PC-G/CS/GCE in Fig. 4D. The oxidation peak current increases remarkably within the first 24 min and then level off over time, indicating a saturated adsorption at N-PC-G/CS/GCE. Regrettably, this adsorption processes takes a length of time due to its high specific surface area for materials.
2.6. ChronocoulometryThe effective surface areas of GCE and N-PC-G/CS/GCE are compared by chronocoulometry in 0.1 mmol/L K3[Fe(CN)6] solution containing 1 mol/L KCl, the effective surface area (A) of working electrodes can be calculated according to Anson equation [27].

|
(1) |
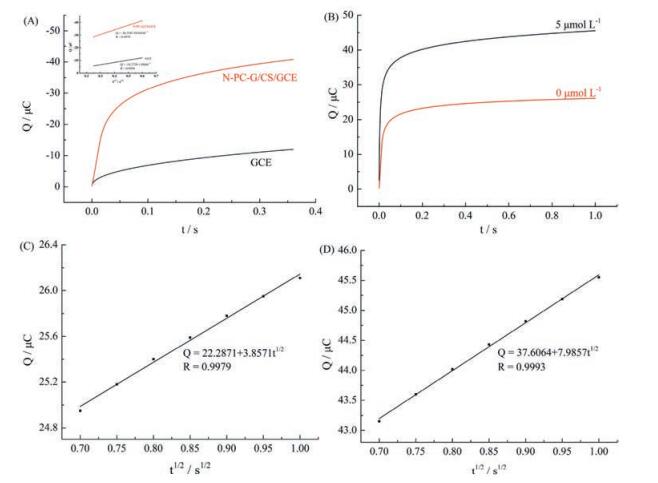
Where c is concentration of substrate, Qdl is double layer charge which can be eliminated by background subtraction and Qads is Faradaic charge. Other symbols have their usual meanings. The standard diffusion coefficient (D) of 0.1 mmol/L K3[Fe(CN)6] solution containing 1 mol/L KCl solution is 7.6 × 10⁻⁶ cm2/s [28]. As shown in Fig. 5A, A is worked out the 0.078 cm2 and 0.155 cm2 for bare GCE and N-PC-G/CS/GCE, respectively. These results indicated that the electrode effective surface area is increased significantly after modification with N-PC-G/CS, which can increase the adsorption of TT and enhance the current response.

|
Download:
|
| Fig. 5. (A) Plot of Q–t curves of the bare GCE and N-PC-G/CS/GCE in 0.1 mmol/L K3[Fe(CN)6] containing 1.0 mol/L KCl, inset: plot of Q–t1/2 curves on GCE and N-PC-G/CS/GCE; (B) plot of Q–t curves of N-PC-G/CS/GCE in 0.1 mol/L H2SO4 in the absence and presence of 5 μmol/L TT; (C) plot of Q–t1/2 curve in the absence solution on N-PC-G/CS/GCE; (D) plot of Q–t1/2 curve on N-PC-G/CS/GCE for 5 μmol/L TT. | |
The chronocoulometry experiments are also carried out in 0.1 mol/L H2SO4 blank solution and 5 μmol/L TT with N-PC-G/CS/GCE. As shown in Fig. 5B, the curve of charge (Q)-time (t) is recorded by absence and addition of 5 μmol/L food colorants. After transferring to Q-t1/2 plot, the Qdl (the charge devoted to doublelayer capacitance) is obtained according to the line of intercept (Fig. 5C). In the presence of 5 μmol/LTT (Fig. 5D), the intercept calculated from Q-t1/2 plot represents the summation of Qdl and Qads (the charge derived from adsorbed species) [11]. Thus, the values of Qads on different food colorants are easily obtained, the Qads value of TT is 15.3 μC. These phenomena demonstrates that the N-PC-G/CS has electrochemical enhancement abilities and strong adsorption ability.
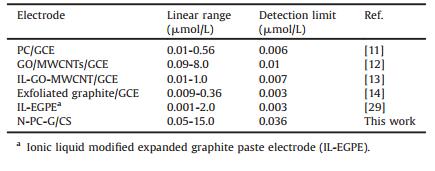
2.7. Electrochemical determination of TTDifferential pulse voltammetry (DPV) is selected for the determination of trace amounts of TT in 0.1 mol/L H2SO4. Fig. 6A shows the DPV responses of TT at N-PC-G/CS modified electrodes, a good linear relationship between the peak current and TT concentration is obtained in the range from 0.05 μmol/L to 15.0 μmol/L, obeying following linear regression: Ipa1 (μA) = 0.0527 -1.1443C (μmol/L) (R = 0.9934) and Ipa2 (μA) = -5.4896 -0.721C (μmol/L) (R = 0.9970) (Fig. 6B), and the determination limit was calculated as 0.036 μmol/L (S/N = 3). Table 1 gives the comparison of some of the analytical parameters obtained for TT in this study with other previous literatures. As can be observed, the modified electrode shows the TT liner range is wider than those obtained PC/GCE [11], GO/MWCNTs/GCE [12], and IL-GO-MWCNT/GCE [13], the determination limits are also shows a comparable with other electrodes. Although few modified electrodes like IL-EGPE [29] show advantageous linear range or detection limit, it is also apparent from Table 1 that the developed sensor shows better analytical performance toward TT and demonstrates wide linear range and low detection limits. These results certify that the N-PC-G/CS as advanced electrochemical sensor for TT determination is an appropriate and receivable platform.

|
Download:
|
| Fig. 6. (A) DPV of TT at N-PC-G/CS/GCE in 0.1 mol/L H2SO4; (B) the concentration calibration curves of the DPV current responses for TT. | |
|
|
Table 1 Comparison of the analytical performance between this sensor and the reported electrochemical sensors based on solid state working electrode. |
2.8. Reproducibility and stability
To demonstrate the repeatability of the modified electrode, a 5 μmol/L solution of TT is determined 30 times using the fabricated electrode, the relative standard deviation (RSD) is 2.93%. The stability of the sensors is also investigated in the same solution with five different electrodes, which are fabricated independently by the same procedure and the RSD is 2.91%. The long-term stabilities are also evaluated by storing of the two modified electrodes in air at room temperature for the standby application, the current response retains approximately 97.26% of the original activity to TT after a week, and the value reserves 97.15% until two weeks later. It indicates that modified electrode has the particularly excellent repeatability and stability.
2.9. Anti-interferenceAnti-interference is another advantage of modified electrode investigated for the detection of TT. Experiments are carried out with adding potential interfering substances into 0.1 mol/L H2SO4 containing 3 μmol/L TT. No influence on the detection of TT is found after the addition of 800-fold concentrations of glucose and glycine, 500-fold concentrations of citric acid and sodium citrates; 200-fold concentrations of vitamin C, 100-fold concentrations of Fe3+, Ca2+, Cu2+, Mg2+, Na+, Cl-, NO3-, SO42- and 5-fold Ponceau 4R and Sunset Yellow. A relative error of ±6% is considered tolerable.
2.10. Practical applicationIn order to illustrate the validity of the methods for real sample analysis, the soft drinks which containing TT is purchased from a local supermarket, and diluted 200 times with 0.1 mol/L H2SO4 to fit the calibration curve before the survey. Typical results are listed in Table 2, which is obtained by the standard addition method. Each sample solution is determined three parallel tests, the RSD of less than 1% and the value of recovery is in the range of 97.0%-102.0%, suggesting that detection of TT using N-PC-G/CS/GCE is accurate and feasible.
|
|
Table 2 Determination of TT levels in soft drinks by N-PC-G/CS/GCE. |

3. Conclusion
In summary, N-PC-G/CS was prepared via simple ultrasonic method between chitosan (CS) and N-Doped graphene natively grown on hierarchical porous carbon (N-PC-G). The nanocomposite displays excellent sensitivity and high conductivity toward the oxidation of TT. Under optimized conditions, the modified electrode shows excellent electrochemical performance of TT with wide linear range, low limit of detection, good reproducibility, long-term stability and well anti-interference. Furthermore, the sensor can be effectively applied to the determination of TT in soft drinks.
4. Experimental 4.1. Chemicals and ReagentsTartrazine (TT) waspurchased from Sigma, dissolved to 1.0 mg/mL standard solution of using double distilled and stored in fridge. Phenol, formaldehyde solution, potassium persulfate, melamine, styrene (ST), polyvinyl pyrrolidone (PVP, MW 58000) were obtained from Aladdin, and triblock polymeric surfactant (F127) were purchased from Energy chemical (Sahn chemical technology Co., Ltd., Shanghai, China). All chemicals are of analytical grade and used directly. Double distilled water and nitrogen gas (99.99%) were used for all experiments. All the experiments were performed at room temperature.
4.2. ApparatusThe scanning electron microscopy (SEM) image was collected on a JSM-6701F (Japan). The high resolution transmission electron microscopy (HRTEM) image was acquired by FEI-Tecnai G2 TF20 electron microscope (America) operating at HT200 kV. X-ray photoelectron spectroscopy (XPS) was made based on PHI-5702 (USA). Electrochemical impedance spectra (EIS) were conducted by Princeton Applied Researcher (USA). Nitrogen adsorption-desorption isotherms were performed on an ASAP 2010 instrument (Micromeritics, USA) at -195 ℃. Prior to analysis, the samples were degassed for 6 h at 373 K. Impedance measurements were performed with the frequencies swept from 104 Hz to 0.1 Hz. A Randle's equivalent circuit was used to fit the obtained impedance spectra. Electrochemical experiments and measurements were performed at a CHI660 B electrochemical workstation (Shanghai Chenhua Co., China). A conventional three electrode system was used throughout the measurements. A bare or modified glassy carbon electrode (GCE, CHI104, Φ = 3 mm, Gaoss Union Co., Ltd., Wuhan, China) was employed as working electrode, a platinum column as the counter electrode and an Ag/AgCl electrode (saturated KCl) as the reference. The determination of TT was carried out using chronocoulometry (CC) cyclic voltammetry (CV) and differential pulse voltammetry (DPV).
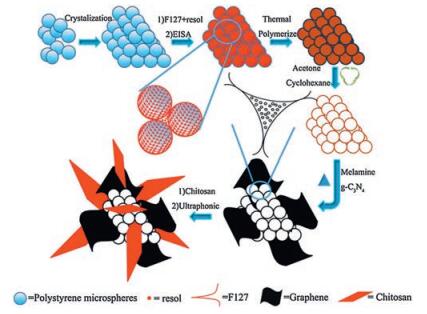
4.3. Preparation of N-PC-G/CS nanopositesN-doped porous carbon (N-PC) and N-doped graphene natively rooted on hierarchical porous carbon (N-PC-G) were prepared according to the methods of Liang's paper [15]. To put it in a nutshell, the materials was synthesized by dual template methods, polystyrene microspheres, triblock polymeric surfactant (F127) and resol have been used the hard template, the soft template and the carbon precursor, respectively. F127 and resol via evaporation induced self-assembly (EISA) process resulted a 2D mesostructure at the aperture of PS hard templates [30], whereafter, resol turned into a rigid phenolic resin (PF) by thermally cross-linked process. The residual templates were washed off by a recyclable acetone and cyclohexane mixture then produced a porous resin (OP-PF). This resin, melamine and graphitic carbon nitride (g-C3N4 prepared by heating melamine in air at 550 ℃ for 4 h) were finely ground in an agate mortar with the weight ratio of the three substances 1:5:5, subsequently heated up to 900 ℃ and obtained the final N-PC-G in argon atmosphere. Nitrogen-doped porous carbon (N-PC) without the in-situ grown graphene also was prepared by via similar heating process, but it was separated the OP-PF and melamine/g-C3N4 in two independent quartz boats in the furnace tube. For comparing and analyzing the influence of nitrogen doping, porous carbon (PC) was obtained with porous resin heated to 900 ℃ directly.
Then the 5 mg chitosan was dissolved in 100 mL acetic acid (1.0%) solution. At last, N-PC-G/CS (0.1 mg/mL) was prepared with dispersing N-PC-G to chitosan solution by ultrasonic for 24 h. The main idea was illustrated in Scheme 1. Similarly, N-PC/CS and PC/CS were acquired in same process with concentration of solution all 0.1 mg/mL.

|
Download:
|
| Scheme1. Schematic diagram of the N-PC-G/CS preparation processes. | |
4.4. Preparation of modified electrodes
The bare GCE (3 mm in diameter) was polished with 0.3 and 0.05 μm α-alumina slurries prior to use, then washed with 1:1 nitric acid, absolute ethanol and double distilled water in an ultrasonic bath, and then dried with high-purity nitrogen. Then 5 μL N-PC-G/CS (0.1 mg/mL) dispersion solutions was gingerly dropped onto the fresh prepared surface of GCE and dried at room temperature. By contrast, CS/GCE, PC/GCE and N-PC/GCE were fabricated by the same procedure.
AcknowledgmentsThis work is supported by the National Natural Science Foundation of China (Nos. 21165016, 21175108, 21265018) and the Science and Technology Support Projects of Gansu Province (Nos. 1011GKCA025, 090GKCA036, 1208RJZM289).
| [1] | J.J.B. Nevado, C.G. Cabanillas, A.M.C. Salcedo. Simultaneous spectrophotometric determination of three food dyes by using the first derivative of ratio spectra. Talanta 42 (1995) 2043–2051. DOI:10.1016/0039-9140(95)01695-3 |
| [2] | K.S. Rowe, K.J. Rowe. Synthetic food coloring and behavior: a dose response effect in a double-blind placebo-controlled, repeated-measures study. J. Pediatr. 125 (1994) 691–698. DOI:10.1016/S0022-3476(06)80164-2 |
| [3] | J.F. Borzelleca, J.B. Hallagan. Chronic toxicity/carcinogenicity studies of FD & C Yellow No. 5(tartrazine) in rats. Food Chem. Toxicol. 26 (1988) 179–187. DOI:10.1016/0278-6915(88)90117-2 |
| [4] | T. Tanaka. Reproductive and neurobehavioural toxicity study of Ponceau 4R administered to mice in the diet. Food Chem. Toxicol. 44 (2006) 1651–1658. DOI:10.1016/j.fct.2006.05.001 |
| [5] | European Parliament and Council Directive 94/36/EC. Council directive 94/43/EC of 27 July 1994 establishing annex VI to directive 91/414/EEC concerning the placing of plant protection products on the market. Off. J. L 227 (1994) 31–55. |
| [6] | K.S. Minioti, C.F. Sakellariou, N.S. Thomaidis. Determination of 13 synthetic food colorants in water-soluble foods by reversed-phase high-performance liquid chromatography coupled with diode-array detector. Anal. Chim. Acta 583 (2007) 103–110. DOI:10.1016/j.aca.2006.10.002 |
| [7] | J.J. Berzas, J.R. Flores, M.J.V. Llerena, N.R. Farinas. Spectrophotometric resolution of ternary mixtures of Tartrazine, Patent Blue V and Indigo Carmine in commercial products. Anal. Chim. Acta 391 (1999) 353–364. DOI:10.1016/S0003-2670(99)00215-9 |
| [8] | E. Din?, E. Baydan, M. Kanbur, F. Onur. Spectrophotometric multicomponent determination of sunset yellow, tartrazine and allura red in soft drink powder by double divisor-ratio spectra derivative, inverse least-squares and principal component regression methods. Talanta 58 (2002) 579–594. DOI:10.1016/S0039-9140(02)00320-X |
| [9] | M. Yamada, M. Nakamura, T. Yamada, T. Maitani, Y. Goda. Structural determination of unknown subsidiary colors in food yellowNO.5(Sunset Yellow FCF). Chem. Pharm. Bull. 44 (1996) 1624–1627. DOI:10.1248/cpb.44.1624 |
| [10] | T.T. Zou, P.L. He, A. Yasen, Z. Li. Determination of seven synthetic dyes in animal feeds and meat by high performance liquid chromatography with diode array and tandem mass detectors. Food Chem. 138 (2013) 1742–1748. DOI:10.1016/j.foodchem.2012.11.084 |
| [11] | Q. Cheng, S.H. Xia, J.H. Tong, K.B. Wu. Highly-sensitive electrochemical sensing platforms for food colourants based on the property-tuning of porous carbon. Anal. Chim. Acta 887 (2015) 75–81. DOI:10.1016/j.aca.2015.06.013 |
| [12] | X.L. Qiu, L.M. Lu, J. Leng, et al., An enhanced electrochemical platform based on graphene oxide and multi-walled carbon nanotubes nanocomposite for sensitive determination of Sunset Yellow and Tartrazine. Food Chem. 190 (2016) 889–895. DOI:10.1016/j.foodchem.2015.06.045 |
| [13] | M.L. Wang, J.W. Zhao. A facile method used for simultaneous determination of Ponceau 4R, allura red and Tartrazine in alcoholic beverages. J. Electrochem. Soc. 162 (2015) H321–H327. DOI:10.1149/2.0111506jes |
| [14] | X.J. Song, Z. Shi, X. Tan, et al., One-step solvent exfoliation of graphite to produce a highly-sensitive electrochemical sensor for tartrazine. Sens. Actuators B Chem. 197 (2014) 104–108. DOI:10.1016/j.snb.2014.02.064 |
| [15] | J. Liang, X. Du, C. Gibson, X.W. Du, S.Z. Qiao. N-doped graphene natively grown on hierarchical ordered porous carbon for enhanced oxygen reduction. Adv. Mater. 25 (2013) 6226–6231. DOI:10.1002/adma.201302569 |
| [16] | Z. Li, Z.Z. An, Y.Y. Guo, et al., Au-Pt bimetallic nanoparticles supported on functionalized nitrogen-doped graphene for sensitive detection of nitrite. Talanta 161 (2016) 713–720. DOI:10.1016/j.talanta.2016.09.033 |
| [17] | Y. Zhang, M. Su, L. Ge, et al., Synthesis and characterization of graphene nanosheets attached to spiky MnO2 nanospheres and its application in ultrasensitive immunoassay. Carbon 57 (2013) 22–33. DOI:10.1016/j.carbon.2013.01.012 |
| [18] | B.C. Janegitz, L.H. Marcolino-Junior, S.P. Campana-Filho, R.C. Faria, O. FatibelloFilho. Anodic stripping voltammetric determination of copper(Ⅱ) using a functionalized carbon nanotubes paste electrode modified with crosslinked chitosan. Sens. Actuators B Chem. 142 (2009) 260–266. DOI:10.1016/j.snb.2009.08.033 |
| [19] | S.J. Ling, R. Yuan, Y.Q. Chai, T.T. Zhang. Study on immunosensor based on gold nanoparticles/chitosan and MnO2 nanoparticles compositemembrane/Prussian blue modified gold electrode. Bioprocess Biosyst. Eng. 32 (2009) 407–414. DOI:10.1007/s00449-008-0260-2 |
| [20] | B. Batra, C.S. Pundir. An amperometric glutamate biosensor based on immobilization of glutamate oxidase onto carboxylated multiwalled carbon nanotubes/gold nanoparticles/chitosan composite film modified Au electrode. Biosens. Bioelectron. 47 (2013) 496–501. DOI:10.1016/j.bios.2013.03.063 |
| [21] | H. Darmstadt, C. Roy, S. Kaliaguine, S.J. Choi, R. Ryoo. Surface chemistry of ordered mesoporous carbons. Carbon 40 (2002) 2673–2683. DOI:10.1016/S0008-6223(02)00187-2 |
| [22] | A. Thomas, A. Fischer, F. Goettmann, et al., Graphitic carbon nitride materials: variation of structure and morphology and their use as metal-free catalysts. J. Mater. Chem. 18 (2008) 4893–4908. DOI:10.1039/b800274f |
| [23] | Y. Zheng, Y. Jiao, J. Chen, et al., Nanoporous graphitic-C3N4@carbon metal-free electrocatalysts for highly efficient oxygen reduction. J. Am. Chem. Soc. 133 (2011) 20116–20119. DOI:10.1021/ja209206c |
| [24] | J. Liang, Y. Zheng, J. Chen, et al., Facile oxygen reduction on a threedimensionally ordered macroporous graphitic C3N4/carbon composite electrocatalyst. Angew. Chem. 51 (2012) 3892–3896. DOI:10.1002/anie.v51.16 |
| [25] | W.W. Thein-Han, R.D.K. Misra. Biomimetic chitosan-nanohydroxyapatite composite scaffolds for bone tissue engineering. Acta Biomater. 5 (2009) 1182–1197. DOI:10.1016/j.actbio.2008.11.025 |
| [26] | J. Venkatesan, Z.J. Qian, B. Ryu, N.A. Kumar, S.K. Kima. Preparation and characterization of carbon nanotube-grafted-chitosan-natural hydroxyapatite composite for bone tissue engineering. Carbohyd. Polym. 83 (2011) 569–577. DOI:10.1016/j.carbpol.2010.08.019 |
| [27] | F.C. Anson. Application of potentiostatic current integration to the study of the adsorption of cobalt (Ⅲ)-(ethylenedinitrilo(tetraacetate) on mercury electrodes. Anal. Chem. 36 (1964) 932–934. DOI:10.1021/ac60210a068 |
| [28] | R.N. Adams. Electrochemistry at Solid Electrodes, New York: Marcel Dekker Inc., 1969 . |
| [29] | J. Zhang, X. Wang, S.B. Zhang, et al., An electrochemical sensor for simultaneous determination of ponceau 4R and tartrazine based on an ionic liquid modified expanded graphite paste electrode. J. Electrochem. Soc. 161 (2014) H453–H457. DOI:10.1149/2.0271409jes |
| [30] | Y. Meng, D. Gu, F.Q. Zhang, Y.F. Shi, et al., Ordered mesoporous polymers and homologous carbon frameworks: amphiphilic surfactant templating and direct transformation. Angew. Chem. 117 (2005) 7215–7221. DOI:10.1002/(ISSN)1521-3757 |