 2017, Vol. 28


b Laboratory of Clinic, People's Hospital of Gaomi City, Shandong 261000, China;
c Tianjin Key Laboratory of Biosensing and Molecular Recognition, Tianjin 300071, China;
d State Key Laboratory of Medicinal Chemical Biology, Tianjin 300071, China;
e Collaborative Innovation Center of Chemical Science and Engineering, Tianjin 300071, China
Human serum is the important source of industrial scale pharmaceutical proteins, such as human serum albumin (HSA) and immunoglobulin (Ig) [1, 2]. Protein pharmaceuticals are becoming more and more necessary for the treatment of diseases due to the characteristics of high-activity, strong specificity and low toxicity. However, the structure of protein is susceptible to the environmental conditions in the production and storage. For instance, high temperature results in the unfolding of the protein structure [3] and a protein pharmaceutical with unfolded conformation leads to the reduction of therapeutic activity or even triggers severe immune responses [4]. Therefore, understanding the thermal stability of human serum proteins is very essential in processing of protein products.
Spectroscopic technique has been applied to the exploration of thermal denaturation and conformational changes of proteins, such as circular dichroism (CD) and infrared (IR) spectroscopy [5, 6]. These methods exhibit high accuracy, but they may not be suitable for the direct analysis of the complex biological sample. CD spectroscopy is a typical method for detecting the heat-induced structure changes of protein [5]. However, the requirement of a dilute and high-purity solution restricts the application in the analysis of biological samples. In amide bands of IR spectra, the amide Ⅰ band (C=O stretching), which contains the information about α-helix, β-sheet, β-turn and random coil structures of protein, is the most critical one to probe the secondary structure changes of proteins in aqueous solution during heat-induced denaturation [6]. Whereas IR band arising from the bending mode of water (vapor) appears in amide Ⅰ region, adding interference to or overlapping on the band of amide Ⅰ. Therefore, it is difficult to directly measure the spectra of serum samples using IR spectros-copy.
Near-infrared (NIR) spectroscopy has been proved to be powerful for studying the structure and the hydration of the proteins in aqueous solution [4, 7]. At first, NIR spectroscopy can directly be used to analyze real biological samples without pretreatment. On the other hand, both the information about the secondary structure and the hydration of the proteins can be obtained from NIR spectroscopy because the bands arising from protein and water are separated in NIR region [8-10]. More importantly, the changes of water structure caused by various perturbations can be easily detected with NIR light. Using the information from water absorbance bands or absorbance patterns in NIR region could provide a distinctive knowledge of water structures and intrinsic interactions between water and other components of the aqueous system. For these studies, a new concept "aquaphotomics" was proposed [11], in which water is considered to be composed of different species with different numbers of hydrogen bonds. The changes in the contents of different water species with the variation of temperature have been detected by NIR spectroscopy [12, 13]. NIR aquaphotomics may provide new ways for the analysis of aqueous and biology systems. NIR spectroscopy has been successfully employed for studying the temperature dependent structural changes and hydration of HSA or ovalbumin in water [8, 14]. In most of the studies, the spectra in the range of 7500-5300 cm-1 and 4900-4200 cm-1 are generally selected to investigate the changes of hydration and protein structure, respectively [8-10, 14]. Beside the prepared solution of proteins, NIR spectroscopy has been used in the analysis of real samples, such as the toothpaste for monitoring quality [15], the serum for disease diagnosis [16] and the urine for the quantification of albumin [17]. For the qualitative analysis of proteins in real biological samples such as human serum, however, the absorption bands due to proteins are weaker than those arising from water, and the absorbance of coexisting organic compounds, such as fat, sugar, and cholesterin, is included in the spectra. Therefore, it is difficult to extract the information about protein structure directly from the overlapped NIR spectra of human serum. It is necessary to apply appropriate approaches to improve the resolution of the spectra and, more importantly, methods for selecting the characteristic variables associated with the proteins from the spectra.
Chemometrics provides opportunities for analyzing complex signals. Various methods for signal processing, resolution of overlapping signals, informative variable selection and modeling have been developed. For example, wavelet transform (WT) has been proved to be a high performance signal-processing technique [18, 19]. WT with commonly used wavelet functions can be regarded as a smoothing and a differentiation process. By using an appropriate scale parameter, both resolution and signal-tonoise ratio of the signal can be improved [20, 21]. For building the quantitative models, variable selection has been a challenging problem due to its complexity and difficulty. For modeling NIR spectra, for instance, interval partial least squares (iPLS) [22], stepwise regression analysis (SRA) [23], optimization methods [24, 25], competitive adaptive reweighted sampling (CARS) [26], uninformative variable elimination (UVE) [27] and its variants [28, 29] have been proposed. Among these methods, Monte Carlouninformative variable elimination (MC-UVE) method proposed in our previous work [28] is one of the simple and efficient methods for selecting the informative wavelengths in NIR spectral analysis. The method evaluates the variables statistically and then selects the variables with higher statistical value. Therefore, MC-UVE is a time-saving method in computation for large data sets. Additionally, when it is combined with WT, the method can produce more efficient model [28].
The aim of this work is to discuss the feasibility of MC-UVE method for selecting the characteristic variables associated with the proteins from the NIR spectra of human serum samples, then to understand the thermal stability of serum proteins with the selected variables. Continuous wavelet transform (CWT) was used to improve the resolution of NIR spectra for increasing the accuracy of the variable selection. The valuable information embedded in the selected spectral variables was studied for the structural changes of proteins with the increase of temperature. Moreover, the changes of various water species were also investigated using the selected spectral variables.
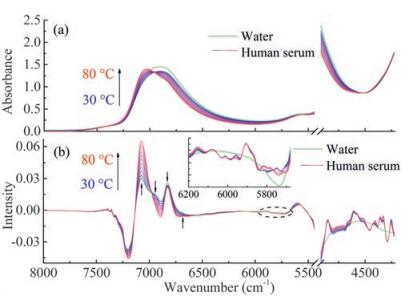
2. Results and discussion 2.1. Transformed spectra by CWTTemperature-dependent NIR spectra were used for understanding the thermal stability of human serum samples. Fig. 1(a) shows the spectra of a human serum sample at temperatures from 30 ℃ to 80 ℃ with the step of 5 ℃ and the spectrum of water at 30 ℃ in the regions of 8000-5440 cm-1 and 4920-4220 cm-1. The band of 5440-4920 cm-1 is removed in this paper because of the saturated spectral absorption. The broad peak near 7000 cm-1 arises from the O—H stretching combination of ν1 (symmetric stretching mode) + ν3 (antisymmetric stretching mode). Obviously, the peak is an overlap of the absorptions arising from the O—H groups in different water species, i.e., the O—H without hydrogen bonding and the hydrogen bonded O—H in different size water clusters [11, 12]. As the temperature increases, the position of the peak apparently shifts to a high wavenumber direction. It should be explained as the relative intensity changes of the absorptions due to different O—H groups in water clusters with different hydrogen bonding [13, 30]. It is difficult, however, to find more spectral information of water clusters from the spectra. Moreover, compared with the spectra of water from 4920 cm-1 to 4220 cm-1, no bands arising from the proteins can be observed from the spectra of the human serum. Therefore, it is necessary to improve the resolution of the spectra.

|
Download:
|
| Fig. 1. Measured (a) and transformed (b) spectra by CWT of water at 30℃ and a human serum from 30℃ to 80℃ with a step of 5 ℃. The inset is the enlarged spectra in the range of 6200–5580 cm-1 | |
To enhance the resolution of the NIR spectra, CWT with "Sym2" wavelet filter was adopted to calculate the transformed spectra, as depicted in Fig. 1(b). Because CWT with "Sym2" is an approximate equivalence of the second derivative, negative peaks correspond to the positive absorption in the raw spectra. Therefore, the intensity of the transformed spectra was reversed in plotting the figure for using the positive peaks in the following discussions. From the spectra, it can be seen that the broad peak around 7000 cm-1 becomes into a curve of high resolution. Obvious peaks at 7074, 6951, 6827 and 6700 cm-1 can be found. According to the Water Matrix Coordinates (WAMACS) of aquaphotomics [11], the variables at 7074, 6951, 6827 and 6700 cm-1 are ascribed to the water species with no, one, two and three hydrogen bonds (S0, S1, S2 and S3), respectively. In the regions of 6200-5580 cm-1 and 4920-4220 cm-1, it is clear that many peaks which do not exist in the transformed spectrum of water can be observed in the transformed spectrum of the human serum. These peaks should be caused by the solutes like the proteins in the solution. Therefore, CWT is an effective tool for improving resolution of the NIR spectra.
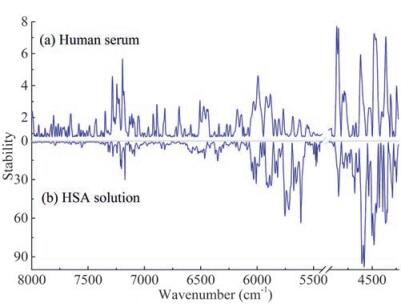
2.2. Feasibility of MC-UVE method to select the variables associated with human serum proteinsFor the calculation of UVE, the spectra of human serum samples were divided into two sets, i.e., the training set and the assessing set. To evaluate the reliability of each variable, the stabilities for the variables were calculated by MC-UVE through the 39 spectra measured at 30 ℃ of human serum samples in the training set. Fig. 2(a) shows the result. According to the method, the larger the stability is, the more relevant the corresponding variable is to the target analyte [28]. From Fig. 2(a), it can be seen that the variables with high stability distribute in the bands of 7200-6700, 6500, 6050-5765 and 4920-4220 cm-1. Furthermore, the variables with the largest stability are mainly located in the region of 4920-4220 cm-1, which is the information rich band about the protein [31]. The variables in the range from 7200 cm-1 to 6700 cm-1 also have appropriate stability for the human serum proteins. They can provide the spectral information of the structural changes of water species.

|
Download:
|
| Fig. 2. Distribution of the stabilities for the variables in the spectra of human serum (a) and HSA solution (b), respectively. | |
To verify the relationship between the high-stability variables and the human serum proteins, the spectra of 14 prepared HSA solution samples were measured at the same temperature. Then, the stabilities for the variables in the spectra were calculated by the same method through the transformed spectra. The result is shown in Fig. 2(b). It can be seen that the distribution of the stability is similar to that in Fig. 2(a), especially in the information rich regions about the protein. For instances, the variables around 5750, 4850, 4600 and 4350 cm-1 have the relatively high stability. These variables can be assigned to the α-helix (5750 and 4350 cm-1) [32, 33], the amide A/Ⅱ (4850 cm-1), i.e. the combination mode of amide A (free N—H stretching) and amide Ⅱ (N—H bending) [31], and the amide B/Ⅱ (4600 cm-1), i.e. the combination mode of amide B (hydrogen-bonded N—H stretching) and amide Ⅱ [31] of proteins, respectively. They are typical spectral bands showing the structural information of proteins. However, differences can be seen in the region of 5750-5440 cm-1 (the O—H combinations of bend, antisymmetric stretch and libration of water [34]). This may be explained by the complex components in human serum. The complexity weakens the relationship between the spectra and the human serum proteins. The result indicates that it is feasible and necessary for selecting the variables related to human serum proteins.
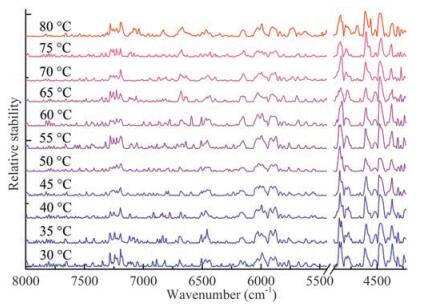
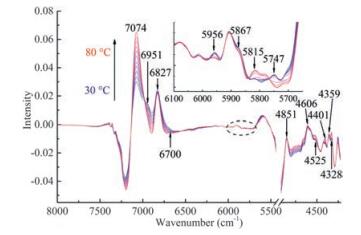
2.3. Selected variables associated with human serum proteinsTo further investigate the variables related to the serum proteins, the stabilities of the variables in the spectra of the serum samples measured at all temperatures were calculated respectively with the same method. The results are compared in Fig. 3. Clearly, similar results are obtained for the spectra of different temperatures although slight difference can be seen. Then ranking the variables with the stability, the optimal numbers of the informative variables for the 11 temperatures were obtained by the predictability of the partial least squares (PLS) model built with different number of the high stability variables. The number corresponding to the lowest root mean squared error of prediction (RMSEP) of the assessing set was selected. The optimal numbers of the selected variables are 325, 270, 310, 295, 505, 320, 360, 350, 395, 465 and 550, respectively. Finally, the union of the selected variables for all the temperatures was taken as the informative ones. Furthermore, 14 variables, as shown in Fig. 4, were selected as the representatives, because the variables around a peak have the same meaning for explanation of the spectra. The structural assignments of the 14 variables are summarized in Table 1.

|
Download:
|
| Fig. 3. Distribution of the stabilities for the variables in the spectra of human serum at the temperatures from 30 ℃ to 80 ℃. | |

|
Download:
|
| Fig. 4. Selected variables from the transformed spectra of the human serum measured at different temperatures. The inset is the enlarged spectra in the range of 6200–5580 cm-1. | |
|
|
Table 1 Assignments of the selected variables in the spectra of human serum. |
The four variables in the region of 7500-6200 cm-1 are attributed to the structure of water species, and the other ten variables in 6200-5440 cm-1 and 4920-4220 cm-1 are assigned to the structure of the serum proteins. The variables at 7074, 6951, 6827 and 6700 cm-1 are ascribed to the S0, S1, S2 and S3, respectively. The variables at 5747 and 4359 cm-1 have been assigned to the α-helix structure in the previous literatures [32, 33]. Because the intensity variation of the variables at 5956 and 5867 cm-1 with temperature is very similar to those of 5747 and 4359 cm-1, they are inferred as the assignment of the α-helix structure. Likewise, the variable at 5815 cm-1 may be related to the β-sheet structure of proteins, because the intensity change of 5815 cm-1 is consistent with that of the variables at 4525, 4401 and 4328 cm-1 which are due to the β-sheet structure of proteins [32, 33, 35]. Besides α-helix and β-sheet structure, the random coil is also one of the secondary structures of proteins. Nevertheless, the spectral variables related to the random coil were not identified due to the complexity of human serum. The variables at 4851 cm-1 and at 4600 cm-1 reflect the spectral information of amide A/Ⅱ and amide B/Ⅱ in the protein, respectively [31]. Therefore, a majority of the variables are correlated with the proteins, however, four variables connected with water are also chosen. Because the selected variables are all associated with the proteins in human serum, thermal stability of the proteins can be discussed using the intensity variation of these variables with temperature.
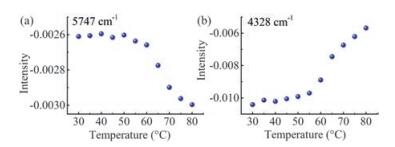
2.4. Structural changes of serum proteins with temperatureIn order to investigate the structural information of the selected variables, the spectral intensity of two variables at 5747 and 4328 cm-1, which are associated with α-helix and β-sheet structure, respectively, were studied. Fig. 5(a) and (b) displays the intensity change of the two variables with temperature. As can be seen from Fig. 5(a), the intensity is almost a constant with a slight fluctuation before 55 ℃. When the temperature is over 60 ℃, however, the intensity decreases sharply. The result indicates that the content of α-helix structure drops significantly at the temperature, demonstrating that the structural changes occur in the range of 55-60 ℃. For the variable shown in Fig. 5(b), however, there is a slight increase before 55 ℃, but there is an apparent increase after 60 ℃. This clearly shows that an increase of the β-sheet content happens when the content of the α-helix decreases after 55 ℃, or the structure of α-helix begin to convert into β-sheet when the temperature is over 60 ℃ [36]. The results can be explained by the heat-induced unfolding of the secondary structure and indicate the beginning of the denaturation for human serum proteins. It should be noted that only a beginning temperature of denaturation was observed for the serum sample containing a variety of proteins. The reason should be that HSA and Ig are two main components of the serum sample, and the denaturation of HSA and Ig both begins around 60 ℃ according to the results obtained with IR and CD spectroscopy [36, 37].

|
Download:
|
| Fig. 5. Intensity variation of the variables at 5747 (a) and 4328 (b) cm-1 with temperature. | |
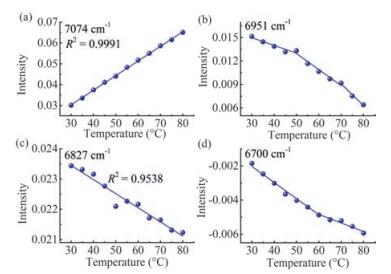
It may be more interesting that the spectral variables in the region of 7500-6200 cm-1 reflecting the spectral information of water were also selected in Table 1. To analyze the variation of the variables at 7074, 6951, 6827 and 6700 cm-1 with temperature, the intensity variation is shown in Fig. 6. From Fig. 6(a), it can be seen that the intensity of the S0 increases linearly with temperature. However, the intensity variation of the variables for water cluster, S1, S2 and S3, as exhibited in Fig. 6(b)-(d), displays a decreasing trend, i.e., the content of S1, S2 and S3 decreases with the increase of S0. The reason is that the temperature weakens the intermolecular hydrogen bonds between water molecules and leads to the disassociation of water clusters [12].

|
Download:
|
| Fig. 6. Intensity variation of the variables at 7074 (a), 6951 (b), 6827 (c) and 6700 (d) cm-1 with temperature. The solid lines were obtained by linear fitting. Piecewise fitting was used in (b) and (d) according to the variation of the data. | |
Fig. 6(a) and (c) shows that the intensity variation of the variables at 7074 and 6827 cm-1 change linearly with temperature. A straight line can be obtained by linear fitting of the points. The squared determination coefficients R2 are as high as 0.9991 and 0.9538, respectively. The reason may be that there is no significant interaction of the water structure S0 and S2 with the proteins. In Fig. 6(d), however, the intensity of the variable at 6700 cm-1 decreases with a clear inflection around 60 ℃. The result indicates that the content of water specie S3 becomes lower with the increase of temperature, but the changing slow down around 60 ℃. The temperature corresponds to the beginning temperature of the serum protein denaturation, at which the secondary structure begins to change. The temperature was also indicated in Fig. 5(a) and (b). An explanation of the inflection in Fig. 6(d) may be that the interaction between water and protein in native structure is different from that between water and unfolded protein. Therefore, water specie S3 may be a probe to demonstrate the structure change of human serum proteins.
The intensity variation of S1 with temperature, as shown in Fig. 6(b), displays two inflection points around 50 and 70 ℃, respectively, and the decrease becomes faster and faster. This may be another proof for the water as an indicator of the structural change for the proteins in solution. The phenomenon may be connected with the three-state transition of the serum proteins induced by temperature [38]. With the rise of temperature, the transition from the compact native state to an intermediate state occurs at near 50 ℃, and then the proteins are transformed to the unfolded state through the second transition at around 70 ℃ [39]. In aqueous solution, for the globular proteins, a large number of hydrophobic amino acid residues are embedded in the interior of the globular molecules without exposure to water, and hydrophilic ones mainly distribute on the surface. During the heat-induced unfolding of the proteins, more hydrophobic residues are exposed to water, and they change the amount of ordered solvent in the system.
3. ConclusionCWT was used to enhance the resolution of the NIR spectra and MC-UVE was adopted to select the variables associated with the proteins from the transformed spectra of human serum. Using the stability defined in MC-UVE method, the variables in the spectra measured at different temperature were evaluated, and the variables related to the serum proteins were determined. Not only the variables related to the α-helix and β-sheet structures are selected, the variables related to different water species are also selected. Furthermore, the beginning temperature of the denaturation was observed through the variation of the intensity of the selected variables with temperature, showing the transition from α-helix to β-sheet structure. More importantly, through the variation of the selected variables related to water species, the unfolding process of the proteins is revealed. Therefore, CWT and MC-UVE were proved to be efficient methods for the analysis of temperature-dependent NIR spectra of the real biological matrix, and water may be a probe for studying the structural variation of the proteins in aqueous solution.
4. Experimental 4.1. Sample preparation and spectral measurementA total of 77 human serum samples were supplied by the People's Hospital of Gaomi (Gaomi, China) and kept at constant temperature (-20 ℃) in the refrigerator. Serum samples melted at room temperature without further treatment were used in the spectral measurement. HSA (96-99% purity) was purchased from Sigma-Aldrich and used without further purification. The protein was dissolved in doubly distilled water to prepare aqueous HSA solutions. 14 samples with concentrations of 1.43-7.40 wt% were prepared.
NIR spectra were measured from 12, 000 to 4000 cm-1 at a 4 cm-1 resolution using a VERTEX 70 spectrometer (Bruker Optics Inc., Ettlingen, Germany) equipped with a tungsten-halogen light source and InGaAs detector. The spectra are digitalized with ca. 2 cm-1 interval in the Fourier transform. In the calculations, two regions of 8000-5440 cm-1 and 4920-4220 cm-1 containing the spectral information about the hydration and structure of proteins were used. The spectrum of empty cell, instead of pure water, was used as the background or reference, because the spectral information of water is used in the analysis. The background and the spectra were both measured with scan number 64. The contents of total protein (human serum proteins) in the serum samples were measured by an AU5800 automatic biochemical analyzer (Beckman Coulter, Inc., USA).
A quartz cuvette cell having a path length of 1.0 mm was inserted into a thermostated holder, the temperature of which was controlled by a temperature controller (Bruker Optics Inc., Ettlingen, Germany). The precision of the temperature control is ±0.1 ℃. Temperature-dependent spectra were collected from 30 ℃ to 80 ℃ with a step of 5 ℃, and an equilibration time of 30 min was used at each temperature. 80 ℃ is chosen as the highest temperature, because the transient temperature may be as high as 60 ℃ in the production process of protein pharmaceuticals [1].
4.2. Wavelet transform and MC-UVE methodCWT was used to enhance the resolution of the spectra. To obtain a high resolution, "Sym2" wavelet filter and the scale parameter 20 were used to acquire the effect of smoothing.
MC-UVE method was adopted for selecting the variables correlated significantly with the human serum proteins from the transformed spectra at each temperature. The method builds a large number of PLS sub-models with randomly selected calibration samples at first, and then each variable is evaluated with a statistical value, named as stability, of the corresponding coefficients in these models [28]. Representing the concentration and the spectra of the calibration samples by y and X, respectively, a PLS model can be described as

|
(1) |
where b is the coefficient vector of the model. When M sub-models are built in the calculation, a coefficient matrix B = [b1, b2, ... bM] can be obtained. Then the stability si for the ith variable can be calculated by
|
(2) |
where bi (i = 1... N, N is the number of the variables) is the coefficients for the ith variable in the M models. Therefore, the stability represents the reliability of each variable and the degree of correlation between variable and target analyte. Because the sign of the value is determined by that of the mean(bi), the absolute value of si was used in this study.
For selecting the informative variables related to the proteins in the spectra of human serum samples, MC-UVE was performed using the contents of human serum proteins as y and the transformed spectra of the serum samples as X. In the calculation, the datasets of the human serum samples were divided into two sets, i.e., the training set and assessing set. Training set was used for calculation of the stability and the assessing set was used for determination of the selected variables. Prediction set was not used in this work because prediction testing of the quantitative model is not necessary. Therefore, there were 39 samples in training set and 38 samples in assessing set. The concentration of the samples in training set covers that of the assessing set. Furthermore, in the calculation of the stability, 60% of the samples in the training set were randomly sampled to building the model and the rest were used for validation. 500 models (i.e., M=500) were built for calculating the stability. Then, RMSEP of the assessing set obtained by different number of the variables with highest stability was examined. The number that produces the lowest RMSEP was determined as the optimal number of the informative variables.
In order to investigate the rationality of the selected variables, the stability of the spectral variables calculated by MC-UVE with the dataset of the 14 prepared HSA samples was compared. The exactly same process as above was used in the calculation.
AcknowledgmentThis work is supported by National Natural Science Foundation of China (No. 21475068).
| [1] | P. Kistler, H. Nitschmann. Large scale production of human plasma fractions. Vox Sang. 7 (1962) 414–424. DOI:10.1111/vox.1962.7.issue-4 |
| [2] | T. Burnouf. Modern plasma fractionation. Transfus. Med. Rev. 21 (2007) 101–117. DOI:10.1016/j.tmrv.2006.11.001 |
| [3] | J.J. Hill, E.Y. Shalaev, G. Zografi. Thermodynamic and dynamic factors involved in the stability of native protein structure in amorphous solids in relation to levels of hydration. J. Pharm. Sci. 94 (2005) 1636–1667. DOI:10.1002/jps.20333 |
| [4] | S. Pieters, T. De Beer, J.C. Kasper, et al., Near-infrared spectroscopy for in-line monitoring of protein unfolding and its interactions with lyoprotectants during freeze-drying. Anal. Chem. 84 (2012) 947–955. DOI:10.1021/ac2022184 |
| [5] | D.A. Chalton, J.H. Lakey. Simple detection of protein soft structure changes. Anal. Chem. 82 (2010) 3073–3076. DOI:10.1021/ac902932c |
| [6] | R. Lu, W.W. Li, A. Katzir, et al., Probing the secondary structure of bovine serum albumin during heat-induced denaturation using mid-infrared fiberoptic sensors. Analyst 140 (2015) 765–770. DOI:10.1039/C4AN01495B |
| [7] | S. Navea, A. de Juan, R. Tauler. Modeling temperature-dependent protein structural transitions by combined near-IR and mid-IR spectroscopies and multivariate curve resolution. Anal. Chem. 75 (2003) 5592–5601. DOI:10.1021/ac0343883 |
| [8] | Y.Q. Wu, B. Czarnik-Matusewicz, K. Murayama, Y. Ozaki. Two-dimensional near-infrared spectroscopy study of human serum albumin in aqueous solutions: using overtones and combination modes to monitor temperature-dependent changes in the secondary structure. J. Phys. Chem. B 104 (2000) 5840–5847. DOI:10.1021/jp000537z |
| [9] | K. Murayama, Y. Ozaki. Two-dimensional near-IR correlation spectroscopy study of molten globule-like state of ovalbumin in acidic pH region: simultaneous changes in hydration and secondary structure. Biopolymers 67 (2002) 394–405. DOI:10.1002/(ISSN)1097-0282 |
| [10] | B. Yuan, K. Murayama, Y.Q. Wu, et al., Temperature-dependent near-infrared spectra of bovine serum albumin in aqueous solutions: spectral analysis by principal component analysis and evolving factor analysis. Appl. Spectrosc. 57 (2003) 1223–1229. DOI:10.1366/000370203769699072 |
| [11] | R. Tsenkova. Aquaphotomics: water absorbance pattern as a biological marker for disease diagnosis and disease understanding. J. Near Infrared Spectrosc. 18 (2007) 14–16. |
| [12] | H. Maeda, Y. Ozaki, M. Tanaka, N. Hayashi, T. Kojima. Near infrared spectroscopy and chemometrics studies of temperature-dependent spectral variations of water: relationship between spectral changes and hydrogen bonds. J. Near Infrared Spectrosc. 3 (1995) 191–201. DOI:10.1255/jnirs.69 |
| [13] | V.H. Segtnan, T. Isaksson, Y. Ozaki. Studies on the structure of water using two-dimensional near-infrared correlation spectroscopy and principal component analysis. Anal. Chem. 73 (2001) 3153–3161. DOI:10.1021/ac010102n |
| [14] | Y. Wang, K. Murayama, Y. Myojo, et al., Two-dimensional Fourier transform near-infrared spectroscopy study of heat denaturation of ovalbumin in aqueous solutions. J. Phys. Chem. B 102 (1998) 6655–6662. DOI:10.1021/jp9816115 |
| [15] | Y.N. Ni, W. Lin. Near-infrared spectra combined with partial least squares for pH determination of toothpaste of different brands. Chin. Chem. Lett. 22 (2011) 1473–1476. DOI:10.1016/j.cclet.2011.07.010 |
| [16] | M.L. Fan, X.W. Liu, X.M. Yu, et al., Near-infrared spectroscopy and chemometric modelling for rapid diagnosis of kidney disease. Sci. China Chem. 60 (2016) 299–304. |
| [17] | X.X. Ma, C.C. Wang, W.S. Cai, X.G. Shao. Quantification of albumin in urine using preconcentration and near-infrared diffuse reflectance spectroscopy. Chin. Chem. Lett. 27 (2016) 1597–1601. DOI:10.1016/j.cclet.2016.03.008 |
| [18] | X.G. Shao, A.K.M. Leung, F.T. Chau. Wavelet: a new trend in chemistry. Acc. Chem. Res. 36 (2003) 276–283. DOI:10.1021/ar990163w |
| [19] | Y.N. Ni, R.M. Song, S. Kokot. Discrimination of Radix Isatidis and Rhizoma et Radix Baphicacanthis Cusia samples by near infrared spectroscopy with the aid of chemometrics. Spectrochim. Acta A 96 (2012) 252–258. DOI:10.1016/j.saa.2012.05.031 |
| [20] | K.M. Leung, F.T. Chau, J.B. Gao. Wavelet transform: a method for derivative calculation in analytical chemistry. Anal. Chem. 70 (1998) 5222–5229. DOI:10.1021/ac9803737 |
| [21] | X.G. Shao, C.Y. Pang, Q.D. Su. A novel method to calculate the approximate derivative photoacoustic spectrum using continuous wavelet transform. Fresenius J. Anal. Chem. 367 (2000) 525–529. DOI:10.1007/s002160000404 |
| [22] | R. Leardi, L. Nørgaard. Sequential application of backward interval partial least squares and genetic algorithms for the selection of relevant spectral regions. J. Chemom. 18 (2004) 486–497. DOI:10.1002/(ISSN)1099-128X |
| [23] | R.F. Kokaly, R.N. Clark. Spectroscopic determination of leaf biochemistry using band-depth analysis of absorption features and stepwise multiple linear regression. Remote Sens. Environ. 67 (1999) 267–287. DOI:10.1016/S0034-4257(98)00084-4 |
| [24] | R. Leardi, A. Lupiáñez González. Genetic algorithms applied to feature selection in PLS regression: how and when to use them. Chemom. Intell. Lab. 41 (1998) 195–207. DOI:10.1016/S0169-7439(98)00051-3 |
| [25] | T. Pan, Y. Han, J. Chen, Mei, L.J. Yao, J. Xie. Optimal partner wavelength combination method with application to near-infrared spectroscopic analysis. Chemom. Intell. Lab. 156 (2016) 217–223. DOI:10.1016/j.chemolab.2016.05.022 |
| [26] | H.D. Li, Y.Z. Liang, Q.S. Xu, D.S. Cao. Key wavelengths screening using competitive adaptive reweighted sampling method for multivariate calibration. Anal. Chim. Acta 648 (2009) 77–84. DOI:10.1016/j.aca.2009.06.046 |
| [27] | V. Centner, D.-L. Massart, O.E. de Noord, et al., Elimination of uninformative variables for multivariate calibration. Anal. Chem. 68 (1996) 3851–3858. DOI:10.1021/ac960321m |
| [28] | W.S. Cai, Y.K. Li, X.G. Shao. A variable selection method based on uninformative variable elimination for multivariate calibration of near-infrared spectra. Chemom. Intell. Lab. 90 (2008) 188–194. DOI:10.1016/j.chemolab.2007.10.001 |
| [29] | Q.J. Han, H.L. Wu, C.B. Cai, L. Xu, R.Q. Yu. An ensemble of Monte Carlo uninformative variable elimination for wavelength selection. Anal. Chim. Acta 612 (2008) 121–125. DOI:10.1016/j.aca.2008.02.032 |
| [30] | M.A. Czarnecki. Frequency shift or intensity shift? The origin of spectral changes in vibrational spectra. Vib. Spectrosc. 58 (2012) 193–198. DOI:10.1016/j.vibspec.2011.11.012 |
| [31] | J. Wang, M.G. Sowa, M.K. Ahmed, H.H. Mantsch. Photoacoustic near-infrared investigation of homo-polypeptides. J. Phys. Chem. 98 (1994) 4748–4755. DOI:10.1021/j100068a043 |
| [32] | P. Robert, M.F. Devaux, N. Mouhous, E. Dufour. Monitoring the secondary structure of proteins by near-infrared spectroscopy. Appl. Spectrosc. 53 (1999) 226–232. DOI:10.1366/0003702991946361 |
| [33] | K.I. Izutsu, Y. Fujimaki, A. Kuwabara, et al., Near-infrared analysis of protein secondary structure in aqueous solutions and freeze-dried solids. J. Pharm. Sci. 95 (2006) 781–789. DOI:10.1002/jps.20580 |
| [34] | F.O. Libnau, O.M. Kvalheim, A.A. Christy, J. Toft. Spectra of water in the nearand mid-infrared region. Vib. Spectrosc. 7 (1994) 243–254. DOI:10.1016/0924-2031(94)85014-3 |
| [35] | M. Miyazawa, M. Sonoyama. Second derivative near infrared studies on the structural characterisation of proteins. J. Near Infrared Spectrosc. 6 (1998) 253–257. DOI:10.1255/jnirs.204 |
| [36] | S.L. Wang, S.Y. Lin, M.J. Li, Y.S. Wei, T.F. Hsieh. Temperature effect on the structural stability similarity, and reversibility of human serum albumin in different states. Biophys. Chem. 114 (2005) 205–212. DOI:10.1016/j.bpc.2004.12.004 |
| [37] | A.W.P. Vermeer, W. Norde. The thermal stability of immunoglobulin: unfolding and aggregation of a multi-domain protein. Biophys. J. 78 (2000) 394–404. DOI:10.1016/S0006-3495(00)76602-1 |
| [38] | M. L. Fan, W. S. Cai, X. G. Shao, Investigating the structural change in protein aqueous solution using temperature-dependent near-infrared spectroscopy and continuous wavelet transform, Appl. Spectrosc. (2017), doi:http://dx.doi.org/10.1177/0003702816664103 in press. |
| [39] | G.F. Zhu, S.Y. Ren, L. Xi, L.F. Du, X.F. Zhu. Temperature induced structural transitions from native to unfolded aggregated states of tobacco etch virus protease. J. Mol. Struct. 1082 (2014) 80–90. |