 2017, Vol. 28


b Analytical Chemistry Division, Bhabha Atomic Research Center, Trombay, Mumbai 400 085, India
Graphene, a monolayer of sp2-hybridized carbon atoms packed into honeycomb like crystal structure [1], has attracted many researchers in the field of science and technology [2-4] because of its extraordinary properties viz., low cost, high surface to volume ratio [5], excellent electrical conductivity, electron mobility and flexibility. Thus, graphene provides an ideal platform to prepare electrochemical sensors and biosensors [6, 7]. It is desirable to synthesize the pure and predefined structure of graphene to explore the charge or electron transfer properties for electroanalysis [8], electronic devices [9], etc. Various methods have been reported for the preparation of graphene including electrochemical, hydrothermal, chemical and chemical vapor deposition [10-13]. Apart from these reduction methods, the electrochemical reduction technique is being widely used for the fabrication of electrochemical sensors due to its green nature [14, 15].
Metal/metal oxide nanoparticles have been attracting tremendous attention in the field of electrochemistry due to their unique optical, electronic, magnetic and electro-catalytic properties [16-19]. Large surface area and electro-catalytic properties of nanoparticles made them as ideal functional materials for the fabrication of electrochemical sensors for electroanalysis. In particular, bismuth or bismuth oxide nanomaterial has interesting electronic properties such as lower energy band gap, lower effective mass, lower carrier density, higher carrier mobility and long mean free path [20]. The interesting electro-catalytic properties of bismuth nanoparticles (Bi NPs)/bismuth oxide nanoparticles find considerable applications in the fabrication of electrochemical sensors and biosensors [21, 22]. Biocompatibility, low toxicity and promising electrochemical ability make them as alternative feasible electrode materials for mercury electrodes [23-25]. Bi NPs or bismuth oxide NPs alone are not stable for the preparation of an electrochemical sensor; it requires a suitable material to deliver its charge/electron transfer properties [26].
Recently, graphene nanocomposites (usually with metal/metal oxide nanomaterials) are being widely used as electrode materials for sensing applications due to their good solution-processibility and ease of post-functionalization [27]. Many research groups have prepared composites of graphene oxide (GO) with various materials to achieve the desired properties [27-29]. The efforts were mainly made on the effective dispersibility of composites [30], improvement in the electrical conductivity [31], thermal stability and mechanical strength of composite [32]. The charge transfer/electronic properties of graphene can be easily modified by metal nanoparticles and the resulting nanocomposites exhibit exceptional stability and synergy for sensing applications [33, 29].
Literature survey revealed the application of graphene/bismuth nanocomposite modified electrodes for the determination of trace heavy metals [34-39]. In the present study, we have explored the electrochemical reduction of GO-Bi(NO3)3 composite film for sensing application of an anticancer drug, GMB. The present study demonstrates the fabrication and characterization of a novel nanocomposite film, electrochemically reduced graphene oxidebismuth nanoparticles composite (Er-GOBi) for sensing application of GMB. The preparation of electrosensing interface, Er-GOBi involved a green electrochemical reduction of GO-Bi(NO3)3 at GCE.
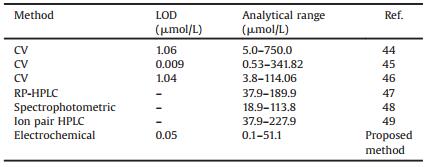
Gemcitabine (2', 2'-difluorodeoxycytidine) is a pyrimidine analog that is proven to be active against a variety of solid tumors. It plays a major role in the treatment of pancreas, lung, breast, bladder, kidney cancer, and non-small cell lung and pancreatic cancer [40-43]. Due to its lipophilic property, it is easily transported into the cell by nucleoside membrane transporters where it is phosphorylated and then competes with cytidine derivatives in DNA synthesis. Higher concentration of GMB triphosphate inhibits cytidine triphosphate (CTP) synthesis and cytidine monophosphate (CMP) deaminase, which maintains CTP at lower concentrations and assures greater availability of GMB triphosphate. Biological activity of GMB involves two mechanisms. First step corresponds to the incorporation of GMB into DNA triggering the mechanism of DNA repairing and in the second step blocking of DNA synthesis through the inhibition of ribonucleotide reductase occurs impeding the synthesis of a new strand [44]. Various analytical methods have been reported for the determination of GMB including voltammetric [45-47], HPLC [48], spectrophotometric [49] and RP-HPLC [50] methods. However, the reported chromatographic methods require long time and involve time consuming extraction and purification. However, the reported voltammetric methods are less sensitive and wider linearity range (Table 1). So, it was thought worthwhile to develop a sensitive electrochemical method for the determination of GMB. In the present study, we have fabricated a sensitive and user friendly electrochemical sensor, Er-GOBi/GCE for the determination of GMB in pharmaceutical formulations and spiked urine samples.
|
|
Table 1 Comparison of detection limit and analytical range of the proposed method with those of reported methods. |
2. Results and discussion 2.1. Characterization of electrode materials
The sensing nanocomposite interface, Er-GOBi was electrochemically characterized by recording cyclic voltammograms of GOBiN film at GCE in phosphate buffer of pH 6 and corresponding voltammograms are shown in Supporting information (Fig. S1). GOBiN film exhibited two anodic peaks and three cathodic peaks in phosphate buffer of pH 6 (Fig. S1 in Supporting information). In the first cycle reduction peak (peak c3) of oxygen was observed to be merged with the reduction peak of oxygen functionalities of graphene oxide (at -1.430V, designated as peak c1). In the subsequent cycles, peak c1 disappeared, indicating the reduction of oxygen functionalities of GOBiN composite. Appearance of the peak c2 at -0.580 V was attributed to the reduction of Bi3+ to atomic Bi and the peak c3 at -0.8 V was assigned to the reduction of dissolved oxygen in the solution.This would disappear if nitrogen gas was purged into the solution. Further, two anodic waves noticed in 1st cycle at -0.121 and 0.047 V were designated as peak a1 and peak a2 respectively, suggesting the anodic conversion of Bi0/Bi+ and Bi+/ Bi3+ respectively [52, 53].
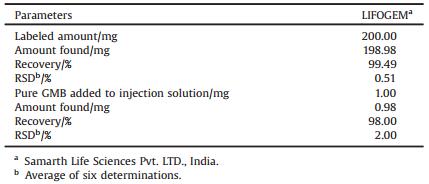
Surface micrographs and elemental composition of GO, GO-BiN and Er-GOBi were investigated by FESEM and EDAX measurements. The corresponding results of analysis are shown in Fig. 1. Flake like morphology was observed in GO (Fig. 1A). Upon electrochemical reduction of GOBiN, the nanocomposite displayed aggregated flakes with atomic Bi nanoparticles and various edges on its surface (Fig. 1B). The atomic Bi NPs have increased the surface area and exhibited the electrocatalytic activity. Further, the edges noticed at the electrosensing filament (Er-GOBi) seem to be responsible for electron or charge transfer capability. Results of this study revealed that the interface, Er-GOBi was good for fabrication of an electrochemical sensor. Upon electrochemical reduction of GOBiN, the elemental composition was noticed to be 72.94%, 2.59% and 24.47% (by weight) for C, O and Bi, respectively (Fig. 1D). In addition, the weight % of oxygen was found to be decreased from 11.08% to 2.59% upon electrochemical reduction of GOBiN indicating the successful reduction of oxygen functionalities of the GO composite.

|
Download:
|
| Fig. 1. SEM images and EDAX images of graphene oxide (A and C) and Er-GOBi (B and D). | |
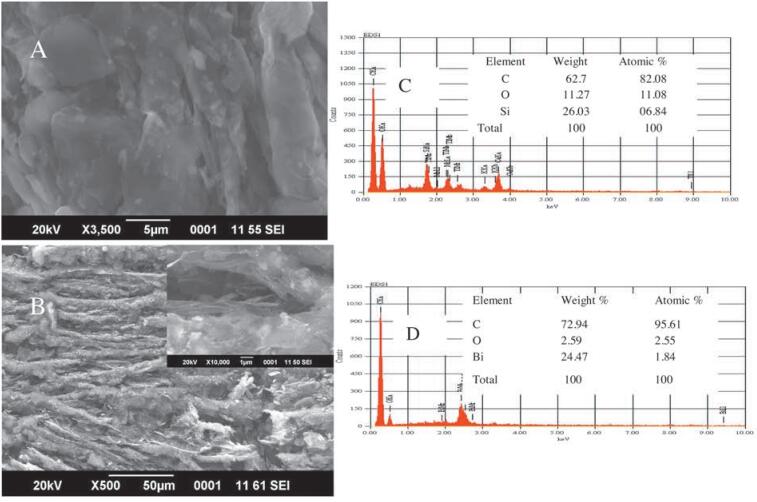
Surface topography of GOBiN (before and after reduction) was investigated by atomic force microscopic measurements. The corresponding AFM images include surface roughness (average of 3 measurements) and average thickness of the GO and ErGOBi. Width of GO flakes was observed to be ~27.1 nm (Fig. 2A). Upon electrochemical reduction of GOBiN, the average width was increased to ~71.1 nm (Fig. 2B). Increased width (~45 nm) was attributed to the presence of atomic bismuth nanoparticles at the edges of GO flakes. Surface roughness of ErGOBi was found to be higher (18.46 pm2) compared to that of GO (12.8 pm2). The observed average particle size of bismuth nanoparticles on reduced graphene oxide (rGO) was in good agreement with that of reported earlier (20-80 nm) [54].

|
Download:
|
| Fig. 2. Atomic force micrographs and corresponding depth graphs of GO (A and C) and Er-GOBi (B and D). | |
FTIR spectra were recorded to know the possible functional groups in GO and Er-GOBi and the corresponding spectra are shown in Fig. S2. GO exhibited vibrational bands at 3403 cm-1, 1724 cm-1 and 1054 cm-1 due to the presence of oxygen functionalities, OH, C=O and C-O-C respectively (Fig. S2). Upon electrochemical reduction of GOBiN composite, the vibrational bands due to C=O and C-O-C almost disappeared suggesting that most of the oxygen functional groups were reduced.
2.2. Electrochemical characterization of stepwise modification of ErGOBi/GCEStepwise modification of Er-GOBi/GCE was characterized by performing cyclic voltammetric and electrochemical impedance spectroscopic measurements of potassium ferricyanide. Cyclic voltammograms of 1 mmol/L potassium ferricyanide were recorded in 1 mol/L KCl at bare and modified GCEs and the corresponding voltammograms are shown in Fig. 3A. Enhanced electrochemical redox response of the probe was observed at ErGOBi/GCE (Ip = 86.12 μA and ΔEp = 52 mV; Fig. 3Ae) when compared to that at bare GCE (Ip = 18.51 μA and ΔEp = 68 mV; Fig. 3Aa), GO/GCE (Ip = 21.04 μA and ΔEp = 70 mV; Fig. 3Ab), GOBiN/GCE (Ip = 32.67mA and ΔEp = 72 mV; Fig. 3Ac) and ErGO/GCE (Ip = 73.01 μA and ΔEp = 60 mV, Fig. 3A line d). Results of this study revealed that the interface, Er-GOBi successfully electrocatalysed the redox response of the probe compared to that noticed at other modified GCEs (GO/GCE, GOBiN/GCE and ErGO/GCE) and bare GCE. This might be due to the presence of wrapped Bi NPs on graphene network. The electroactive surface areas of bare GCE, GO/GCE, GOBiN/GCE, ErGO/GCE and Er-GOBi/GCE were obtained using K4[Fe(CN)6] as a redox probe using the Randles-Sevčik equation 9 shown below [55].

|
Download:
|
| Fig. 3. Cyclic voltammograms (A) and Impedance spectra (B) of 1 mmol/L [Fe(CN)6]3-/4- at bare GCE (a), GO/GCE (b), GOBiN/GCE (c), Er-GO/GCE (d) and Er-GOBi/GCE (e) in 1 mol/L KCl. | |
Ip = (2.69 × 10⁵) n3/2 ACD1/2υ1/2
where Ip is the peak current, n is the number of electrons transferred, A is the surface area of the electrode, υ is the diffusion coefficient, υ is the scan rate and C is the concentration of the probe. The electroactive surface areas of the electrodes were evaluated to be 0.057, 0.135, 0.153, 0.182 and 0.241 cm2 for bare GCE, GO/GCE, GOBiN/GCE, ErGO/GCE and Er-GOBi/GCE, respectively. Thus, larger surface area of Er-GOBi/GCE facilitated the electron transfer rate.
It is well known that the electrical current of an electrochemical process is proportional to the surface area of the electrode. The presence of surface rugosities due to steps, holes, kinks, roughness and edges can result in an electrode real surface area that is larger than the geometric surface area. The electrode surface area can be evaluated by cyclic voltammetric technique using the standard probe, K4[Fe(CN)6]. This calculation is possible because every adsorbed molecule is attached to the electrode surface. By using Randles-Sevčik equation, it is possible to calculate the electrode 9 surface area [56].
The electrochemical impedance spectroscopic (EIS) measurements of modified GCEs were carried out with potassium ferricyanide as an electrochemical redox probe. EIS can give information on the impedance changes of the electrode surface in the modification process. In EIS, the semicircle diameter equals to the electron/charge transfer resistance, Rct. This resistance controls the electron or charge transfer kinetics of the redox-probe at the electrode interface. Fig. 3B represents the Nyquist plots for bare GCE (a), GO/GCE (b), GOBiN/GCE (c), ErGO/GCE (d) and Er-GOBi/ GCE (e) in 1 mol/L KCl. For bare GCE, Nyquist plot was the combination of semicircle and a straight line that corresponds to diffusion limited electrode process. GCE, GO/GCE, GOBiN/GCE, ErGO/GCE and Er-GOBi/GCE showed Rct of 26.16, 20.12, 23.99, 18.34 and 0.016 KV respectively. The lower Rct value indicated the lesser impedance for the transfer of electron or charge through the electrode interface and hence, accelerated diffusion of ferricyanide towards the modified electrode surface. The lowest Rct value at ErGOBi/GCE indicated that the formed Bi nanoparticles reduced the impedance for the flow of electrons/charge through the electrode interface.
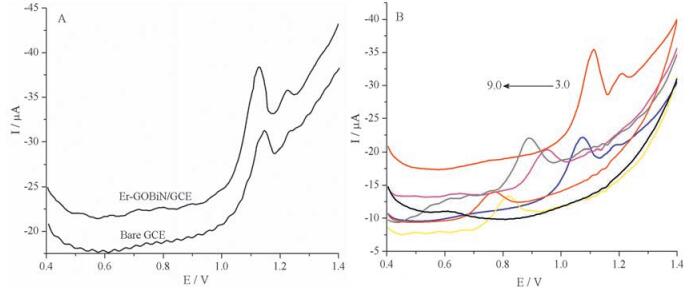
2.3. Electrochemistry of GMB at Er-GOBi/GCE`Our research group has reported the electrochemical behavior of GMB at bare GCE and carbon paste electrode (in the presence of sodium dodecyl sulphate) [46, 47]. In the present study, differential pulse voltammetric method was used since GMB exhibited a well defined irreversible oxidation peak (cyclic voltammograms of GMB at bare and Er-GOBi/GCE are shown in Supporting information. Fig. S3). Differential pulse voltammograms of 10 μmol/L GMB at bare and Er-GOBi/GCE in phosphate buffer of pH 3 are shown in Fig. 4A. GMB exhibited an oxidation wave at bare and Er-GOBi/GCE in the potential range of 0.4-1.4 V. The oxidation peak current of GMB was found to be enhanced by ~100 fold at Er-GOBi/GCE (Ip = 57.8 μA) compared to that at bare GCE (Ip = 0.573 μA). The increased oxidation response at the proposed electrochemical sensor was attributed to increased surface area and the presence of electrochemically active BiN NPs on its surface. This increased the pre concentration of GMB on Er-GOBi/GCE.

|
Download:
|
| Fig. 4. (A) Differential pulse voltammograms of 10 μmol/L GMB at bare and Er-GOBi/GCE in phosphate buffer of pH 3. (B) Differential pulse voltammograms of 10 μmol/L GMB at Er-GOBi/GCE in phosphate buffer of different pH (3.0–9.0). | |
Effect of pH of the supporting electrolyte on electrochemical oxidation of GMB was investigated. For this, differential pulse voltammograms of 10 μmol/L GMB were recorded in phosphate buffer in the pH range of 3.0-9.0 (Fig. 4B). With increase in pH of the supporting electrolyte (from 3.0 to 9.0), the oxidation peak potential was shifted to negative values indicating the involvement of protons in the electrode process. This also suggested that the electrode reaction was more favorable at pH 3. The values of Epa were plotted against pH and the corresponding regression equation is shown below:
Ep(V) =-0.064 pH + 1.280, R2 = 0.988
The slope value of 64 mV/pH is close to the theoretical value of 59 mV/pH expected for the involvement of equal number of electrons and protons in the electrode reaction [57]. Since, a well defined oxidation peak was observed in phosphate buffer of pH 3, we have selected this buffer for further studies.
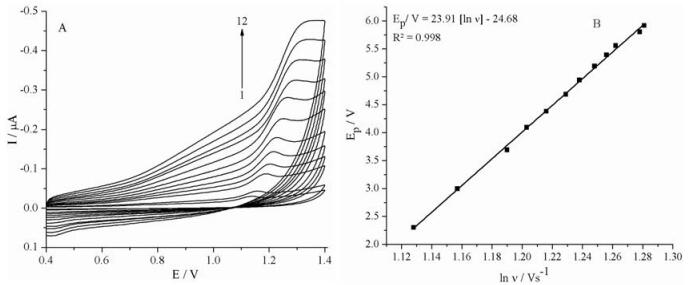
Effect of scan rate (υ) on the oxidation of 10 μmol/L GMB at ErGOBi/GCE was examined in phosphate buffer of pH 3 in the scan rate range of 10-340 mV/s (Fig. 5A). The peak current of GMB was found to be linearly dependent on the scan rate and the corresponding regression equation is Ip (μA) = 4 ×10⁻⁶ -2 ×10⁵ (υ) with R2 = 0.987. This indicated that the electrode process was adsorption controlled. Further, the plot of log Ip vs. log υ yielded the slope value of 0.968. The corresponding equation is as follows:

|
Download:
|
| Fig. 5. Cyclic voltammograms of 10 μmol/L GMB at different scan rates (1→12: 10, 20, 40, 60, 80, 100, 140, 180, 220 260, 300 and 340 mV/s) on Er-GOBi/GCE in phosphate buffer of pH 3 (A) and Plot of Ep vs. ln υ (B). | |
log Ip = 0.968 logυ -5.628; R2 = 0.992.
This confirmed the adsorption controlled electrode process. On increasing the scan rate, the peak potential of anodic peak was shifted to more positive values confirming the irreversibility of GMB at Er-GOBi/GCE. Electrochemical kinetic parameters, electron transfer rate constant (ks) and number of electrons involved were calculated using the Laviron equation shown below [58, 59]:
Epa = E°′ -2.303 RT/αnF logυ + 2.303 RT/αnF log RTks/αnF
where E°′ is the formal potential, n is the number of electrons transferred, α is the electron transfer coefficient and ks is the standard rate constant of the electrode reaction. From the slope of Ep versus ln υ plot (Fig. 5B), the value of αn was found to be 0.61. Generally, α is assumed to be 0.5 in a totally irreversible electrode process. The number of electrons transferred and electron transfer rate constant (ks) for oxidation of GMB was evaluated to be 1 and 1.02 s-1 respectively.
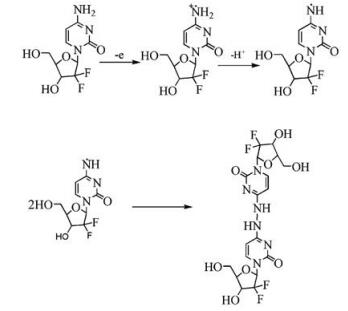
2.4. Electrochemical mechanismBased on above results, the probable mechanism for electrooxidation of GMB was proposed. It follows the electrochemical and chemical (EC) electrode process and the same is shown in Scheme 1. GMB underwent a single electron oxidation and lost a proton with the generation of a radial, [GMB]·. Two GMB radicals chemically combined and formed a stable dimerized product. The proposed electrochemical oxidation mechanism is in good agreement with the earlier mechanism suggested for electrooxidation of GMB [38].

|
Download:
|
| Scheme 1. Probable mechanism of oxidation of GMB. | |
2.5. Optimization of sensing response
Influence of the amount of modifier on oxidation of GMB at ErGOBi/GCE was investigated. For this, the suspension (GOBiN) amount was varied from 1 to 8 μL and the oxidation response of GMB was monitored. The oxidation response was noticed to be increased with increase in the amount of GOBiN suspension. Further, when the amount exceeded 6 μL, the oxidation peak current decreased slightly. With the suspension amount of 1 μL to 6 μL, the adsorption of GMB on the modified electrode was enhanced. Therefore, increased oxidation peak current was observed. However, by increasing the amount of suspension (beyond 6 μL), the thickness of the modifier increased and in turn increased the impedance of the interface for the flow of electrons or charge. Hence, 6 μL GOBiN suspension was used to fabricate the proposed electrochemical sensor.
Accumulation time played an important role in the enhancement of the electro-oxidation of GMB. So, it is important to fix the accumulation time for effective performance of Er-GOBi/GCE towards the sensing of GMB. For this, voltammograms of 10 μmol/L GMB at Er-GOBi/GCE were recorded at different accumulation times (30-240 s). The peak current increased with increase in accumulation time till 180 s. Beyond 180 s, the peak current decreased. So, an accumulation time of 180 s was set for better sensing application.
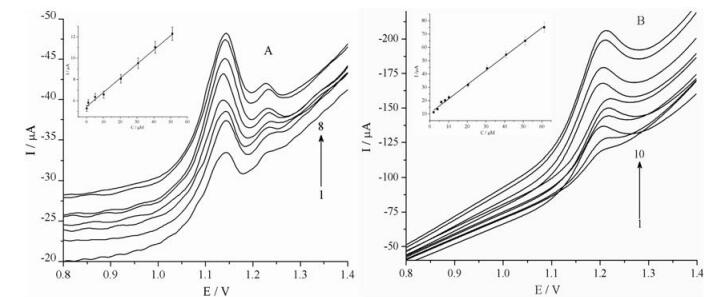
2.6. Analytical applicationsUnder optimized parameters, differential pulse voltammetry (DPV) and linear sweep voltammetry (LSV) were used to develop alternative analytical methods for the determination of GMB. For this, differential pulse and linear sweep voltammograms were recorded for increasing concentrations of GMB at Er-GOBi/GCE. The oxidation peak current was observed to be increased linearly with the concentration of GMB in the range of 0.1-51.1 μmol/L and 2.1-61.1 μmol/L for DPV and LSV methods, respectively (Fig. 6A & B). The corresponding regression equations are shown below:

|
Download:
|
| Fig. 6. Differential pulse voltammograms (A) and linear sweep voltammograms (B) for increasing concentrations of GMB in phosphate buffer of pH 3. | |
Ip(μA) = 5.454 ×10⁻⁶ [GMB] + 0.133, R2 = 0.992 (for DPV)
Ip(μA) = 1.068 × 10⁻⁷ [GMB] + 0.158, R2 = 0.995 (for LSV)
Among these two methods, DPV method was observed to be more sensitive compared to LSV method as evident from their low detection limits (Table 2). Reproducibility of results of proposed analytical methods was checked by evaluating % relative standard deviation for inter-day and intra-day assay of GMB. The corresponding results are tabulated in Table 2. Low values of RSD highlighted the reproducibility of the proposed methods.
|
|
Table 2 Characteristics of the calibration plot for GMB. |

2.7. Analysis of GMB in injection sample
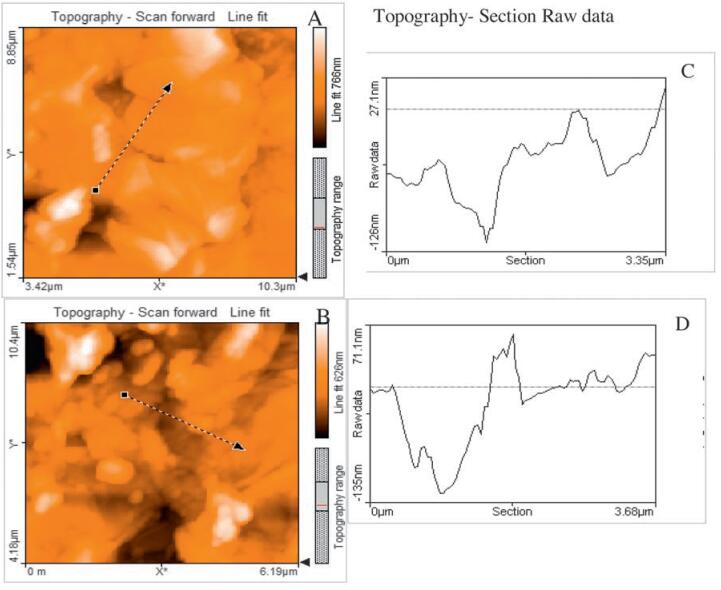
Applicability of the sensitive DPV method was examined by determining GMB in injections (LIFOGEM). The corresponding results of analysis are shown in Table 3. The low RSD value indicated the reproducibility of results. Accuracy of the proposed method was checked by performing the recovery test by the standard addition method. For this, known quantities of pure GMB were mixed with definite amounts of pre-analyzed formulations, then the mixtures were analyzed as before. The total amount of the drug was then determined, and the amount of drug added was calculated by the difference. The higher recovery value indicated that the commonly encountered excipients in the formulation did not interfere with the proposed method.
|
|
Table 3 Results of analysis of GMB in injection sample. |
2.8. Determination of GMB in spiked human urine samples
Application of the proposed method was further established by determining GMB in spiked urine samples without any pretreatment. The recovery studies were carried out by spiking drug free urine with known amounts of GMB. Differential pulse voltammograms of these samples were then recorded. The amounts of GMB in spiked urine samples were then evaluated from the calibration graph. The results of analysis are listed in Table 4. The average recovery values >97.00%, and RSD values less than 3.00%, revealed the accuracy and precision of the proposed DPV method.
|
|
Table 4 Results of analysis of GMB in spiked human urine samples (n = 5). |

2.9. Interference and stability
The selectivity of the proposed method was investigated by studying the effects of interferents such as glucose, cellulose, starch, ascorbic acid and uric acid on electrochemical determination of GMB. For this, we have recorded differential pulse voltammograms of 10 μmol/L GMB in the presence of different concentrations of interferent. The results of analysis are recorded in Table 5. It was noticed that 13-fold of glucose and starch, 6.5-fold of cellulose, 26.1-fold of ascorbic acid and 2.6-fold of uric acid did not interfere in the determination of 10 μmol/L GMB (Table 5). These results demonstrated that the Er-GOBi/GCE is selective for the assay of GMB.
|
|
Table 5 Tolerance of interferences on the determination of 10 mmol/L GMB. |

Stability of the Er-GOBi/GCE kept in air at room temperature was explored by monitoring the peak current of GMB. No significant decrease in the peak current was observed in the determination of 10 μmol/L GMB on successive four days. Further, 95% response was observed after four weeks. This indicated the stability of Er-GOBi/GCE for analytical applications.
3. ConclusionIn this work, Er-GOBi nanocomposite was prepared and utilized as an electrochemical sensing interface for GMB. The results indicated that the Er-GOBi nanocomposite provided a favorable environment for electrochemical reaction of GMB and hence, resulted in the enhanced voltammetric response. This sensing system for GMB was found to be convenient and showed excellent analytical characteristics such as lower detection limit, higher sensitivity and good reproducibility. The proposed sensitive differential pulse voltammetric method provided a simple approach for the determination of GMB in pharmaceutical formulations and spiked human urine samples.
4. Experimental 4.1. MaterialsBismuth(Ⅲ) nitrate pentahydrate (analytical grade) and graphite powder was purchased from Sigma Aldrich, USA. Pure sample of GMB was obtained as a gift sample from Reddy's Laboratories Pvt., Ltd., India. A stock solution of 1 mmol/L GMB was prepared in Millipore water and stored in a refrigerator at 4 ℃. Working solutions of GMB were prepared by appropriately diluting the stock solution with the selected supporting electrolyte. Phosphate buffer solutions (pH 3.0-9.0) were used as supporting electrolytes.
4.2. InstrumentationElectrochemical measurements were recorded at 25 ℃ on a CHI-1103A Electrochemical Analyzer (CH Instruments, Inc., USA) consisting of modified GCE as the working electrode, a platinum wire as the counter electrode and an Ag/AgCl (3.5 mol/L KCl) as the reference electrode. The following experimental conditions were maintained: for differential pulse voltammetry (DPV) -pulse amplitude 50 mV; pulse width 50 ms and scan rate 20 mV/s and linear seep voltammetry -sample interval 0.001 V; quiet time 2 s and scan rate 100 mV/s.
Atomic Force Microscopy (AFM) experiments were carried out on a flex AFM system, Nanosurf, Switzerlands. FTIR spectra were recorded on a NICOLET 6700 instrument, NICOLET, USA. Well dispersed graphene samples were drop casted on a pristine mica sheet and dried under IR lamp for AFM measurements. Scanning electron microscope (SEM) and Energy-dispersive X-ray spectral (EDAX) studies were performed on a Carl Zeiss, Ultra 55. Electrochemical impedance spectroscopic results were recorded on a potentiostat/galvanostat Autolab 100 with FRA software.
4.3. Preparation of the proposed electrochemical sensor, Er-GOBi/GCEFabrication of Er-GOBi modified GCE is shown in Scheme 2. Graphite oxide was synthesized using graphite powder by the Hummers method and then dried in an oven at 120 ℃ [51]. Obtained graphite oxide (2 mg) was dispersed in 2 mL Millipore water and sonicated in an ultrasonic bath for 2 h to obtain a stable suspension of graphene oxide (GO). 1 mL Bi(NO3)3·5H2O (mg/mL) solution was added to 1 mL GO (mg/mL) suspension and the composite suspension was sonicated for 4-5 h to achieve homogenized composite, GO-bismuth nitrate (GOBiN) suspension. Further, the proposed sensor, Er-GOBi/GCE was prepared by following the two step protocol: (ⅰ) surface of the glassy carbon electrode (GCE) was polished with 0.05 μm alumina powder using polishing kit and electrode surface was rinsed with Millipore water. The composite suspension of GOBiN (6 μL) was drop casted on the surface of GCE and dried under infrared lamp, and (ⅱ) GOBiN/GCE was subjected to electrochemical reduction in the potential range of 0.6 V to -1.7 V in phosphate buffer of pH 6 (4 cycles) (Fig. S1 in Supporting information).

|
Download:
|
| Scheme 2. Fabrication of Er-GOBi/GCE and electrooxidation of GMB. | |
4.4. Analysis of GMB in injection samples
Practical utility of the proposed electrochemical sensor was established by analyzing GMB in pharmaceutical formulations. For this, a portion of injection equivalent to 1 mmol/L GMB was transferred into a 10 mL volumetric flask and diluted to volume with Millipore water. Appropriate amounts (5, 10 and 15 μmol/L) of this solution were taken and analyzed. The amount of GMB in the injection sample was calculated using the calibration graph or regression equation.
4.5. Determination of GMB in spiked urine samplesGMB spiked urine sample (1 mmol/L) was prepared by treating 1 mL untreated urine with 1 mL GMB solution (2 mmol/L). Suitable aliquots of analyte fortified urine sample were diluted with phosphate buffer of pH 3 to prepare working solutions. Differential pulse voltammograms were recorded and the amounts of GMB in analyte fortified urine samples were calculated by referring to the calibration curve.
AcknowledgmentThe authors thank the University Grant Commission, New Delhi, for providing financial support to carry out this study.
Appendix A. Supplementary dataSupplementary data associated with this article can be found, in the online version, at http://dx.doi.org/10.1016/j.cclet.2016.11.028.
| [1] | M.J. Allen, V.C. Tung, R.B. Kaner. Honeycomb carbon: a review of graphene. Chem. Rev. 110 (2010) 132–145. DOI:10.1021/cr900070d |
| [2] | Y.W. Zhang, S. Liu, L. Wang, et al., One-pot green synthesis of Ag nanoparticles-graphene nanocomposites and their applications in SERS, H2O2 and glucose sensing. RSC Adv. 2 (2012) 538–545. DOI:10.1039/C1RA00641J |
| [3] | L.P. Yang, W.A. Yee, S.L. Phua, et al., A high throughput method for preparation of highly conductive functionalized graphene and conductive polymer nanocomposites. RSC Adv. 2 (2012) 2208–2210. DOI:10.1039/c2ra00798c |
| [4] | Q.J. Xiang, J.G. Yu, M. Jaroniec. Graphene-based semiconductor photocatalysts. Chem. Soc. Rev. 41 (2012) 782–796. DOI:10.1039/C1CS15172J |
| [5] | F.N. Xi, L.J. Liu, Q. Wu, X.F. Lin. One-step construction of biosensor based on chitosan-ionic liquid-horseradish peroxidase biocomposite formed by electrodeposition. Biosens. Bioelectron. 24 (2008) 29–34. DOI:10.1016/j.bios.2008.03.023 |
| [6] | S. Roy, N. Soin, R. Bajpai, et al., Graphene oxide for electrochemical sensing applications. J. Mater. Chem. 21 (2011) 14725–14731. DOI:10.1039/c1jm12028j |
| [7] | Y. Bo, W.Q. Wang, J.F. Qi, S.S. Huang. A DNA biosensor based on graphene paste electrode modified with Prussian blue and chitosan. Analyst 136 (2011) 1946–1951. DOI:10.1039/c1an15084g |
| [8] | T. Gan, C.G. Hu, Z.L. Chen, S.S. Hu. Fabrication and application of a novel plant hormone sensor for the determination of methyl jasmonate based on selfassembling of phosphotungstic acid-graphene oxide nanohybrid on graphite electrode. Sens. Actuators B Chem. 151 (2010) 8–14. DOI:10.1016/j.snb.2010.10.001 |
| [9] | Y.Z. Lu, Y.Y. Jiang, W.T. Wei, et al., Novel blue light emitting graphene oxide nanosheets fabricated by surface functionalization. J. Mater. Chem. 22 (2012) 2929–2934. DOI:10.1039/C1JM14174K |
| [10] | N.L. Teradal, P.S. Narayan, J. Seetharamappa, A.K. Satpati. Electrosensing platform for varenicline based on reduced graphene oxide. Electroanalysis 26 (2014) 2173–2181. DOI:10.1002/elan.v26.10 |
| [11] | H.L. Guo, X.F. Wang, Q.Y. Qian, F.B. Wang, X.H. Xia. A green approach to the synthesis of graphene nanosheets. ACS Nano 3 (2009) 2653–2659. DOI:10.1021/nn900227d |
| [12] | Y. Zhou, Q.L. Bao, L.A.L. Tang, Y.L. Zhong, K.P. Loh. Hydrothermal dehydration for the green reduction of exfoliated graphene oxide to graphene and demonstration of tunable optical limiting properties. Chem. Mater. 21 (2009) 2950–2956. DOI:10.1021/cm9006603 |
| [13] | S. Stankovich, D.A. Dikin, R.D. Piner, et al., Synthesis of graphene-based nanosheets via chemical reduction of exfoliated graphite oxide. Carbon 45 (2007) 1558–1565. DOI:10.1016/j.carbon.2007.02.034 |
| [14] | N.L. Teradal, P.S. Narayan, A.K. Satpati, J. Seetharamappa. Fabrication of electrochemical sensor based on green reduction of graphene oxide for an antimigraine drug, rizatriptan benzoate. Sens. Actuators B Chem. 196 (2014) 596–603. DOI:10.1016/j.snb.2014.02.015 |
| [15] | Y.Y. Shao, J. Wang, M. Engelhard, C.M. Wang, Y.H. Lin. Facile and controllable electrochemical reduction of graphene oxide and its applications. J. Mater. Chem. 20 (2010) 743–748. DOI:10.1039/B917975E |
| [16] | A.K. Baytak, T. Teker, S. Duzmen, M. Aslanoglu. A sensitive determination of terbutaline in pharmaceuticals and urine samples using a composite electrode based on zirconium oxide nanoparticles. Mater. Sci. Eng. C 67 (2016) 125–131. DOI:10.1016/j.msec.2016.05.008 |
| [17] | A.K. Baytak, M. Aslanoglu. Voltammetric quantification of tryptophan using a MWCNT modified GCE decorated with electrochemically produced nanoparticles of nickel. Sens. Actuators B Chem. 220 (2015) 1161–1168. DOI:10.1016/j.snb.2015.06.105 |
| [18] | A.K. Baytak, T. Teker, S. Duzmen, M. Aslanoglu. A composite material based on nanoparticles of yttrium(Ⅲ) oxide for the selective and sensitive electrochemical determination of acetaminophen. Mater. Sci. Eng. C 66 (2016) 278–284. DOI:10.1016/j.msec.2016.04.086 |
| [19] | A.K. Baytak, S. Duzmen, T. Teker, M. Aslanoglu. A novel modified electrode based on terbium oxide and carbon nanotubes for the simultaneous determination of methyldopa and paracetamol. Anal. Methods 8 (2016) 4711–4719. DOI:10.1039/C6AY00969G |
| [20] | X. Du, S.W. Tsai, D.L. Maslov, A.F. Hebard. Metal-insulator-like behavior in semimetallic bismuth and graphite. Phys. Rev. Lett. 94 (2005) 166601. DOI:10.1103/PhysRevLett.94.166601 |
| [21] | R. Devasenathipathy, V. Mani, S.M. Chen. Highly selective amperometric sensor for the trace level detection of hydrazine at bismuth nanoparticles decorated graphene nanosheets modified electrode. Talanta 124 (2014) 43–51. DOI:10.1016/j.talanta.2014.02.031 |
| [22] | K.E. Toghill, G.G. Wildgoose, A. Moshar, C. Mulcahy, R.G. Compton. The fabrication and characterization of a bismuth nanoparticle modified boron doped diamond electrode and its application to the simultaneous determination of cadmium(Ⅱ) and lead(Ⅱ). Electroanalysis 20 (2008) 1731–1737. DOI:10.1002/elan.v20:16 |
| [23] | F.D. Wang, W.E. Buhro. An easy shortcut synthesis of size-controlled bismuth nanoparticles and their use in the SLS growth of high-quality colloidal cadmium selenide quantum wires. Small 6 (2010) 573–581. DOI:10.1002/smll.v6:4 |
| [24] | J.Y. Fang, K.L. Stokes, J. Wiemann, W.L. Zhou. Nanocrystalline bismuth synthesized via an in situ polymerization-microemulsion process. Mater. Lett. 42 (2000) 113–120. DOI:10.1016/S0167-577X(99)00169-X |
| [25] | C.N. Tharamani, H.C. Thejaswini, S. Sampath. Synthesis of size-controlled Bi particles by electrochemical deposition. Bull. Mater. Sci. 31 (2008) 207–212. DOI:10.1007/s12034-008-0037-x |
| [26] | V. Mani, R. Devasenathipathy, S.M. Chen, B. Subramani, M. Govindasamy. A novel glucose biosensor at glucose oxidase immobilized graphene and bismuth nanocomposite film modified electrode. Int. J. Electrochem. Sci. 10 (2015) 691–700. |
| [27] | R.Q. Liu, S.M. Liang, X.Z. Tang, et al., Tough and highly stretchable graphene oxide/polyacrylamide nanocomposite hydrogels. J. Mater. Chem. 22 (2012) 14160–14167. DOI:10.1039/c2jm32541a |
| [28] | V. Dhand, K.Y. Rhee, H.J. Kim, D.H. Jung. A comprehensive review of graphene nanocomposites: research status and trends. J. Nanomater. 2013 (2013) 763953. |
| [29] | C. Xu, X. Wang, J.W. Zhu. Graphene-metal particle nanocomposites. J. Phys. Chem. C 112 (2008) 19841–19845. DOI:10.1021/jp807989b |
| [30] | G.L. Li, G. Liu, M. Li, et al., Organo-and water-dispersible graphene oxidepolymer nanosheets for organic electronic memory and gold nanocomposites. J. Phys. Chem. C 114 (2010) 12742–12748. DOI:10.1021/jp102640s |
| [31] | H. Bai, K.X. Sheng, P.F. Zhang, C. Li, G.Q. Shi. Graphene oxide/conducting polymer composite hydrogels. J. Mater. Chem. 21 (2011) 18653–18658. DOI:10.1039/c1jm13918e |
| [32] | Y.W. Cao, J.C. Feng, P.Y. Wu. Polypropylene-grafted graphene oxide sheets as multifunctional compatibilizers for polyolefin-based polymer blends. J. Mater. Chem. 22 (2012) 14997–15005. DOI:10.1039/c2jm31477k |
| [33] | V.K. Ponnusamy, V. Mani, S.M. Chen, W.T. Huang, J.F. Jen. Rapid microwave assisted synthesis of graphene nanosheets/polyethyleneimine/gold nanoparticle composite and its application to the selective electrochemical determination of dopamine. Talanta 120 (2014) 148–157. DOI:10.1016/j.talanta.2013.12.003 |
| [34] | S. Lee, S.K. Park, E. Choi, Y.Z. Piao. Voltammetric determination of trace heavy metals using an electrochemically deposited graphene/bismuth nanocomposite film-modified glassy carbon electrode. J. Electroanal. Chem. 766 (2016) 120–127. DOI:10.1016/j.jelechem.2016.02.003 |
| [35] | G. Zhao, H. Wang, G. Liu. Electrochemical determination of trace cadmium in soil by a bismuth film/graphene-β-cyclodextrin-nafion composite modified electrode. Int. J. Electrochem. Sci. 11 (2016) 1840–1851. |
| [36] | X.P. Hu, D.W. Pan, M.Y. Lin, H.T. Han, F. Li. Graphene oxide-assisted synthesis of bismuth nanosheets for catalytic stripping voltammetric determination of iron in coastal waters. Microchim. Acta 183 (2016) 855–861. DOI:10.1007/s00604-015-1733-z |
| [37] | J. Wang, X.R. Chen, K.B. Wu, M. Zhang, W.S. Huang. Highly-sensitive electrochemical sensor for Cd2+ and Pb2+ based on the synergistic enhancement of exfoliated graphene nanosheets and bismuth. Electroanalysis 28 (2016) 63–68. DOI:10.1002/elan.v28.1 |
| [38] | L. Cui, J. Wu, H.X. Ju. Synthesis of bismuth-nanoparticle-enriched nanoporous carbon on graphene for efficient electrochemical analysis of heavy-metal ions. Chem. Eur. J. 21 (2015) 11525–11530. DOI:10.1002/chem.201500512 |
| [39] | X.P. Hu, D.W. Pan, M.Y. Lin, H.T. Han, F. Li. One-step electrochemical deposition of reduced graphene oxide-bismuth nanocomposites for determination of lead. ECS Electrochem. Lett. 4 (2015) H43–H45. DOI:10.1149/2.0021509eel |
| [40] | A. Maraveyas, J. Waters, R. Roy, et al., Gemcitabine versus gemcitabine plus dalteparin thromboprophylaxis in pancreatic cancer. Eur. J. Cancer 48 (2012) 1283–1292. DOI:10.1016/j.ejca.2011.10.017 |
| [41] | H.Q. Xiong, A. Rosenberg, A. LoBuglio, et al., Cetuximab, a monoclonal antibody targeting the epidermal growth factor receptor, in combination with gemcitabine for advanced pancreatic cancer: a multicenter phase Ⅱ trial. J. Clin. Oncol. 22 (2004) 2610–2616. DOI:10.1200/jco.2004.22.14_suppl.2610 |
| [42] | J.E. Frampton, A.J. Wagstaff. Gemcitabine: a review of its use in the management of pancreatic cancer. Am. J. Cancer 4 (2005) 395–416. DOI:10.2165/00024669-200504060-00006 |
| [43] | M.J. O'Neil, A. Smith, T.E. Heckelman, F. Dudavari. Merck Index, An Encyclopedia of Chemicals, Drugs and Biologicals, 13th ed., Merck Research Laboratories, Merck: Whitehouse Station, NJ, 2001 . |
| [44] | C.M. Galmarini, J.R. Mackey, C. Dumontet. Nucleoside analogues and nucleobases in cancer treatment. Lancet Oncol. 3 (2002) 415–424. DOI:10.1016/S1470-2045(02)00788-X |
| [45] | S.S. Kalanur, U. Katrahalli, J. Seetharamappa. Electrochemical studies and spectroscopic investigations on the interaction of an anticancer drug with DNA and their analytical applications. J. Electroanal. Chem. 636 (2009) 93–100. DOI:10.1016/j.jelechem.2009.09.018 |
| [46] | N.L. Teradal, S.S. Kalanur, S.N. Prashanth, J. Seetharamappa. Electrochemical investigations of an anticancer drug in the presence of sodium dodecyl sulfate as an enhancing agent at carbon paste electrode. J. Appl. Electrochem. 42 (2012) 917–923. DOI:10.1007/s10800-012-0473-6 |
| [47] | G.A. Tığ, B. Zeybek, Ş. Pekyardımcı. Electrochemical DNA biosensor based on poly(2, 6-pyridinedicarboxylic acid) modified glassy carbon electrode for the determination of anticancer drug gemcitabine. Talanta 154 (2016) 312–321. DOI:10.1016/j.talanta.2016.03.049 |
| [48] | V. Rajesh, B. Anupama, V. Jagathi, P.S. Praveen. Simultaneous estimation of gemcitabine hydrochloride and capecitabine hydrochloride in combined tablet dosage form by RP-HPLC method. E.-J. Chem. 8 (2011) 1212–1217. DOI:10.1155/2011/437157 |
| [49] | P.S. Sarsambi, K. Chakravarthy, K.P. Rao. Spectrophotometric estimation of gemcitabine in bulk drug and its formulation. J. Anal. Chem. 1 (2011) 18–24. |
| [50] | S. Mastanamma, G. Ramkumar, D.A. Kumar, J.V.L.N.S. Rao. A stability indicating RP-HPLC method for the estimation of gemcitabine HCl in injectable dosage forms. E.-J. Chem. 7 (2010) S239–S244. DOI:10.1155/2010/724915 |
| [51] | W.S. Hummers Jr, R.E. Offeman. Preparation of graphitic oxide. J. Am. Chem. Soc. 80 (1958) 1339. DOI:10.1021/ja01539a017 |
| [52] | M.L. Yang, Z.B. Hu. Electrodeposition of bismuth onto glassy carbon electrodes from nitrate solutions. J. Electroanal. Chem. 583 (2005) 46–55. DOI:10.1016/j.jelechem.2005.04.019 |
| [53] | R. Pauliukaite, R. Metelka, I. Švancara, et al., Carbon paste electrodes modified with Bi2O3 as sensors for the determination of Cd and Pb. Anal. Bioanal. Chem. 374 (2002) 1155–1158. DOI:10.1007/s00216-002-1569-3 |
| [54] | O.V. Kharissova, M. Osorio, B.I. Kharisov, M.J. Yacamán, U.O. Méndez. A comparison of bismuth nanoforms obtained in vacuum and air by microwave heating of bismuth powder. Mater. Chem. Phys. 121 (2010) 489–496. DOI:10.1016/j.matchemphys.2010.02.013 |
| [55] | B. Rezaei, S. Damiri. Voltammetric behavior of multi-walled carbon nanotubes modified electrode-hexacyanoferrate(Ⅱ) electrocatalyst system as a sensor for determination of captopril. Sens. Actuators B Chem. 134 (2008) 324–331. DOI:10.1016/j.snb.2008.05.004 |
| [56] | M.A. Kiani, M.F. Mousavi, S. Ghasemi. Size effect investigation on battery performance: comparison between micro-and nano-particles of β-Ni(OH)2 as nickel battery cathode material. J. Power Sources 195 (2010) 5794–5800. DOI:10.1016/j.jpowsour.2010.03.080 |
| [57] | A. Shah, V.C. Diculescu, R. Qureshi, A.M. Oliveira-Brett. Electrochemical behaviour of dimethyl-2-oxoglutarate on glassy carbon electrode. Bioelectrochemistry 77 (2010) 145–150. DOI:10.1016/j.bioelechem.2009.07.012 |
| [58] | E. Laviron. General expression of the linear potential sweep voltammogram in the case of diffusionless electrochemical systems. J. Electroanal. Chem. Interf. Electrochem. 101 (1979) 19–28. DOI:10.1016/S0022-0728(79)80075-3 |
| [59] | E. Laviron, L. Roullier. General expression of the linear potential sweep voltammogram for a surface redox reaction with interactions between the adsorbed molecules: applications to modified electrode. J. Electroanal. Chem. Interf. Electrochem. 115 (1980) 65–74. DOI:10.1016/S0022-0728(80)80496-7 |