 2017, Vol. 28


b University of Chinese Academy of Sciences, Beijing 100029, China
Surfactants have a characteristic molecular structure consisting of hydrophilic and hydrophobic groups, which are known as amphiphilic molecules. Due to this special structure, surfactants show unique properties in solution, and they are important parts in industrial and environmental applications [1].
In spite of the clear understanding of thermodynamic background of the micelles formation, the detailed process of the micellization, or routes of micelles formation is still ambiguous. Understanding the process of micellization can open new possibilities for experimental study and applications of micellar systems [2].
As well known, at very low concentrations, surfactants are believed to exist in the single molecular state in the solution, whereas, above a certain concentration they start to self-assemble to form premicelles first and then micelles, which is considered to be the surfactant critical aggregation concentration (CAC). It designates the onset of aggregation of free surfactants into micelles in the spontaneous micellization process, which is a key parameter of the surfactant [3, 4].
Various techniques including surface tension [5-7], electrical conductivity [8-10], light scattering [11], fluorescence spectroscopy [6, 10, 12] and 1H NMR spectroscopy can be used to determine the value of the CAC [13, 14]. NMR spectroscopy has the unique characteristic other than the surface tension, electrical conductivi-ty, light scattering and fluorescence spectroscopy of giving microscopic behaviors of the system being studied.
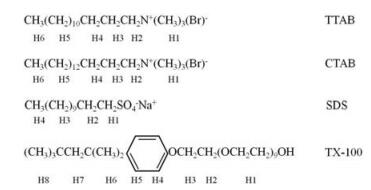
It is well known, that the proton chemical shift of the surfactant in solution varies with its concentration, from which its CAC can be evaluated. Generally, one takes the variation of chemical shifts of any one proton of the molecule to estimate the CAC of the surfactant. However, in the present study, our results show that the CAC values of protons at different positions of the same molecule are different. Here, variations of proton chemical shifts of four with three kinds of surfactants including cationic surfactants, anionic surfactants and nonionic surfactants were measured as functions of their concentrations. The chemical structures and proton numbering of the surfactants studied are shown in Fig. 1, the numberings of which are arranged according to the start from the hydrophilic groups to the hydrophobic groups.

|
Download:
|
| Fig. 1. Chemical structures and proton numbering of the surfactants studied. | |
2. Results and discussion 2.1. Determination of CAC
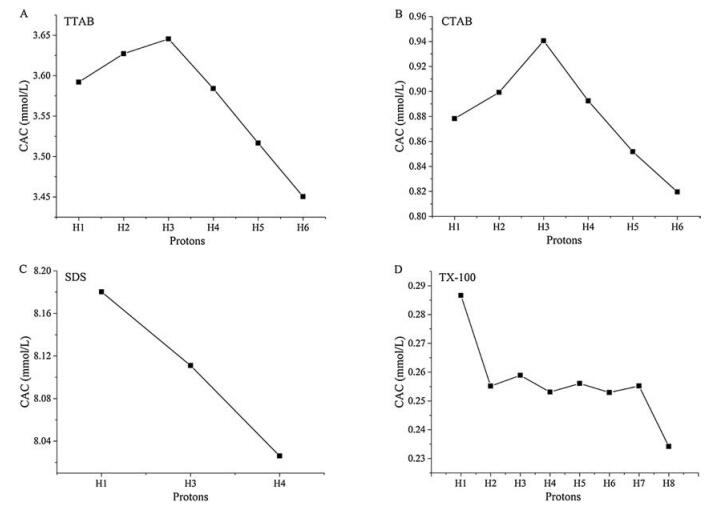
Usually one plots the observed chemical shifts of the surfactant resonance peak versus the reciprocal of surfactant concentration, which typically yields two straight lines connected by a curve. The value of CAC can be acquired from the intersection of these two straight lines. Another method is to fit the NMR experimental data with a model. Al-Soufi et al. [15] applied Phillips and García-Mateos' equation directly to the monomer concentration, after some rearrangements, they presented a useful function for the quantitative analysis of the experimental data. In this work, we used both the traditional chemical shift vs. reciprocal concentration method (Fig. S1A in Supporting information) and Al-Soufi' model (Fig. S1B in Supporting information) to extract the CAC values for the protons at different positions of the surfactant. Although the former method is only qualitative (Figs. S2-S5 in Supporting information), it gives consistent results with those fitted from the Al-Soufi' model as shown in Fig. 2. It is worth mentioning that the proton chemical shifts of the nine oxyethylene groups in TX-100 give an overlapping signal. To simplify the calculation, we chose the observed chemical shift of the center of overlapping signals to evaluate the CAC value of these groups. Moreover, the changes of the observed chemical shifts of H2 of SDS were too small to make an accurate estimation for the CAC value, so the CAC value of H2 of SDS is not shown in Fig. 2C.

|
Download:
|
| Fig. 2. The CAC values for the protons at different positions of the surfactants. (A) TTAB, cationic surfactant; (B) CTAB, cationic surfactant; (C) SDS, anionic surfactant; (D) TX-100, nonionic surfactant. | |
2.2. Micellization mechanism
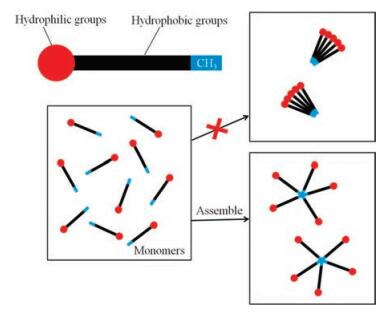
From Fig. 2, one can easily find that the CAC values of protons at different positions of the same molecule are not the same. Besides, the terminal methyl protons are the lowest. The CAC values get higher with the decrease in the distances of the protons from the polar head group. It indicates that during micelle formation the terminal methyl groups may come close to each other first, as shown in Fig. 3. Carefully examining Fig. 2A, one can find that the CAC value of proton H1 for TTAB is smaller than that of protons H2 and H3. Moreover, Fig. 2B of CTAB, an analogue of TTAB, shows similar trend. This can be attributed to the fact that the amino trimethyl groups occupy larger space, so they come close to each other earlier than that of protons H2 and H3. In studying the presence of premicelle Idiyatullin et al. [16] showed that the critical dimmer concentration of the protons of terminal methyl group is 2.9 mmol/L, while that of the methylene groups is 3.7 mmo/L, which is consistent with our results.

|
Download:
|
| Fig. 3. Schematic representation of the micellization mechanism. Terminal methyl groups (in blue) aggregate firstly during micelle formation. They initiate the micelle formation. | |
2.3. Transverse relaxation experiments
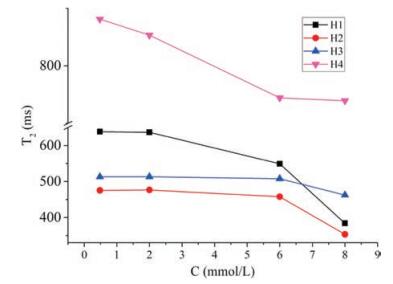
To more directly illustrate this conclusion, we performed the transverse relaxation experiment which can be used to characterize the variation of proton motion resulted by self-association of the surfactant molecules [17, 18]. Variation in transverse relaxation time (T2) of protons at different positions of SDS with concentrations below its CAC is shown in Fig. 4. T2 values for H1, H2, H3 and H4 are almost constant, respectively. It agrees with that in heavily diluted SDS solutions with concentrations lower than 0.48 mmo/L, the SDS molecules are in the single molecular state in the solution However, when the concentration increased and reached above a certain value, i.e. in the range of concentration lower than 2 mmo/L, the values of T2 of H4 proton begin to drastically decrease with the increase in surfactant concentration. This indicates that the chemical environment of the protons in the terminal methyl groups has changed, while the values of the other groups remained almost unchanged. It strongly supports that the protons in the terminal methyl groups aggregate firstly upon the transition from the single molecular state to micelle form.

|
Download:
|
| Fig. 4. Variations of transverse relaxation times (T2) of different protons with the surfactant concentrations for SDS in D2O at 298 K. | |
3. Conclusion
In conclusion, the evaluation of CAC of four with three types of surfactants by fitting 1H chemical shift experimental data of protons at different positions of the surfactant with the variation in concentration, using two different models, shows a universal behavior of the surfactants. The further the proton apart from the polar group, the earlier it self-aggregates, i.e. the terminal methyl group initiates micellization. T2 experiments of SDS support this conclusion Consequently, we shed light on the microscopic information about surfactant micellization using NMR.
4. Experimental 4.1. MaterialsTTAB was the product of Trade (TCI) Mark. CTAB was the product of Acros Organics. SDS was the product of Alfa Aesar. TX-100 was the product of Nacalai Tesque. D2O was the product of Cambridge Isotope Laboratories with a deuteration of 99.9%. The reagents were used as received, without any further purification. D2O was used as solvent instead of water in order to weaken the water signal and proper amounts of TSP (Me3Si-CD2CD2-CO2Na) was used as the external reference [13, 18-20].
4.2. NMR experimentsAll of the NMR experiments were performed on a Bruker AVENCE-600 NMR spectrometer with a proton frequency of 600.13 MHz at 298 K. For the 1H spectrum, a small pulse flip-angle 30° were used rather than 90° in the conventional single pulse sequence to save time and assure complete recovery of magnetization vector. The transverse relaxation experiments were acquired with the standard pulse program from Bruker Topspin software, cpmg, using Carr-Purcell-Meiboom-Gill pulse sequences.
AcknowledgmentThis work supported by the National Natural Science Foundation of China (Nos. 21375145, 21221064) is gratefully acknowledged.
Appendix A. Supplementary dataSupplementary data associated with this article can be found, in the online version, at http://dx.doi.org/10.1016/j.cclet.2017.04.013.
| [1] | K. Holmberg, D.O. Shah, M.J. Schwuger. Handbook of Applied Surface and Colloid Chemistry. John Wiley & Sons (2002) . |
| [2] | V. Starov, V. Zhdanov, N.M. Kovalchuk. Kinetic models of micelles formation. Colloid Surf. A 354 (2010) 268–278. DOI:10.1016/j.colsurfa.2009.07.029 |
| [3] | M.J. Rosen, J.T. Kunjappu. Surfactants and Interfacial Phenomena, fourth ed.. John Wiley & Sons (2012) . |
| [4] | A.G. Daful, V.A. Baulin, J.B. Avalos, A.D. Mackie. Accurate critical micelle concentrations from a microscopic surfactant model. J. Phys. Chem. B 115 (2011) 3434–3443. DOI:10.1021/jp1102302 |
| [5] | A. Patist, S.G. Oh, R. Leung, D.O. Shah. Kinetics of micellization: its significance to technological processes. Colloid Surf. A 176 (2001) 3–16. DOI:10.1016/S0927-7757(00)00610-5 |
| [6] | S.P. Moulik, M.E. Haque, P.K. Jana, A.R. Das. Micellar properties of cationic surfactants in pure and mixed states. J. Phys. Chem. 100 (1996) 701–708. DOI:10.1021/jp9506494 |
| [7] | P.K. Jana, S.P. Moulik. Interaction of bile-salts with hexadecyltrimethylammonium bromide and sodium dodecyl-sulfate. J. Phys. Chem. 95 (1991) 9525–9532. DOI:10.1021/j100176a089 |
| [8] | M. Benrraou, B.L. Bales, R. Zana. Effect of the nature of the counterion on the properties of anionic surfactants. 1. Cmc, ionization degree at the cmc and aggregation number of micelles of sodium, cesium, tetramethylammonium, tetraethylammonium, tetrapropylammonium, and tetrabutylammonium dodecyl sulfates. J. Phys. Chem. B 107 (2003) 13432–13440. DOI:10.1021/jp021714u |
| [9] | R. Zana, H. Levy, D. Danino, Y. Talmon, K. Kwetkat. Mixed micellization of cetyltrimethylammonium bromide and an anionic dimeric (gemini) surfactant in aqueous solution. Langmuir 13 (1997) 402–408. DOI:10.1021/la9606963 |
| [10] | A. Cifuentes, J.L. Bernal, J.C. DiezMasa. Determination of critical micelle concentration values using capillary electrophoresis instrumentation. Anal. Chem. 69 (1997) 4271–4274. DOI:10.1021/ac970696n |
| [11] | W.P.J. Ford, R.H. Ottewill, H.C. Parreira. Light-scattering studies on dodecylpyridinium halides. J. Colloid Interface Sci. 21 (1966) 522–533. DOI:10.1016/0095-8522(66)90050-X |
| [12] | J. Aguiar, P. Carpena, J.A. Molina, - Bolivar, C.C. Ruiz. On the determination of the critical micelle concentration by the pyrene 1:3 ratio method. J. Colloid Interface Sci. 258 (2003) 116–122. DOI:10.1016/S0021-9797(02)00082-6 |
| [13] | X.H. Cui, Y. Jiang, C.S. Yang, et al., Mechanism of the mixed surfactant micelle formation. J. Phys. Chem. B 114 (2010) 7808–7816. DOI:10.1021/jp101032z |
| [14] | X.H. Cui, S.Z. Mao, M.L. Liu, H.Z. Yuan, Y.R. Du. Mechanism of surfactant micelle formation. Langmuir 24 (2008) 10771–10775. DOI:10.1021/la801705y |
| [15] | W. Al-Soufi, L. Pineiro, M. Novo. A model for monomer and micellar concentrations in surfactant solutions: application to conductivity, NMR, diffusion, and surface tension data. J. Colloid Interface Sci. 370 (2012) 102–110. DOI:10.1016/j.jcis.2011.12.037 |
| [16] | B.Z. Idiyatullin, K.S. Potarikina, Y.F. Zuev, O.S. Zueva, O.G. Us'yarov. Association of sodium dodecyl sulfate in aqueous solutions according to chemical shifts in 1H NMR spectra. Colloid J. 75 (2013) 532–537. DOI:10.1134/S1061933X13050037 |
| [17] | Y. Feng, M.B. Taraban, Y.B. Yu. Water proton NMR-a sensitive probe for solute association. Chem. Commun. 51 (2015) 6804–6807. DOI:10.1039/C5CC00741K |
| [18] | Y. Jiang, H. Chen, X.H. Cui, et al., 1H NMR study on pre-micellization of quaternary ammonium gemini surfactants. Langmuir 24 (2008) 3118–3121. DOI:10.1021/la703346p |
| [19] | Y. Jiang, H. Chen, S.Z. Mao, et al., Dynamics of mixed surfactants in aqueous solutions. J. Phys. Chem. B 115 (2011) 1986–1990. DOI:10.1021/jp107858y |
| [20] | Y. Jiang, X.Y. Lu, H. Chen, et al., NMR study of the dynamics of cationic gemini surfactant 14-2-14 in mixed solutions with conventional surfactants. J. Phys. Chem. B 113 (2009) 8357–8361. DOI:10.1021/jp902419u |