 2017, Vol. 28


b College of Pharmaceutical Sciences, Southwest University, Chongqing 400716, China
Fluorescent carbon nanoparticles (CNPs) have attracted tremendous attention owing to their fascinating properties such as stable photoluminescence [1-8], low toxicity [9], low photo-bleaching and excellent biocompatibility [3]. These superior properties of fluorescent carbon nanoparticles distinguish them from metal-based quantum dots (QDS), and make them as promising candidates for many exciting applications, such as bioimaging [3, 10], disease detection [11], medical diagnosis [12], and ion detection [13, 14].
According to different treatment, approaches for synthesizing CNPs can be classified into arc-discharge methods [15], electrochemical synthesis [16], pyrolysis [17], synthesis with microwaves [18], hydrothermal methods [8, 9, 19] and so on. However, there are still a lot of unknowns about the CNPs, such as controlling the morphology, size, and surface chemistry of the resultant products. Moreover, exploration of photoluminescent CNPs with high quantum yields (QYs) ( > 30%) as fluorescent chemosensors to monitor and image biological processesn still remains in an early stage. Recently, there has been a trend to synthesize CNPs from biomaterials because they are inexpensive, easy to obtain and nontoxic [20, 21]. It has been demonstrated that nitrogen-doped or sulfur-doped carbon nanoparticles can significantly enhance their properties and expand their novel applications. For instances, Wu et al. prepared CNPs with nitrogen content of 10.45% and QYs of 13.9% by hydrothermal treatment of bombyx mori silk [9]. Liu et al. produced fluorescent CNPs with nitrogen content of 6.2% and QYs of 4.23% by using grass as carbon precursor [22]. Liang et al. produced nitrogen and sulfur co-doped fluorescent CNPs with QYs of 31.6% by using gelatin as carbon precursor [23].
Iron (Ⅲ) ions (Fe3+) play essential roles in biological systems by oxygen uptake, oxygen metabolism, and electron transfer [24]. Fe3+ deficiency and overloading can both induce various biological disorders [25]. Currently, the detection of Fe3+ can be achieved by using organic dyes [26], fluorescent metal nanoclusters [27], fluorescent metal organic frameworks [28], semiconductor quantum dots [29], etc., as probes. These probes often provide excellent selectivity, but their preparations usually require specialized synthetic techniques and sophisticated purification procedures. They are also toxic to living cells, which limited them to cell imaging.
Herein, we chose millet, a staple food in the semiarid regions of East Asia which contains nitrogen and sulfur, as carbon source to prepare CNPs [30, 31]. Through one-step hydrothermal treatment of millet without any additives to provide nitrogen and sulfur, we synthesized a new kind of water-soluble, polymer-like, nitrogen and sulfur co-doped CNPs with the size of ca. 56 nm and the QYs of 30.4%. The as-obtained CNPs also showed amazing photostability and biocompatibility, and can resist to acids, bases and high ionic strength. They have been successfully applied as fluorescent probes for the detection of Fe3+ and cell imaging.
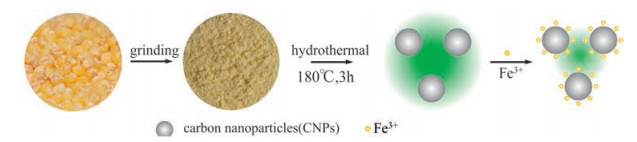
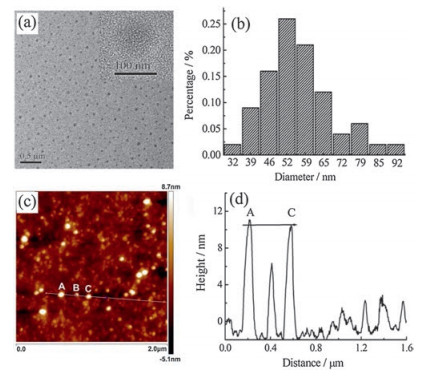
2. Results and discussion 2.1. Synthesis and characterizations of CNPsScheme 1 illustrates the principle of our method. The millet was milled to powder firstly, and then was treated by a one-step hydrothermal process at 180 ℃ in 0.1 mol/L NaOH for 3 h. The transmission electron microscopy (TEM) image (Fig. 1a) clearly reveals that the CNPs have a relatively wide size distribution in the range from 32 to 92 nm with an average size of 56 nm (Fig. 1b). The high resolution transmission electron microscopy (HRTEM) image (inset in Fig. 1a) shows that CNPs have no obvious lattice fringes, confirming their polymer-like amorphous nature. The atomic force microscopy (AFM) image (Fig. 1c and 1d) shows that the height of CNPs approximately distributes in the range from 2 to 10 nm. This height distortion may be ascribed to the structure collapse of the CNPs when the preparation process for AFM testing samples. It is a common phenomenon that low-polymerization polymers are obtained in a collapsed form when they are dried on solid substrates [19, 32, 33]. Simultaneously, the three-dimensional AFM image (Fig. S1 in Supporting information) also reveals that the CNPs have a wide height distribution.

|
Download:
|
| Scheme 1. Schematic representation of the formation process of CNPs from millet powder by hydrothermal treatment and Fe3+ detection. | |

|
Download:
|
| Fig. 1. Morphology characterization of CNPs. a, TEM image; b, particle size distribution; c, AFM image; d, height distribution of the as-prepared CNPs. | |
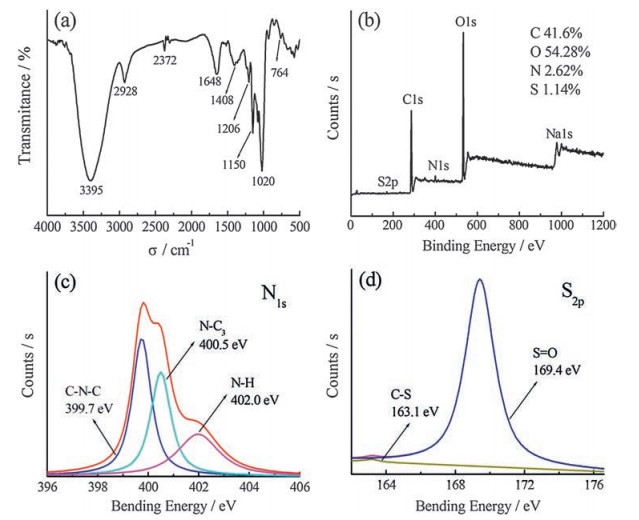
Chemical and structural information about the CNPs was obtained from the Fourier transform infrared spectroscopy (FTIR) spectrum (Fig. 2a). Peaks at around 3395 cm-1 and 2928 cm-1 correspond to the O—H/N—H and C—H stretching vibration [34], respectively. The C=O stretching vibration is at 1648 cm-1 and C—N stretching vibration is at 1408 cm-1. Peak at 1206 cm-1 corresponds to the asymmetric stretching vibrations of C—O. Bands at 1150, 1020 cm-1 are attributed to the S=O and C = S stretching vibration, respectively. Weak C-S stretching is also observed at around 764 cm-1 [23, 35]. These results reveal that the molecular structures of the CNPs mainly contain functional groups like —OH and —COOH, which endow the CNPs with high water solubility and a Zeta potential of -18.9 mV. The surface composition and element analysis for the overall composition of the resultant CNPs were characterized by X-ray photoelectron spectroscopy (XPS). As shown in Fig. 2b, four typical peaks of C1s, O1s, N1s, and S2P were observed, and the corresponding content of each element is displayed in the inset of Fig. 2b. The C1s spectrum (Fig. S2a in Supporting information) shows four peaks that correspond to C—C (285.0 eV), C—N (286.1 eV), C—O (286.8 eV) and C=O (287.8 eV) [9]. While the O1s spectrum (Fig. S2b in Supporting information) exhibits two peaks that correspond to C=O (532.4 eV) and C—OH/C—O—C (533.2 eV) [13]. The N1s spectrum (Fig. 2c) reveals three relative nitrogen species of C—N—C (399.7 eV), N—C3 (400.5 eV) and N—H (402.0 eV) [19]. The S2p spectrum (Fig. 2d) shows weak C—S (163.1 eV) peak and strong S=O (169.4 eV) peak which are consistent with FTIR results [21, 35, 36]. The XPS results indicate that most S atoms are doped by forming —C—S(O)x—C— bond in CNPs [37, 38] and the CNPs are N, S co-doped, which leads to the high luminescent efficiency [21].

|
Download:
|
| Fig. 2. FTIR (a), XPS (b), N1s (c) and S2p (d) spectra of the obtained products. | |
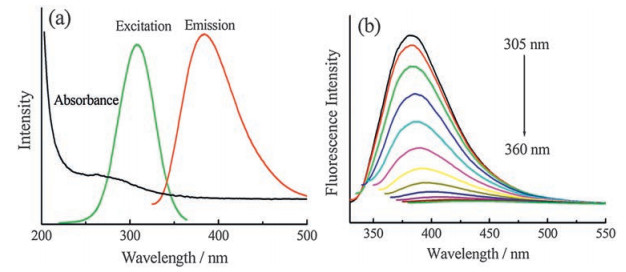
Fig. 3a shows the optical properties of the CNPs. They have a very broad absorption band in UV-vis region with a shoulder peak at 262 nm. When excited at 305 nm, the CNPs show a strong emission peak centered at 381 nm. As shown in Fig. 3b, with increasing excitation wavelength from 305 nm to 360 nm, the photoluminescence peak correspondingly shifts from 381 to 426 nm. That is to say, the CNPs present the excitation-dependent photoluminescent behavior, which is in accordance with previous reports and can probably be attributed to the presence of different particle sizes and the distribution of the different surface emission traps of the CNPs [7, 23, 39]. Meanwhile, the CNPs exhibit good photoluminescent behavior with a high QY of 30.4% against the reference of quinine sulfate (Fig. S3 in Supporting information), which is much higher than previously reported CDs [8, 22] and may be caused by the in situ doping by nitrogen or sulfur [21, 40]. The mean fluorescence lifetime of CNPs is calculated to be 0.76 ns (Fig. S4 in Supporting information). Such a short lifetime indicates that the possible luminescent mechanism is the radioactive recombination nature of excitations [9, 18].

|
Download:
|
| Fig. 3. UV-vis absorption and photoluminescent properties of CNPs. a, UV-vis absorption spectrum and photoluminescent spectra. b, Emission spectra of CDs recorded for progressively longer excitation wavelength in 5 nm increment from 305 nm to 360 nm. | |
The CNPs show excellent photostability and the fluorescence intensity remains unchanged under continuous excitation (305 nm) with a Xe lamp for 30 min (Fig. S5 in Supporting information). Meanwhile, the CNPs are very stable and the fluorescence intensity scarcely shows any change even if they were dispersed in an aqueous solution with the ionic strength of 3.0 mol/L NaCl (Fig. S6 in Supporting information), indicating that CNPs could be stable in a medium of comparatively high ionic strength. However, the PL intensity gets slightly increase in the pH range from 1.98 to 11.98, and the fluorescence intensity has a linear relationship with the pH in the range of 5-9 (Fig. S7 in Supporting information), which shows the CNPs could be utilized as pH probe in a narrow range. The PL intensity significantly increases when the pH is tuned from 2 to 12. After the pH value is restored to 2, the PL is also restored. Even after 5 cycles of changing pH from 2 to 12 and then from 12 to 2 in the same solution by 0.1 mol/L NaOH and 0.1 mol/L HCl, the PL intensity remains nearly as before (Fig. S8 in Supporting information). This pH effect indicates that PL species in the CNPs should have basic and acidic sites relevant to the photoluminescence emission. This pH-dependent emission feature of the CNPs is obviously dependent on the protonation and deprotonation of the functional groups (—OH, —COOH) on the surface of CNPs [34].
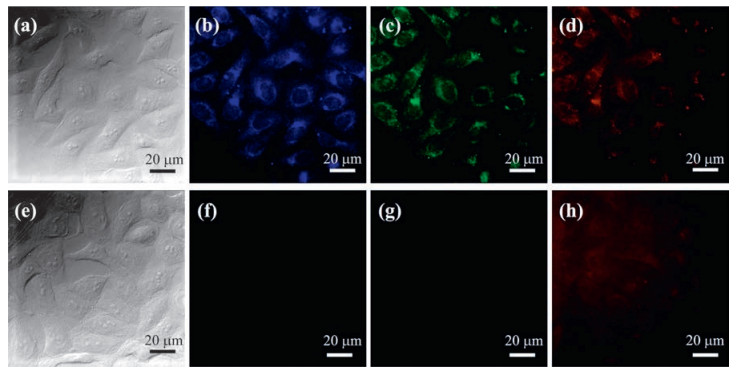
2.2. Cell cytotoxicity and confocal microscopy imagingAs stated above, the as-obtained CNPs are suitable for biological imaging for their dramatic photostability and high QYs. The inherent cytotoxicity of CNPs was evaluated using Human epidermoid cancer cells (Hep-2) cell lines through CCK-8 assay. It is noteworthy that the obtained CNPs scarcely impose toxicity to the cells (Fig. S9 in Supporting information) even at a relatively high dose (200 μg/mL) and long incubation time (24 h), hence they are safe for bioimaging. In such case, Hep-2 cells were cultured and maintained in Roswell Park Memorial Institute 1640 (RPMI) 1640 medium containing CNPs to test the in vitro cellular uptake of the CNPs. The confocal images of Hep-2 cells treated with CNPs (Fig. 4) show that the Hep-2 cells are lightened and display different colors when excited under different channels, which roots in the excitation dependent luminescence of the synthesized CNPs. The control cells incubated in the absence of CNPs are nearly dark. The relative fluorescence intensities of Hep-2 cells before and after the incubation of CNPs were analyzed by Image J software. It was found that the fluorescence intensities of Hep-2 cells incubated with CNPs are much higher than that without the CNPs (Fig. S10 in supporting information). In addition, there is no reduction in the fluorescence intensity even after excitation for a prolonged time. These results suggest that the CNPs remain intense PL emission after being internalized into the cells, and have great application potential in bioimaging and biosensing.

|
Download:
|
| Fig. 4. Optical images of Hep-2 cells incubated in the presence of CNPs (a-d) and the absence (e-h) of CNPs. Hep-2 cells imaged under bright field (a, e), by excitation at DAPI channel (b, f), GFP457 channel (c, g) and F380 channel (d, h). | |
2.3. Selective Fe3+ detection using CNPs
More interesting, the fluorescence intensity of the as-prepared CNPs decreases with the addition of Fe3+. The dynamic light scattering measurement (Table S1 in supporting information) showed that the hydrodynamic sizes of the CNPs hardly changed after the addition of Fe3+, which suggests that no aggregation occurred. However, the charge on the surface of the CNPs significantly reduced from -18.9 to -7.34 mV. Thus it can be inferred that the main reason of fluorescence quenching is the chelation between Fe3+ and the carboxylate groups on the CNPs surface, which results in the disruption to the radiative recombination of the carboxylate groups on the carbon nanoparticles surface. Meanwhile, the lifetime (Fig. S11 in Supporting information) of the CNPs (0.76 ns) is longer than that of the mixed solution of Fe3+ and CNPs (0.64 ns), implying the quenching process is a dynamic process [14, 41].
In order to acquire better detection sensitivity, some experimental conditions that affect the sensing system, including pH of the reaction buffer and the reaction time are optimized. As stated above, the fluorescence intensity of CNPs is pH-dependent. Therefore, the effect of the pH of the reaction buffer is investigated firstly. The difference of the fluorescence intensity in the absence and presence of Fe3+ is maximum at pH 7.1 (Fig. S12 in Supporting information). Hence, pH 7.1 Tris-HCl (50 mmol/L Tris) is chosen as the optimal buffer for the Fe3+ detection. We also investigated the effect of the reaction time. The fluorescence intensity of CNPs at 381 nm is quenched by ~75% at two minutes after the addition of Fe3+, and keeps stable during the following twenty minutes, indicating that 2 min is enough to complete the reaction between CNPs and Fe3+ (Fig. S13 in Supporting information). This result suggests that the quenching of Fe3+ to fluorescence of CNPs is quite rapid, implying a promising application in fast, stable and convenient detection of Fe3+.
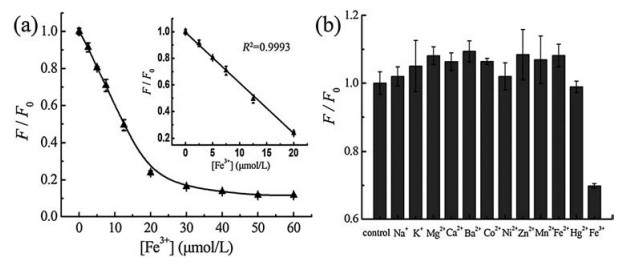
Under the optimized conditions, we evaluated the capability of this analytical system for quantitative detection of Fe3+. Different concentrations of Fe3+ solution were tested to investigate the sensitivity of the proposed strategy. It is apparent that the fluorescence intensity of the CNPs continuously decreases along with increasing the concentration of Fe3+ and trends to be constant after a certain concentration (Fig. S14a in Supporting information). After further addition of ethylenediaminetetraacetic acid disodium salt (EDTA-2Na), the fluorescence recovery could reach to 77.6% of the initial intensity of the unquenched CNPs, indicating that the loss of fluorescence could be recovered by a chelator (Fig. S14b in Supporting information). Fig. 5a shows the relationship between F/F0 (wherein F0 and F are the fluorescence intensity of CNPs in the absence and presence of Fe3+, respectively) and the concentration of Fe3+. The diagram illustrates that F/F0 is linearly dependent on the concentration of Fe3+ from 2.5 to 20 μmol/L. The linear regression equation is F/F0 = 0.999-0.039c (the regression coefficient R2 = 0.999) (the inset of Fig. 5a). The detection limit (3σ) is calculated to be 1.37 μmol/L.

|
Download:
|
| Fig. 5. Investigation of sensitivity and selectivity of Fe3+ detection. a, plots of the change of the fluorescence intensity of CNPs as a function of Fe3+ concentrations. The inset is the linear relationship between the F/F0 and the concentration of Fe3+ from 2.5 to 20 μmol/L, pH = 7.1. b, the selectivity for Fe3+ detection over other metal ions. Concentrations: Fe3+, 12.5 μmol/L; other metal ions, 125 μmol/L. All data were collected at 381 nm. | |
To inspect the specificity of the sensing system for quantifying Fe3+, other metal ions were adopted to substitute Fe3+. Fig. 5b shows that other metal ions hardly quench the fluorescence intensity of CNPs even at 10-fold concentration of Fe3+. Thus, the sensing platform exhibits dominant specificity for Fe3+ over other metal ions. All these results above illustrate the ability of asobtained CNPs for the detection of Fe3+ with high sensitivity and selectivity.
3. ConclusionIn summary, a facile and eco-friendly method has been established to synthesize carbon nanoparticles by using millet powder as precursor. The as-prepared carbon nanoparticles are nitrogen, sulfur co-doped, which substantially improves the emission efficiency of carbon nanoparticles, yielding a quantum yields of 30.4%. The carbon nanoparticles are completely water-soluble and remarkably stable against light illumination and ionic strengths. Meanwhile, they could serve as new fluorescent probes for Fe3+ sensing and bioimaging owing to the strong fluorescence and low cytotoxicity.
4. Experimental 4.1. Synthesis of the fluorescent CNPsThe CNPs were synthesized by mixing 0.01 g millet powder with 6 mL 0.1 mol/L NaOH aqueous solution in a 25 mL teflon-lined stainless-steel autoclave and heating at 180 ℃ for 3 h. Then, the autoclave was cooled to room temperature naturally. Next, the aqueous solution was centrifuged at 12, 000 rpm for 15 min to remove the non-fluorescent precipitate. The residual NaOH was removed through dialysis (1000 MWCO). CNPs were then concentrated by freeze (-80 ℃) and dried under vacuum. The solid-state CNPs were dissolved in water with the concentrations of 2 mg/mL for further use.
4.2. Cytotoxicity investigationThe 2×10⁶ cells per mL of Human epidermoid cancer cells (Hep-2) in Roswell Park Memorial Institute 1640 (RPMI 1640) supplemented with 10% fetal bovine serum were added to each well of a 96-well plate (100 μL/well). The cells were cultured first for 24 h in an incubator (37 ℃, 5% CO2), and for another 24 h after the culture medium was replaced with 100 μL of RPMI 1640 containing the as-prepared CNPs. The final concentrations of CNPs in culture medium were 0, 12.5, 25, 50, 100, 200 μg/mL. Then, followed by removing the culture medium, each well was washed with PBS buffer twice. At last, 10 μL of Cell Counting Kit-8 (CCK-8) solution and 90 μL RPMI 1640 were added to each cell well. The cells were further incubated for 1 h. The optical density (OD) of the mixture was measured at 450 nm with a Microplate Reader Model. The cell viability was estimated according to the following equation:
Cell viability [%] = (ODtreated/ODcontrol)×100
Where ODcontrol was obtained in the absence of CNPs, and ODtreated was obtained in the presence of CNPs.
4.3. Intracellular uptake experimentThe Hep-2 cells in RPMI 1640 supplemented with 10% fetal bovine serum were added to each well of a 24-well plate (300 μL/ well). The cells were cultured first for 24 h in an incubator (37 ℃, 5% CO2), and for another 24 h after the culture medium was replaced with 270μL of RPMI 1640 containing 30 μL CNPs (at the concentration of 1 mg/mL). At last, followed by removing the culture medium, each well was washed with PBS buffer three times. Then the cells were fixed with 4% paraformaldehyde for 30 min, and mounted with glycerol on microscope slide for imaging.
4.4. Apparatus and characterizationThe Fluorescence and UV-vis spectra were obtained with an F-2500 fluorescence spectrophotometer (Hitachi, Tokyo, Japan) and a UV-3600 spectrophotometer (Hitachi, Tokyo, Japan), respectively. The morphology of the CNPs was analysed by the high resolution transmission electron microscopy (HRTEM) (Tecnai G2 F20 STWIN, FEI Company, USA) with an accelerating voltage of 200 KV. Zeta potentials of the CNPs solution were measured by Zetasizer Nano-ZS90 instrument (Malvern, U.K.) at 25 ℃. Elemental and functional groups analyses were investigated by ESCALAB 250Xi Xray photoelectron spectrometer (Thermo Fisher Scientific, USA) and FTIR-8400S Fourier transform infrared spectrometer (Tokyo, Japan) respectively. The fluorescence life time was measured with FL-TCSPC fluorescence spectrophotometer (Horiba Jobin Yvon Inc., France). Living cell imaging was performed under a DSU living-cell confocal microscope (Olympus, Japan) system.
AcknowledgmentsWe are greatly grateful to the financial supports of the National Natural Science Foundation of China (No. 21535006) and the Fundamental Research Funds for the Central Universities (No. XDJK2015B029).
Appendix A. Supplementary dataSupplementary data associated with this article can be found, in the online version, at http://dx.doi.org/10.1016/j.cclet.2017.03.022.
| [1] | Y. Deng, D. Zhao, X. Chen, et al., Long lifetime pure organic phosphorescence based on water soluble carbon dots. Chem. Commun. 49 (2013) 5751–5753. DOI:10.1039/c3cc42600a |
| [2] | X. Wang, L. Cao, F. Lu, et al., Photoinduced electron transfers with carbon dots. Chem. Commun. (2009) 3774–3776. |
| [3] | S. Zhu, Q. Meng, L. Wang, et al., Highly photoluminescent carbon dots for multicolor patterning sensors, and bioimaging. Angew. Chem. Int. Ed. 52 (2013) 3953–3957. DOI:10.1002/anie.v52.14 |
| [4] | L. Cao, X. Wang, M.J. Meziani, et al., Carbon dots for multiphoton bioimaging. J. Am. Chem. Soc. 129 (2007) 11318–11319. DOI:10.1021/ja073527l |
| [5] | Z.A. Qiao, Y. Wang, Y. Gao, et al., Commercially activated carbon as the source for producing multicolor photoluminescent carbon dots by chemical oxidation. Chem. Commun. 46 (2010) 8812–8814. DOI:10.1039/c0cc02724c |
| [6] | P.C. Chen, Y.N. Chen, P.C. Hsu, C.C. Shih, H.T. Chang. Photoluminescent organosilane-functionalized carbon dots as temperature probes. Chem. Commun. 49 (2013) 1639–1641. DOI:10.1039/c3cc38486a |
| [7] | Y.P. Sun, B. Zhou, Y. Lin, et al., Quantum-sized carbon dots for bright and colorful photoluminescence. J. Am. Chem. Soc. 128 (2006) 7756–7757. DOI:10.1021/ja062677d |
| [8] | S. Sahu, B. Behera, T.K. Maiti, S. Mohapatra. Simple one-step synthesis of highly luminescent carbon dots from orange juice: application as excellent bioimaging agents. Chem. Commun. 48 (2012) 8835–8837. DOI:10.1039/c2cc33796g |
| [9] | Z.L. Wu, P. Zhang, M.X. Gao, et al., One-pot hydrothermal synthesis of highly luminescent nitrogen-doped amphoteric carbon dots for bioimaging from bombyx mori silk-natural proteins. J. Mater. Chem. B 1 (2013) 2868–2873. DOI:10.1039/c3tb20418a |
| [10] | Y. Fang, S. Guo, D. Li, et al., Easy synthesis and imaging applications of crosslinked green fluorescent hollow carbon nanoparticles. ACS Nano 6 (2012) 400–409. DOI:10.1021/nn2046373 |
| [11] | E.J. Goh, K.S. Kim, Y.R. Kim, et al., Bioimaging of hyaluronic acid derivatives using nanosized carbon dots. Biomacromolecules 13 (2012) 2554–2561. DOI:10.1021/bm300796q |
| [12] | A.B. Bourlinos, A. Bakandritsos, A. Kouloumpis, et al., Gd(Ⅲ)-doped carbon dots as a dual fluorescent-MRI probe. J. Mater. Chem. 22 (2012) 23327–23330. DOI:10.1039/c2jm35592b |
| [13] | K. Qu, J. Wang, J. Ren, X. Qu. Carbon dots prepared by hydrothermal treatment of dopamine as an effective fluorescent sensing platform for the label-free detection of iron(Ⅲ) ions and dopamine. Chem. Eur. J. 19 (2013) 7243–7249. DOI:10.1002/chem.v19.22 |
| [14] | H.X. Zhao, L.Q. Liu, Z.D. Liu, et al., Highly selective detection of phosphate in very complicated matrixes with an off-on fluorescent probe of europiumadjusted carbon dots. Chem. Commun. 47 (2011) 2604–2606. DOI:10.1039/c0cc04399k |
| [15] | X. Xu, R. Ray, Y. Gu, et al., Electrophoretic analysis and purification of fluorescent single-walled carbon nanotube fragments. J. Am. Chem. Soc. 126 (2004) 12736–12737. DOI:10.1021/ja040082h |
| [16] | J. Zhou, C. Booker, R. Li, et al., An electrochemical avenue to blue luminescent nanocrystals from multiwalled carbon nanotubes (MWCNTs). J. Am. Chem. Soc. 129 (2007) 744–745. DOI:10.1021/ja0669070 |
| [17] | R.L. Liu, D. Wu, S. Liu, et al., An aqueous route to multicolor photoluminescent carbon dots using silica spheres as carriers. Angew. Chem. Int. Ed. 48 (2009) 4598–4601. DOI:10.1002/anie.v48:25 |
| [18] | H. Zhu, X. Wang, Y. Li, et al., Microwave synthesis of fluorescent carbon nanoparticles with electrochemiluminescence properties. Chem. Commun. 511 (2009) 5118–5120. |
| [19] | W. Li, Z. Zhang, B. Kong, et al., Simple and green synthesis of nitrogen-doped photoluminescent carbonaceous nanospheres for bioimaging. Angew. Chem. Int. Ed. 52 (2013) 8151–8155. DOI:10.1002/anie.v52.31 |
| [20] | X. Wang, L. Cao, S.T. Yang, et al., Bandgap-like strong fluorescence in functionalized carbon nanoparticles. Angew. Chem. 122 (2010) 5438–5442. DOI:10.1002/ange.v122:31 |
| [21] | Y. Dong, H. Pang, H.B. Yang, et al., Carbon-based dots co-doped with nitrogen and sulfur for high quantum yield and excitation-independent emission. Angew. Chem. Int. Ed. 52 (2013) 7800–7804. DOI:10.1002/anie.v52.30 |
| [22] | S. Liu, J. Tian, L. Wang, et al., Hydrothermal treatment of grass: a low-cost green route to nitrogen-goped, carbon-rich, photoluminescent polymer nanodots as an effective fluorescent sensing platform for label-free detection of Cu(Ⅱ) ions. Adv. Mater. 24 (2012) 2037–2041. DOI:10.1002/adma.201200164 |
| [23] | Q. Liang, W. Ma, Y. Shi, Z. Li, X. Yang. Easy synthesis of highly fluorescent carbon quantum dots from gelatin and their luminescent properties and applications. Carbon 60 (2013) 421–428. DOI:10.1016/j.carbon.2013.04.055 |
| [24] | J.L. Beard. Iron biology in immune function, muscle metabolism and neuronal functioning. J. Nutr. 131 (2001) 568S–580S. |
| [25] | G. Cairo, A. Pietrangelo. Iron regulatory proteins in pathobiology. Biochem. J. 352 (2000) 241–250. DOI:10.1042/bj3520241 |
| [26] | A.J. Weerasinghe, F.A. Abebe, E. Sinn. Rhodamine based turn-on dual sensor for Fe3+ and Cu2+. Tetrahedron Lett. 52 (2011) 5648–5651. DOI:10.1016/j.tetlet.2011.08.092 |
| [27] | J.A. Ho, H.C. Chang, W.T. Su. DOPA-mediated reduction allows the facile synthesis of fluorescent gold nanoclusters for use as sensing probes for ferric ions. Anal. Chem. 84 (2012) 3246–3253. DOI:10.1021/ac203362g |
| [28] | C.X. Yang, H.B. Ren, X.P. Yan. Fluorescent metal-organic framework MIL-53(Al) for highly selective and sensitive detection of Fe3+ in aqueous solution. Anal. Chem. 85 (2013) 7441–7446. DOI:10.1021/ac401387z |
| [29] | P. Wu, Y. Li, X.P. Yan. CdTe quantum dots (QDs) based kinetic discrimination of Fe2+ and Fe3+, and CdTe QDs-Fenton hybrid system for sensitive photoluminescent detection of Fe2+. Anal. Chem. 81 (2009) 6252–6257. DOI:10.1021/ac900788w |
| [30] | H. Lu, J. Zhang, K. Liu, et al., Earliest domestication of common millet (panicum miliaceum) in east asia extended to 10, 000 years ago. Proc. Natl. Acad. Sci. U. S. A. 106 (2009) 7367–7372. DOI:10.1073/pnas.0900158106 |
| [31] | H. Singh, B. Kumar, R.K. Sharma, G.K. Sharma, R.K. Gautam. Direct and residual effects of sulphur in pearl millet-wheat crop sequence. Ann. Plant Soil Res. 16 (2014) 257–260. |
| [32] | P. Valle-Vigón, M. Sevilla, A.B. Fuertes. Synthesis of uniform mesoporous carbon capsules by carbonization of organosilica nanospheres. Chem. Mater. 22 (2010) 2526–2533. DOI:10.1021/cm100190a |
| [33] | Y. Hu, J. Ge, Y. Sun, T. Zhang, Y. Yin. A self-templated approach to TiO2 microcapsules. Nano Lett. 7 (2007) 1832–1836. DOI:10.1021/nl0708157 |
| [34] | Z.L. Wu, M.X. Gao, T.T. Wang, et al., A general quantitative pH sensor developed with dicyandiamide N-doped high quantum yield graphene quantum dots. Nanoscale 6 (2014) 3868–3874. DOI:10.1039/C3NR06353D |
| [35] | D. Qu, M. Zheng, P. Du, et al., Highly luminescent S, N co-doped graphene quantum dots with broad visible absorption bands for visible light photocatalysts. Nanoscale 5 (2013) 12272–12277. DOI:10.1039/c3nr04402e |
| [36] | M.S. Park, J.S. Yu, K.J. Kim, et al., One-step synthesis of a sulfur-impregnated graphene cathode for lithium-sulfur batteries. Phys. Chem. Chem. Phys. 14 (2012) 6796–6804. DOI:10.1039/c2cp40727b |
| [37] | Z. Yang, Z. Yao, G. Li, et al., Sulfur-doped graphene as an efficient metal-free cathode catalyst for oxygen reduction. ACS Nano 6 (2012) 205–211. DOI:10.1021/nn203393d |
| [38] | C.H. Choi, M.W. Chung, S.H. Park, S.I. Woo. Additional doping of phosphorus and/or sulfur into nitrogen-doped carbon for efficient oxygen reduction reaction in acidic media. Phys. Chem. Chem. Phys. 15 (2013) 1802–1805. DOI:10.1039/C2CP44147K |
| [39] | Q.L. Zhao, Z.L. Zhang, B.H. Huang, et al., Facile preparation of low cytotoxicity fluorescent carbon nanocrystals by electrooxidation of graphite. Chem. Commun. (2008) 5116–5118. |
| [40] | J. Zhou, Y. Yang, C. Zhang. A low-temperature solid-phase method to synthesize highly fluorescent carbon nitride dots with tunable emission. Chem. Commun. 49 (2013) 8605–8607. DOI:10.1039/c3cc42266f |
| [41] | M. Valero, M.P. López-Cornejo, S.M.B. Costa. Effect of the structure and concentration of cyclodextrins in the quenching process of naproxen. J. Photochem. Photobiol. A: Chem. 188 (2007) 5–11. DOI:10.1016/j.jphotochem.2006.11.011 |