 2017, Vol. 28


Methylene blue (MB) is one of the most common cationic dyes that is widely used as a chemical indicator, biological stain and aquaculture fungicide [1, 2]. In spite of its extensive applications in various fields, it has been reported that exposure to large doses of MB can cause some harmful effects [3]. Therefore, the quantitative determination of MB has become increasingly important. Several methods have been reported for the determination of MB including high performance liquid chromatography (HPLC) [4, 5], electrochemistry [6], capillary electrophoresis [7], chemiluminescence [8] and spectrophotometry [9]. Another analytical method gaining importance is RLS, which is characterized by its high sensitivity, simple setup and convenient operation. Thus, RLS has been widely applied for the determination of different analytes including inorganic ions, organic compounds, biomacromolecules and pharmaceuticals [10-15].
In recent years, RLS methods using gold/silver nanoparticles as probes for the determination of organic compounds have been reported [16-19], where the RLS is increased by the analytes through either aggregation of existing nanoparticles or formation of new nanoparticles. Some recent examples include the RLS determination of salmeterol xinafoate [20], ethion [21], thiamazole [22] and raloxifene [23]. In addition, Li et al. [24] investigated the interaction between MB/TiO2 nanocomposites and bovine serum albumin by RLS. SiO2NPs are an interesting class of inorganic nonmetallic materials which exhibit many special physicochemical properties and have been extensively explored for a variety of applications [25-27]. The use of SiO2NPs as probe for the determination of MB by RLS technique has not been reported so far.
In this paper, a simple and novel method for the determination of MB using SiO2NPs as probe was established. The proposed method was based on that the added MB could enhance the RLS intensity of the SiO2NPs in aqueous solutions. Optimum conditions for the determination of MB were investigated and the related mechanisms were also considered. The proposed method has been used for the analysis of MB in aquaculture and water samples with satisfactory results.
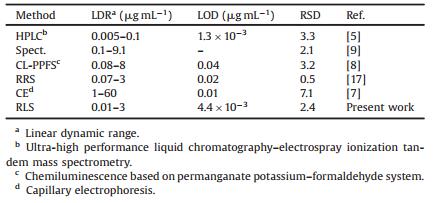
2. Results and discussion 2.1. Absorption spectraThe absorption spectra of SiO2NPs, MB and SiO2NPs-MB are displayed in Fig. 1. Four absorption peaks at 664 nm, 611 nm, 291 nm and 246 nm were observed for MB (Fig. 1, curve a), while there was no absorption peak for the SiO2NPs dispersion (Fig. 1, curve b). The absorption of MB was decreased when SiO2NPs was added (Fig. 1, curve c). In particular, the presence of SiO2NPs causes a significant reduction in the absorption intensity (A) at 664 nm (A decreases from 0.918 to 0.647). This phenomenon might be due to the fact that MB gets adsorbed on the surface of SiO2NPs to form SiO2NPs-MB aggregates, which lowers the concentration of MB in the solution.

|
Download:
|
| Figure 1. Absorption spectra of (a) MB; (b) SiO2NPs; and (c) SiO2NPs + MB. Conditions: MB, 5.0 mg mL-1; SiO2NPs, 0.002%; pH 10.0. | |
2.2. RLS spectra
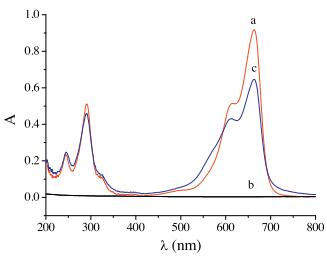
Fig. 2 illustrates the RLS spectra of SiO2NPs, MB and SiO2NPs-MB at pH 10. The RLS intensity of MB was relatively weak in the wavelength range of 250-700 nm, as well as that of the SiO2NPs. However, with the addition of MB to SiO2NPs, the RLS intensity, characterized by a maximum peak signal at 370.0 nm, was enhanced significantly. Moreover, the RLS intensity increased linearly with increase in the MB amount. Therefore, the concentration of MB could be determined by RLS technique using SiO2NPs as probe.

|
Download:
|
| Figure 2. RLS spectra of (a) MB, 3.0 μg mL-1; (b-e) SiO2NPs + MB. Conditions: SiO2NPs, 0.002%; MB (b-e) (μg mL-1), 0, 0.5, 1.0 and 2.0; pH 10.0. | |
2.3. TEM images of SiO2NPs and SiO2NPs-MB
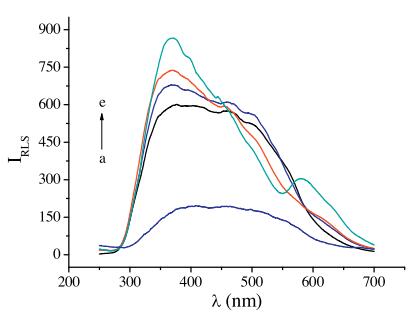
The TEM images of SiO2NPs and SiO2NPs-MB are shown in Fig. 3. The average diameters of the SiO2NPs in the dispersion were found to be about 100 nm (Fig. 3A). When the SiO2NPs reacted with MB under the optimal conditions, the aggregation of MB with the SiO2NPs not only increased the size of the nanoparticles, but also changed their shape. The SiO2NPs-MB aggregates exhibit the network structure as shown in Fig. 3B.

|
Download:
|
| Figure 3. Transmission electron microscope images of SiO2NPs dispersion (A) and SiO2NPs-MB system (B). Conditions: SiO2NPs, 0.002%; MB, 3.0 μg mL-1; pH 10.0. | |
2.4. Effects of pH and buffer
The pH value played a very important role in the interaction between SiO2NPs and MB. Therefore, the influence of pH on △IRLS was investigated with two common buffer solutions in the pH range 9.0-11.0, and the results are shown in Fig. 4. It can be seen that the BR buffer solution was better than NH3-NH4Cl, and the △IRLS of the solution depended greatly on the pH value. △IRLS increased sharply when the pH increased from 9.0 to 10.0, and then it remained constant with the further increase in pH above 10.0.

|
Download:
|
| Figure 4. Effects of pH and buffer solutions on △IRLS. Conditions: SiO2NPs, 0.002%; MB, 1.0 μg mL-1. | |
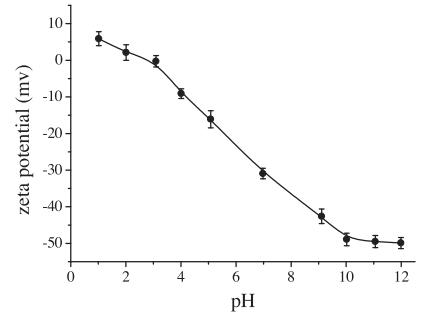
Zeta potential of the SiO2NPs dispersion was measured to detect the changes in the SiO2NPs surface charges and the results are shown in Fig. 5. Zeta potential decreased remarkably with the increase in pH value and it remained constant at pH above 10.0, which was in accordance with the results of pH studies. Therefore, pH 10.0 with BR buffer solution was chosen for further research.

|
Download:
|
| Figure 5. Zeta-potential versus pH curve for SiO2NPs dispersion. Conditions: SiO2NPs, 0.002%. The pH of test solution was adjusted with BR buffer. | |
2.5. Effect of reaction time and temperature
The effect of reaction time and temperature were tested by equilibrating 1.0 μg mL-1 MB and 0.002% SiO2NPs at pH 10.0 under different reaction times and temperatures, respectively. As shown in Fig. 6, △IRLS reached the maximum value at 8.0 min and remained stable for 2.0 h. The ideal temperature range was found to be 5-35 ℃. When the temperature was higher than 35 ℃, the △IRLS decreased due to the increase in thermal motion of the particles resulting in unfavorable reaction of SiO2NPs with MB. Therefore, room temperature and 8.0 min of reaction time were chosen for this experiment.

|
Download:
|
| Figure 6. Effect of reaction time (A) and temperature (B) on △IRLS. Conditions: SiO2NPs, 0.002%; MB, 1.0 μg mL-1; pH 10.0. | |
2.6. Effect of the concentration of SiO2NPs
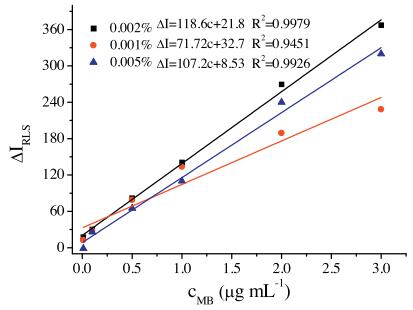
The effect of the concentration of SiO2NPs on △IRLS was studied. The linear regression equation and R2 were given in Fig. 7. If the concentration of SiO2NPs was lower than 0.002%, the linear range was relatively narrow due to the incompletion of the interaction of SiO2NPs with MB. If the concentration of SiO2NPs was higher than 0.002%, the reagent blank increased, and the linear range reduced. Hence, 0.002% was chosen for this experiment as a suitable SiO2NPs concentration.

|
Download:
|
| Figure 7. Effect of SiO2NPs concentration on △IRLS. Conditions: pH 10.0. | |
2.7. Effect of ionic strength
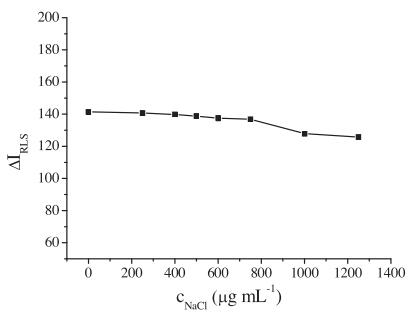
The effect of ionic strength on RLS enhancement was examined by adding different amounts of NaCl into the SiO2NPs-MB solution (Fig. 8). The results indicated that when the concentration of NaCl was less than 850.0 μg mL-1, △IRLS remained constant. However, the △IRLS value decreased with continued increase in the concentration of NaCl. This might be due to the shielding effect and the competing effect of Cl- and Na+ on the binding process between MB and SiO2NPs.

|
Download:
|
| Figure 8. Effect of NaCl concentration on △IRLS. Conditions: SiO2NPs, 0.002%; MB, 1.0 μg mL-1; pH 10.0. | |
2.8. Effect of coexisting substances
Underthe optimalconditions, variouscoexisting substanceswere examined for any interference on the determination of 0.5 μg mL-1 of MB. The permitted relative deviation from the △IRLS value was ±5%. The experimental results are summarized in Table 1. It can be seen that most of the coexisting substances did not interfere with the determination of MB. Only the Mg2+ and Ca2+ ions showed interference with the MB determination at low concentrations. In order to eliminate the interference of Mg2+ and Ca2+, 1.0 mL of the chelating agent ethylene diamine tetraacetic acid (EDTA) (100.0 μg mL-1) was added.
|
|
Table 1 Interferences of coexisting substances ([MB]=0.5 μg mL-1). |

3. Mechanism of reaction and RLS enhancement 3.1. Interaction of SiO2NPs with MB
Under optimum pH conditions, the hydroxyl groups on the SiO2NPs surface dissociated leading to a negative zeta potential, thus the surfaces of the SiO2NPs were electronegative. The mechanism of interaction might be adsorption of the cationic dye MB on the electronegative surface of SiO2NPs due to electrostatic attraction.The shape of the new particles was different from thatof the SiO2NPs and they were aggregated together by hydrophobic effect to form an inhomogeneous cluster which was significantly larger than the SiO2NPs. Overall, the combination of MB with the SiO2NPs increased the size of the nanoparticles, and also changed their apparent shape. The schematic diagram of the reaction is presented in Fig. 9.

|
Download:
|
| Figure 9. Schematic illustration of possible procedure for the detection of MB. | |
3.2. Mechanism of the RLS intensity enhancement
According to the Rayleigh scattering theory [28, 29], the RLS properties are closely related to the molecular volume and morphology of the particles. The greater the molecular volume, the higher the RLS intensity can be obtained. The RLS intensities of SiO2NPs and MB were very weak due to their small particle volumes. When electronegative SiO2NPs interacted with cationic MB by electrostatic and hydrophobic interactions to form aggregates, the particle volumes increased (Fig. 9), and resulted in the enhancement of RLS intensity.
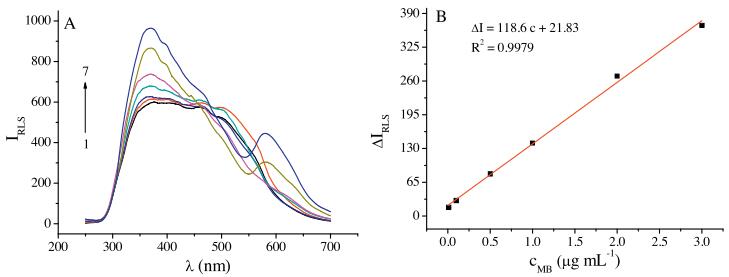
4. Analytical applications 4.1. Calibration curve and detection limitUnder the optimal conditions, the RLS intensity of the solution was measured at 370.0 nm and the results are shown in Fig. 10. The RLS intensity increased with the increase in MB concentration. There was a good linear relationship between the △IRLS and the concentration of MB over the range of 0.01-3.0 μg mL-1. The regression equation was △IRLS = 118.6c + 21.83 (c, μg mL-1) with R2 of 0.9979. The limit of detection (LOD) was as low as 4.36 ng mL-1.

|
Download:
|
| Figure 10. The RLS spectra of SiO2NPs-MB system (A). Calibration curve of the corresponding SiO2NPs-MB system (B). Conditions: SiO2NPs, 0.002%; pH 10.0; MB (μg mL-1): (1- 7) 0, 0.01, 0.1, 0.5, 1.0, 2.0 and 3.0. | |
4.2. Determination of samples
To validate the applicability of this method, the developed procedure was applied for the determination of MB in aquaculture samples. Recovery tests were used to examine the reliability and accuracy of the method. Standard amounts of MB were added into the samples, and MB content of each sample was determined at the optimized conditions. In addition, the determination results were compared with the results from the standard method [30], through the t-test analysis. There was no significant difference between the proposed and standard methods under the confidence level of 95%. All the determination results for samples are listed in Tables 2 and 3. The recoveries were between 96.3% and 107% and relative standard deviation (RSD) was 2.4% (n = 6).
|
|
Table 2 Results of determination of MB in fungicides (n = 6). |

|
|
Table 3 Results of determination of MB in water samples (n = 6). |

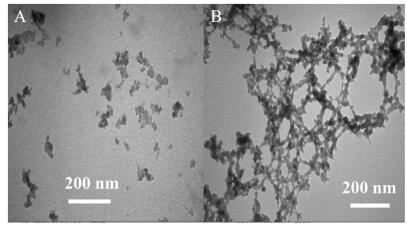
Furthermore, this method was also compared against some of the other reported methods for MB determination including HPLC, spectroscopy, capillary electrophoresis, etc. The comparison is shown in Table 4 and it can be seen that the proposed RLS method has better sensitivity than most of the other methods.
|
|
Table 4 Comparison of this work (RLS) with some of the other reported methods for MB determination. |
Overall, it is evident from the above results and analyses that this method for the determination of MB is reliable, sensitive and efficient.
5. ConclusionsIn this paper, a simple and novel resonance light scattering method was developed based on the increase in scattered light from the SiO2NPs after the addition of MB. The mechanism of the enhancement of RLS was discussed and the effects of the key experimental parameters on the enhancement of RLS intensity were studied in detail. The proposed method allows the direct determination of MB with very good accuracy, sensitivity and tolerance. MB can be measured in a short time without any complicated or timeconsuming sample pretreatment processes. Compared with other reportedmethods, the proposed method is more sensitive, rapid and environmentally friendly. The method was successfully applied for the determination of MB in water and aquaculture samples.
6. Experimental 6.1. Materials and reagentsMB was purchased from Sinopharm Chemical Reagent Co., Ltd. (China) and was used to prepare a 1000.0 μg mL-1 stock solution. The working solutions were prepared by diluting the stock solution to 10.0 μg mL-1. Silica nanoparticles were purchased from Changqing Chemical Reagent Company (China). Acetic acid, boric acid, phosphoric acid and sodium hydroxide were purchased from Xi'an Chemical Reagent Factory (Xi'an, China). The Britton- Robinson (BR) buffer solution was prepared by mixing 0.04 mol L-1 acetic acid, 0.04 mol L-1 boric acid, 0.04 mol L-1 phosphoric acid and 0.2 mol L-1 sodium hydroxide solution in a specific proportion. All chemicals used in the experiments were of analytical grade and used without further purification. Deionized water was used for preparing all the samples and solutions.
6.2. ApparatusThe instruments used in this study were as follows: F-4500 spectrofluoro-photometer (Hitachi, Japan); UV-1700 spectrophotometer (Shimadzu, Japan); H-600 transmission electron microscope (TEM, Hitachi, Japan); DB-525 Zeta Potential Analyzer (Brookhaven, USA); pHs-3C digital pH meter (Shanghai Lei Ci Device Works, China) with a glass electrode (Model E-201-C); and magnetic stirrer (Gongyi Yuhua Instrument Factory, China).
6.3. Preparation of SiO2NPs dispersionExactly 0.2 g of SiO2NPs was weighed out and added into 200.0 mL of deionized water under vigorous stirring, and then the mixture was placed in an ultrasonic bath for 30 min to completely disperse the SiO2NPs at room temperature. The SiO2 concentration of the dispersion was 0.1%.
6.4. Preparation of samplesCommercial fungicide samples (both solid and liquid) were obtained from a local supermarket in Xi'an, China. Prior to determination, 10.0 mg of the solid sample was dissolved in 100.0 mL of deionized water. Then, 10.0 mL of the solution was pipetted into a 25.0 mL volumetric flask for analysis. For the liquid samples, 1.0 mL was placed into a 100.0 mL volumetric flask and diluted to the mark with deionized water. Then 5.0 mL of the above solution was pipetted into a 25.0 mL volumetric flask. The concentrations of MB were determined according to the general procedure described in the next section.
Water samples were collected from the local aquarium. Prior to use, the water samples were filtered to remove the suspended solids. Then, 10.0 mL of the sample and 1.0 mL of 100.0 μg mL-1 EDTA were pipetted into a 25.0 mL volumetric flask mixed thoroughly and diluted to the mark with deionized water. The concentrations of MB were determined according to the general procedure described below.
6.5. General procedureThe general procedure for determination of MB by RLS is as follows: 0.5 mL of 0.1% SiO2NPs dispersion, 1.0 mL of BR buffer solution (pH 10.0) and a certain amount of MB standard solution was added into a 25.0 mL volumetric flask. The mixture was diluted to the mark with deionized water and allowed to stand for 8.0 min. The RLS spectra of the solutions were recorded by synchronously scanning the excitation and emission monochromators (△λ= 0 nm) from 250.0 to 700.0 nm. Slit widths of excitation and emission beams were kept at 2.5 nm and 5.0 nm, respectively. The RLS intensity of the solution was measured at 370.0 nm. The enhanced RLS intensities of the solutions were calculated by the following equation: △IRLS=IRLS-I°RLS (where, I°RLS and IRLS are the RLS intensities of the SiO2NPs in the absence and presence of MB). All the experiments were carried out at room temperature.
| [1] | Xu Y.J., Tian X.H., Zhang X.Z., et al., Simultaneous determination of malachite green crystal violet, methylene blue and the metabolite residues in aquatic products by ultra-performance liquid chromatography with electrospray ionization tandem mass spectrometry. J. Chromatogr. Sci. 50 (2012) 591–597. DOI:10.1093/chromsci/bms054 |
| [2] | Asfaram A., Ghaedi M.. Simultaneous determination of cationic dyes in water samples with dispersive liquid-liquid microextraction followed by spectrophotometry:experimental design methodology. New J. Chem. 40 (2016) 4793–4802. DOI:10.1039/C5NJ02912K |
| [3] | Peter C., Hongwan D., Küpfer A., Lauterburg B.H.. Pharmacokinetics and organ distribution of intravenous and oral methylene blue. Eur. J. Clin. Pharmacol. 56 (2000) 247–250. DOI:10.1007/s002280000124 |
| [4] | Memon S., Memon F.N., Durmaz F., et al., Simultaneous determination of some basic dyes using p-tetranitrocalix. Anal. Methods 6 (2014) 7318–7323. DOI:10.1039/C4AY01046A |
| [5] | Cui J., Yang H.S., Zhang J.H., Wu G.H.. Determination of methylene blue and its metabolites in aquatic products by UPLC/ESI-MS/MS. South China Fish. Sci. 9 (2013) 67–73. |
| [6] | Li J.W., Zhao F.Q., Zhao J., Zeng B.Z.. Adsorptive and stripping behavior of methylene blue at gold electrodes in the presence of cationic gemini surfactants. Electrochim. Acta 51 (2005) 297–303. DOI:10.1016/j.electacta.2005.04.024 |
| [7] | Borwitzky H., Haefeli W.E., Burhenne J.. Analysis of methylene blue in human urine by capillary electrophoresis. J. Chromatogr. B 826 (2005) 244–251. DOI:10.1016/j.jchromb.2005.09.013 |
| [8] | Fan C.L., Huang Y.M.. Fast determination of methylene blue by chemiluminescence based on permanganate potassium-formaldehyds system. J. Southwest China Normal Univ. (Nat. Sci.) 30 (2005) 104–107. |
| [9] | Bélaz-David N., Decosterd L.A., Appenzeller M., et al., Spectrophotometric determination of methylene blue in biological fluids after ion-pair extraction and evidence of its adsorption on plastic polymers. Eur. J. Pharm. Sci. 5 (1997) 335–345. DOI:10.1016/S0928-0987(97)00061-4 |
| [10] | Chen M., Cai H.H., Yang F., et al., Highly sensitive detection of chromium(Ⅲ) ions by resonance Rayleigh scattering enhanced by gold nanoparticles. Spectrochim. Acta A 118 (2014) 776–781. DOI:10.1016/j.saa.2013.09.058 |
| [11] | Chen H.Q., Luo F.B., Liu Y., et al., Application of functional CdS nanoparticles in determination of silver ion by resonance light-scattering technique. Spectrochim. Acta A 71 (2009) 1701–1703. DOI:10.1016/j.saa.2008.06.026 |
| [12] | Li Q., Tan X.P., Zheng X.B., Tang W.W., Yang J.D.. A novel method for the determination of fast green in grape wine based on resonance Rayleigh scattering. J. Mol. Struct. 1100 (2015) 14–20. DOI:10.1016/j.molstruc.2015.05.044 |
| [13] | Yu L., Zhang Y.T., Chen R., et al., A highly sensitive resonance light scattering probe for Alzheimer's amyloid-b peptide based on Fe3O4@Au composites. Talanta 131 (2015) 475–479. DOI:10.1016/j.talanta.2014.07.067 |
| [14] | Xiang H.Y., Dai K.J., Luo Q.Z., Duan W.J., Xie Y.. A sensitive resveratrol assay with a simple probe methylene blue by resonance light scattering technique. Spectrochim. Acta A 78 (2011) 307–312. DOI:10.1016/j.saa.2010.10.011 |
| [15] | Liu J.T., Liu Z.F., Hu X.L., Kong L., Liu S.P.. A highly sensitive resonance Rayleigh scattering method for the determination of bleomycinA5 and bleomycinA2 with some halofluorescein dyes. J. Pharm. Biomed. Anal. 43 (2007) 1452–1459. DOI:10.1016/j.jpba.2006.11.024 |
| [16] | Bi S.Y., Wang Y., Zhou H.F., Zhao T.T.. Assembly of AuNRs and eugenol for trace analysis of eugenol using resonance light scattering technique. Mater. Sci. Eng. 58 (2016) 1001–1007. DOI:10.1016/j.msec.2015.09.051 |
| [17] | Lu Q.M., He Y.Q., Liu S.P., Liu Z.F.. Resonance Rayleigh scattering spectral method for determination of methylene blue with gold nanoparticle as probe. Chem. J. Chin. Univ. 27 (2006) 849–852. |
| [18] | Parham H., Pourreza N., Marahel F.. Resonance Rayleigh scattering method for determination of 2-mercaptobenzothiazole using gold nanoparticles probe. Spectrochim. Acta A 151 (2015) 308–314. DOI:10.1016/j.saa.2015.06.108 |
| [19] | Parham H., Pourreza N., Marahel F.. Determination of thiram using gold nanoparticles and resonance Rayleigh scattering method. Talanta 141 (2015) 143–149. DOI:10.1016/j.talanta.2015.03.061 |
| [20] | Bi S.Y., Wang T.J., Wang Y., Zhao T.T., Zhou H.F.. Using gold nanoparticles as probe for detection of salmeterol xinafoate by resonance Rayleigh light scattering. Spectrochim. Acta A 135 (2015) 1074–1079. DOI:10.1016/j.saa.2014.08.010 |
| [21] | Parham H., Saeed S.. Resonance Rayleigh scattering method for determination of ethion using silver nanoparticles as probe. Talanta 131 (2015) 570–576. DOI:10.1016/j.talanta.2014.08.007 |
| [22] | Liu X.L., Yuan H., Pang D.W., Cai R.X.. Resonance light scattering spectroscopy study of interaction between gold colloid and thiamazole and its analytical application. Spectrochim. Acta A 60 (2004) 385–389. DOI:10.1016/S1386-1425(03)00235-X |
| [23] | Liu S.P., He Y.Q., Liu Z.F., Kong L., Lu Q.M.. Resonance Rayleigh scattering spectral method for the determination of raloxifene using gold nanoparticle as a probe. Anal. Chim. Acta 598 (2007) 304–311. DOI:10.1016/j.aca.2007.06.054 |
| [24] | Li Y.S., Zhang Y., Sun S.F., Zhang A.Q.. Yi Liu, Binding investigation on the interaction between methylene blue (MB)/TiO2 nanocomposites and bovine serum albumin by resonance light-scattering (RLS) technique and fluorescence spectroscopy. J. Photochem. Photobiol. B 128 (2013) 12–19. DOI:10.1016/j.jphotobiol.2013.07.027 |
| [25] | Hemadi A., Ekrami A., Oormazdi H., et al., Bioconjugated fluorescent silica nanoparticles for the rapid detection of Entamoeba histolytica. Acta Trop. 145 (2015) 26–30. DOI:10.1016/j.actatropica.2015.02.008 |
| [26] | Cai L., Chen Z.Z., Dong X.M., Tang H.W., Pang D.W.. Silica nanoparticles based label-free aptamer hybridization for ATP detection using hoechst33258 as the signal reporter. Biosens. Bioelectron. 29 (2011) 46–52. DOI:10.1016/j.bios.2011.07.064 |
| [27] | O'Farrell N., Houlton A., Horrocks B.R.. Silicon nanoparticles:applications in cell biology and medicine. Int. J. Nanomed. 1 (2006) 451–472. DOI:10.2147/nano.2006.1.issue-4 |
| [28] | Anglister J., Steinberg I.Z.. Resonance Rayleigh scattering of cyanine dyes in solution. J. Chem. Phys. 78 (1983) 5358–5368. DOI:10.1063/1.445489 |
| [29] | Liu Y., Ma C.Q., Li K.A., Xie F.C., Tong S.Y.. Rayleigh light scattering study on the reaction of nucleic acids and methyl violet. Anal. Biochem. 268 (1999) 187–192. DOI:10.1006/abio.1998.3012 |
| [30] | Chinese Pharmacopoeia Commission, Pharmacopoeia of the People's Republic of China, Part Ⅱ, China Medical Science Press, Beijing, 2015. |