 2017, Vol. 28


b Key Laboratory of Advanced Materials (MOE), Department of Chemical Engineering, Tsinghua University, Beijing 100084, China
Noncovalent complexation of guest polymers and host small molecules has provided a unique and effective way to exploit different applications in material science. It has received increasing attention in many fields, including polymer fractionation, chiral recognition, nucleating agent, pharmacy decoration, nonlinear optics and battery material [1-6]. Usually, the complex is prepared from two components, polymer and small molecule. Polymer chains are intercalated in small molecular clathrates. The interaction between guest and host molecules is van der Waals forces and/ or hydrogen bonds [7]. Therefore, it would be interesting to see if the ternary complex can be fabricated from a polymer with two kinds of small molecules or two kinds of polymers with a small molecule, which should deepen our understanding of crystal engineering and supramolecular system.
Poly (ethylene oxide) (PEO) has been widely employed as guest polymer to prepare complex with various host molecules. Especially, it had been reported that PEO can form complex with urea (U) and thiourea (TU) with the same molar stoichiometry (3:2) and both PEO/U and PEO/TU complexes with such 3:2 molar stoichiometry adopt similar layered crystal structure [8-10]. The PEO/U complex with EO/urea molar ratio as 3:2 has also been named as β-form crystal, which is used to differentiate from the PEO/U α-form crystal with EO/urea molar ratio as 4:9 [9]. Due to the analogue of urea and thiourea, it is expected that PEO could form complex with the mixture of urea and thiourea host molecules. Thus, in this study PEO/U/TU complexes were prepared through co-solution electrospinning method by keeping guest/ host molar ratio as 3:2, and various methods were used to demonstrate the formation of novel ternary PEO/U/TU complex.
2. Results and discussionThermal analysis of different samples via differential scanning calorimeter (DSC) is presented in Fig. 1A. The melting point (Tm) of as-electrospun PEO/U complex is 82.6 ℃. After substituting part of urea by thiourea, the Tm value of PEO/U/TU ternary complex monotonically increases with the increasing thiourea content and finally reaches 109.4 ℃ for PEO/TU complex, as shown in Fig. 1B. The single Tm value of each sample and the monotonic dependence of Tm on thiourea molar content indicate the formation of cocrystals of PEO, urea and thiourea (If linearly fitted, the slope is 0.25 ℃/mol% TU and R2 is 0.924), which is a general character of polymeric isomorphism phenomenon [12, 13]. According to previous studies, the other melting peaks (Tm, 1, Tm, 2 and Tm, 3) are attributed to melting of the newly-formed phases during heating process. Tm, 1, Tm, 2 and Tm, 3 are attributed to the melt of newlyformed thiourea crystal, urea crystal and α-form PEO/U inclusion complex, respectively [8-11, 14]. The melting enthalpy of Tm of the ternary complex rises first with increasing thiourea molar content and then levels off at ·115J/g after thiourea content exceeds 40mol%.
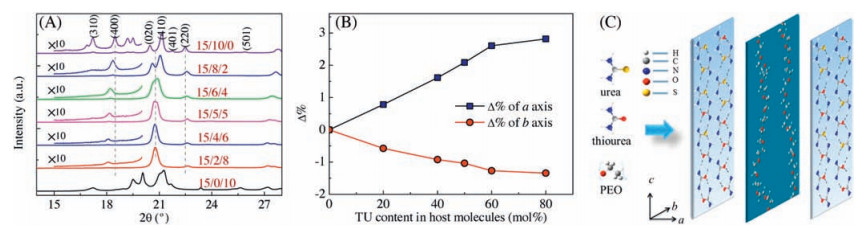
To compare the crystal structures of the ternary complexes, their wide angle X-ray diffractograms are depicted in Fig. 2A. The as-electrospun PEO/U complex belongs to the orthorhombic modification with layered structure [9]. When partial urea is replaced by thiourea, two intriguing variations arise in the X-ray diffractograms of the ternary complexes. First, some diffraction peaks, such as (310), (401), (501) disappear. The missing of diffractionpeaks, especiallyfor all (hkl) (l ≠ 0) planes demonstrates that the thiourea molecules are indeed incorporated in the urea layered structure and interrupt the in-layerperiodicity. Second, the remaining diffraction peaks including (400), (020), (410) and (220) shift gradually with increasing thiourea content. The diffraction peaks of (020) and (410) completely overlap at high thiourea content. The shifting of (400) lattice plane diffraction to lower 2u reveals the expansion of a axis, and the opposite shifting behaviour of (020) lattice plane indicates the shrinkage of b axis. However, when urea molecules are completely replaced by thiourea, PEO/TU displays an obviously different X-ray diffractogram. The reason can be attributed to the change of crystal modification from orthorhombic to monoclinic and the recovery of in-layer periodicity [10]. By adopting the orthorhombic lattice [8, 9], the thiourea content dependent deviations of a and b axes of ternary complexes are compared with PEO/U complex and illustrated in Fig. 2B, which confirms the monotonic increase of a axis and decrease of b axis with more thiourea molecules. Based on the suggesting structure model of PEO/U complex and PEO/TU complex [9, 10], a speculative structure model of PEO/U/TU ternary complex is illustrated in Fig. 2C. The expansion of a axis (perpendicular to the layer of host molecules) and shrinkage of b axis (within the layer of host molecules) are due tothe larger molecular volume of thiourea than urea and the stronger hydrogen bonding interaction of C¼S (in thiourea) than C=O (in urea) with N=H groups, respectively. The gradual variation of the lattice parameters meets the definition of isomorphism in either small molecules or polymers: Substances possessing an analogous composition, which crystallize in the same form (or in similar forms) and are capable of mixing in all proportions [15, 16].

|
Download:
|
| Figure 1. (A) The DSC heating curves of complexes with various EO/U/TU molar ratios at a rate of 10 ℃/min, (B) Dependence of melting enthalpy values and melting points of ternary complexes on the thiourea molar ratios in host molecules. | |

|
Download:
|
| Figure 2. (A) Wide angle X-ray diffractograms of the complexes with various EO/U/TU molar ratios, the crystallographic planes are indicated. (B) Variation degree (Δ%) of the unit cell parameters of host crystal with thiourea molar content in host molecules. (C) is the structural model of ternary complex. | |
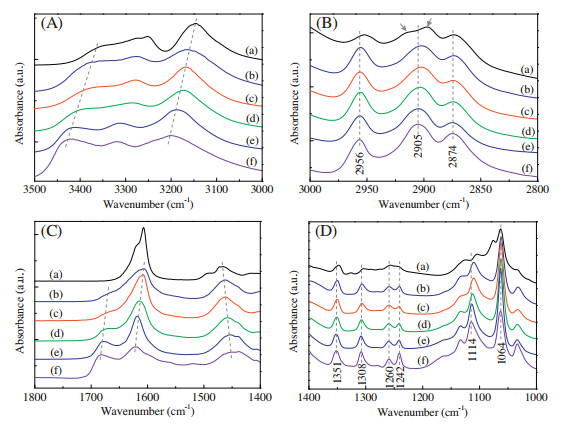
Apart from the crystal structure of host urea and thiourea molecules, the conformation of PEO chains in the complex should also be taken into consideration for isomorphism in ternary complex. Consequently, FTIR spectroscopy was used to investigate the conformation of PEO chains confined by host molecules, as shown in Fig. 3. The main absorption bands of the vibration modes in PEO chains locate at 3000-2800cm-1 and 1400-1000cm-1. All the ternary complexes and PEO/U complex possess almost the same FTIR absorption bands of PEO chains. They show characteristic absorption bands of asymmetric and symmetric stretching vibrations of CH2 groups at 2956, 2905 and 2874cm-1, wagging and twisting vibrations at 1351, 1260, 1242 and 1114cm-1, gauche conformation vibrations of O-CH2-CH2-O at 1308cm-1, and C-O-C stretching vibrations at 1064cm-1 [8, 17, 18]. However, PEO chains in PEO/TU complex exhibit a certain different FTIR spectrum compared with others, e.g., the absorption bands of CH2 groups marked in Fig. 3B. Thus, independent of the changing U/TU molarratios, PEO chainsin the ternarycomplexes possessthe same conformation as those in β-form PEO/U complex, the tgg' conformation [8]. Besides, FTIR can also be employed to explore the crystal structure information of the host molecules by analyzing NH2, C=O and C=S group vibrations. The N-H stretching absorption bands appear in 3500-3000cm-1 region. Especially, the lowest absorptionband at around3200cm-1 is associated with hydrogen bonds in the host crystal lattices. When substituting urea by thiourea in the complex, the N-H stretching bands gradually shift toward lower frequency due to the strengthening of hydrogen bonding interaction. Similar shifting behaviour can be observed in the absorption bands of NH2 bending vibrations between 1700-1600 cm-1. Therefore, the hydrogen bonds should form not only between urea-urea and thiourea-thiourea but also between urea and thiourea molecules. The ternary complexes with EO/U/TU ratios of 15/1/9 and 15/0.5/9.5 also show the similar FTIR spectra as PEO/U. So the same PEO chain conformation and the gradual shifting of the FTIR absorption bands of the host molecules are in accordance with the X-ray diffraction data and support the isomorphism phenomenon in PEO/U/TU complexes. However, the PEO/TU complex is an exception, which does not subject to the changing trend, and is beyond the isomorphism composition range.

|
Download:
|
| Figure 3. FTIR spectra of complexes with various EO/U/TU molar ratios at different wavenumber ranges: (A) 3500–3000 cm-1, (B) 3000–2800 cm-1, (C) 1800–1400 cm-1 and (D) 1400–1000 cm-1. Each spectrum was divided to be shown in four wavenumber ranges for displaying the difference more effectively. (a)–(f) are corresponding to EO/U/TU molar ratios of 15/0/10, 15/2/8, 15/4/6, 15/6/4, 15/8/2 and 15/10/0, respectively | |
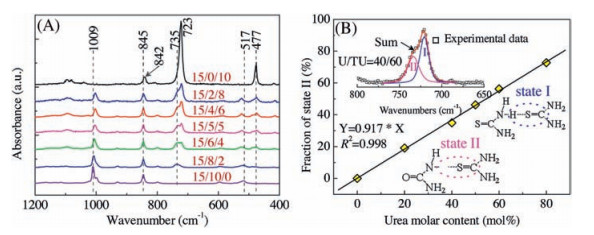
To further confirm the structure information of ternary complexes, their Raman scattering spectra were collected and depicted in Fig. 4A. The same backbone vibration band of PEO at 845 cm-1, which is attributed to the rocking band of CH2 groups, can be found in PEO/U complex and all PEO/U/TU ternary complexes. While the characteristic rocking band of CH2 in PEO/ TU is at 842 cm-1. The same absorption band location of CH2 in PEO/U complex and the ternary complexes while the different location between PEO/TU complex and ternary complexes confirms that PEO chains in ternary complex adopt the same conformation as those in PEO/U complex, while different from that in PEO/TU complex. The remarkable absorption band at 1009 cm-1 of PEO/U complex belongs to the N-C-N symmetric stretching mode of host urea molecules and shifts slightly to lower wavenumber direction after gradually replacing urea by thiourea, which is consistent with the slight change of host crystalline lattice and the formation of hydrogen bonds between urea and thiourea.

|
Download:
|
| Figure 4. (A) Raman scattering spectra of complexes with various EO/U/TU molar ratios in the range between 1200–400 cm-1. (B) The relationship between fraction of "state Ⅱ" of C¼S and urea molar content in host molecules. The inserts describe the "state Ⅰ" and "state Ⅱ" of C¼S. | |
The absorption band at 723 cm-1 is attributed to the C=S stretching vibration mode of thiourea molecules. The absorption band is split into two bands at 735 and 723 cm-1 in PEO/U/TU ternary complexes, demonstrating the change of chemical environment surrounding thiourea molecules. The C=S groups would form hydrogen bonds not only with H-N groups of thiourea ("state Ⅱ" in Fig. 4B), but also with H-N groups of urea ("stateⅠ" in Fig. 4B). The strength of hydrogen bonds in "stateⅠ" is weaker than that in "state Ⅱ", resulting in the former band appearing at 735 cm-1 and the latter at 723 cm-1. Such sensitive change of C¼S absorption band provides a direct and precise way to determine the distribution state of host molecules, urea and thiourea in PEO/U/TU ternary complex. Thus, the fractions of C=S groups in "state Ⅰ" and "state Ⅱ" were calculated by deconvoluting the area of overlapping absorption bands of C=S groups. It is intriguing to find thefractionof "stateⅡ" is proportional to the urea molar content in host molecules. Such a proportional relation reveals the random distribution of urea and thiourea molecules in the host lattices, which gives clear evidence that the urea and thiourea molecules are identical in working as the hosts in the ternary complex. With the help of guest PEO chains, urea and thiourea can form molecular level hybrid crystal lattices.
3. ConclusionIn conclusion, this study demonstrates the co-crystallization behaviour of urea, thiourea and PEO and presents the novel isomorphism phenomenon in the ternary complex for the first time. This observation gives a boost to prepare co-crystals of different small molecules that cannot be obtained by direct mixing without the aid of polymer chains. Physical properties (i.e., nonlinear optics) of such co-crystals deserve further study to find potential applications.
4. Experimental 4.1. MaterialsPoly (ethylene oxide) (PEO) with weight-average molecular weight of 400, 000g/mol was purchased from Sigma-Aldrich Company. Urea (melting point is 133 ℃), thiourea (melting point is 176 ℃) and methanol (analytical reagent grade) were obtained from Shanghai Aladdin Industrial Inc.
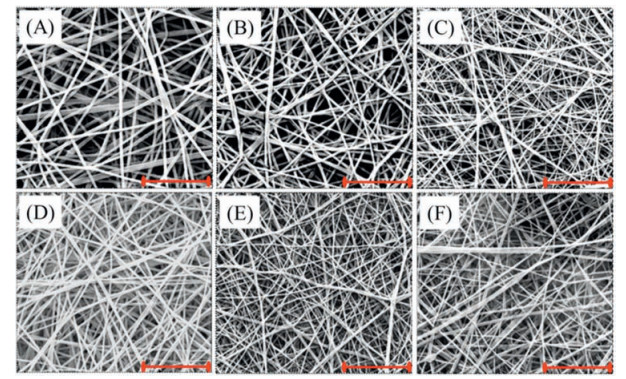
4.2. Sample preparationPEO, urea and thiourea co-solutions were prepared by dissolving 0.5g PEO in 10mL of methanol, then adding an approximate amount of urea and thiourea to obtain the ternary mixtures. The molar ratios of EO/(urea+thiourea) for all the samples were maintained as 3:2, while the urea/thiourea molar ratios were set as 10/0, 8/2, 6/4, 5/5, 4/6, 2/8, 1/9, 0.5/9.5, 0/10. The solutions were introduced to a syringe equipped with a 0.58mm diameter flat-end needle to prepare the complex fiber via electrospinning process under the following conditions: a DC voltage of 20kV, a collector-to-needle tip distance of 18cm. The electrospinning was maintained for about 2hours to obtain an overlaid fiber mat for each sample. The scanning electron microscopy (SEM) morphologies of as-electrospun PEO/U/TU complexes are presented in Fig. 5. All samples display continuous andquiteuniform fiber structurewith averagediametersof around 180nm.

|
Download:
|
| Figure 5. SEM images of the as-electrospun nanofibers with EO/U/TUmolar ratios as (A) 15/10/0, (B) 15/8/2, (C) 15/6/4, (D) 15/4/6, (E) 15/2/8 and (F) 15/0/10. The scale barlength is 5mm. | |
Characterization
The SEM morphology was observed on a Hitachi SU8010 scanning electron microscope with an accelerating voltage of 30kV. The samples were sputter-coated with thin layers of gold before observation. NETZSCH-204F1 calorimeter was utilized for the thermal analysis of samples. Sample about 3.0mg was held in aluminum seal during each process at a heating rate of 10 ℃/min, and indium and zinc standards were used for temperature and enthalpy calibration. Wide angle X-ray measurements were carried out on a Bruker AXS D8 Advance powder diffractometer using Cu Kα (λ=0.154nm) radiation. The 2θ scanning was carried out from 8° to 30° with a step interval of 0.01° at a scanning rate of 2°/min. Fourier transform infrared (FTIR) spectra were recorded on a Bruker Tensor Ⅱ IR spectrometer by signal averaging over 32 scans at a resolution of 4cm-1 in the wavenumber range of 4000-400cm-1. A Renishaw RM-2000 micro-Raman spectrometer was used to obtain the Raman scattering spectra of the samples at the excitation wavelength of 633nm. The spectrometer operates in 180° backscattering geometry and utilizes a grating of 1800 lines/ mm. The resolution is 1cm-1. The Raman spectrum was obtained via six accumulations of the backscattering light, each lasting for 30s. The laser power irradiated on the sample was 4.7mW.
AcknowledgmentsFinancial support from the National Natural Science Foundation of China (Nos. 21304108 and 21674128) and China University of Petroleum-Beijing is gratefully acknowledged.
| [1] | C.C. Rusa, A.E Tonelli. Separation of polymers by molecular weight through inclusion compound formation with urea and a-cyclodextrin hosts. Macromolecules 33 (2000) 1813–1818. DOI:10.1021/ma991883l |
| [2] | Y. Ohya, S. Takamido, K. Nagahama, et al., Molecular“screw and nutâ€: a-cyclodextrin recognizes polylactide chirality. Macromolecules 40 (2007) 6441–6444. DOI:10.1021/ma071198b |
| [3] | A. Gurarslan, J.L. Shen, A.E Tonelli. Single-component poly (e-caprolactone) composites. Polymer 54 (2013) 5747–5753. DOI:10.1016/j.polymer.2013.08.017 |
| [4] | Z. Zhong, C.X. Guo, L. Chen, J. Xu, Y.B Huang. Co-crystal formation between poly (ethylene glycol) and a small molecular drug griseofulvin. Chem. Commun. 50 (2014) 6375–6378. DOI:10.1039/c4cc00159a |
| [5] | D. Isakov, Matos Gomes E.de, M. Belsley, et al., High nonlinear optical anisotropy of urea nano fibers. Europhys.Lett. 91 (2010) 28007. DOI:10.1209/0295-5075/91/28007 |
| [6] | X.J. Yan, B. Peng, B.W. Hu, Q Chen. PEO-urea-LiTFSI ternary complex as solid polymer electrolytes. Polymer 99 (2016) 44–48. DOI:10.1016/j.polymer.2016.06.056 |
| [7] | J. Lu, P.A. Mirau, A.E Tonelli. Chain conformations and dynamics of crystalline polymers as observed in their inclusion compounds by solid-state NMR. Prog. Polym.Sci. 27 (2002) 357–401. DOI:10.1016/S0079-6700(01)00045-4 |
| [8] | H.M. Ye, M. Peng, J. Xu, et al., Conformation transition and molecular mobility of isolated poly (ethylene oxide) chains confined in urea nanochannels. Polymer 48 (2007) 7364–7373. DOI:10.1016/j.polymer.2007.10.033 |
| [9] | Y. Liu, H. Antaya, C Pellerin. Characterization of the stable and metastable poly (ethylene oxide)-urea complexes in electrospun fibers. J.Polym.Sci.B Polym. Phys. 46 (2008) 1903–1913. DOI:10.1002/polb.v46:18 |
| [10] | Y. Liu, H. Antaya, C. Pellerin, Structure and phase behavior of the poly (ethylene oxide)-thiourea complex prepared by electrospinning, J. Phys. Chem. B 114 (2010)2373-2378. |
| [11] | D.W. Lin, Z. Zhong, Y.R. Tang, et al., Morphology and crystalline structure of inclusion compounds formed between poly (ethylene glycol) and urea. Chin.J. Polym.Sci. 32 (2014) 1234–1242. DOI:10.1007/s10118-014-1496-8 |
| [12] | G. Natta, P. Corradini, D. Sianesi, D Morero. Isomorphism phenomena in macromolecules. J.Polym.Sci.A Polym.Chem. 51 (1961) 527–539. |
| [13] | H.M. Ye, R.D. Wang, J. Liu, J. Xu, B.H Guo. Isomorphism in poly (butylene succinate-co-butylene fumarate) and its application as polymeric nucleating agent for poly (butylene succinate). Macromolecules 45 (2012) 5667–5675. DOI:10.1021/ma300685f |
| [14] | H. M. Ye, Y. Y. Song, J. Xu, B. H. Guo, Q. Zhou, Melting behavior of inclusion complex formed between polyethylene glycol oligomer and urea, Polymer 54 (2013)3385-3391. |
| [15] | S. I. Morrow, One hundred and fifty years of isomorphism, J. Chem. Educ. 46 (1969)580. |
| [16] | G Natta. Progress in the stereospecific polymerization. Macromol.Chem.Phys. 35 (1960) 94–131. |
| [17] | H. Matsuura, T Miyazawa. Vibrational analysis of molten poly (ethylene glycol). J.Polym.Sci.B Polym.Phys. 7 (1969) 1735–1744. DOI:10.1002/pol.1969.160071009 |
| [18] | J.M. Marentette, G.R Brown. The (010)-(120) crystal growth face transformation in poly (ethylene oxide) spherulites. Polymer 39 (1998) 1405–1414. DOI:10.1016/S0032-3861(97)00554-5 |