 2017, Vol. 28


b CAS Key Laboratory of Standardization and Measurement for Nanotechnology, CAS Center for Excellence in Nanoscience, National Center for Nanoscience and Technology, Beijing 100190, China
Classical theory of chemical bond mostly applies to gas phase and ambient conditions. Two intermolecular lone electron pairs (LEPs) generally, as the theory tells, cannot form a chemical bond in gas phase [1]. In particular, if two LEP states of, for example, two N atoms are enforced to stay close enough, they may hybridize forming bonding and anti-bonding states [2]. However, both the states are fully occupied leading to the hybridization energetically unfavored, thus, N atoms tend to move apart without external confinement; this is the case that we usually called “non-bonded” of two atoms. In the presence of a metal substrate, e.g. Au(111), significant charge transfer may occur because of adsorbate–substrate electronic hybridization which could balance the repulsions between LEPs. In light of this, it would be interesting to know if two “non-bonded” molecules (atoms) in gas phase could be bonded on a substrate under ambient external conditions.
The state-of-the-art frequency-modulation non-contact Atomic Force Microscopy (nc-AFM) may help us to answer this question. This technique enables identifications of intra-molecular chemical bonds [3], the bond order [4], internal structures of metal clusters [5] and organic molecules [6, 7], even the symmetry of atomic orbitals [8]. In addition, intermolecular hydrogen bond was recently visualized, which extends the imaging ability of this technique to intermolecular region [9]. A recent nc-AFM experiment reported a line feature observed between the two nearest intermolecular N atoms of two bis(para-pyridyl)acetylene (BPPA) molecules adsorbed on Au(111) surface [10]. This exceptional line was thus ascribed to a result of the CO tip tilting effect solely, based on the consideration that the LEPs of these two N atoms do not form a bond in gas phase [10, 11]. Along with this gas-phase consideration, it might not be sufficient to claim the molecules are bonded or non-bonded on solid substrate. Therefore, this feature might not be an artifact; however, it could suggest an unrevealed intermolecular interaction that has yet not been recognized at metal–molecule interface.
In this work, we carried out ab-initio calculations to address the above concern by investigating the geometric and electronic structures of the bis(para-pyridyl)acetylene (BPPA) tetramer adsorbed on Au(111) surface. We identified a N–Au–N three-center molecule–substrate bonding. Its bonding energy is 0.60 eV stronger than the sum of those for two single N–Au covalent bonds. It surmounts the repulsion between the two LEPs from two intermolecular N atoms of 0.14 eV, leading to wavefunction hybridization of the LEPs and a net energy gain of 0.46 eV; the wavefunction hybridization of the LEPs manifests a novel intermolecular interaction on metal surface that distinctively different from the current understanding in gas phase. Besides that, this N– Au–N interaction, effectively applying an in-plane pressure to the tetramer, shortens the N–N distance by 0.77 Å to 3.30 Å and further strengthens wavefunction hybridization of the LEPs. The largely reduced N–N distance and the strengthened LEPs hybridization bring significant electron density in between the two N atoms, which shall be explicitly detectable as a line-like feature in nc-AFM experiments according to our AFM simulation based on the Pauli repulsion picture. In addition, the required pressure that brings the two N atoms to 3.30 Å is largely reduced by two orders of magnitude owing to much easier distorted wavefunctions in one-dimensional (1D) which is applicable by substrate. The induced inplane pressure may be considered as a general role of the substrate to adsorbed molecules or clusters, which could be utilized to directly measure the real-space evolution of electronic interactions or chemical bonding for diverse categories of adsorbate under certain pressures.
2. ExperimentalDensity functional theory (DFT) calculations were carried out using the generalized gradient approximation (GGA) for exchangecorrelation potentials, the projector augmented waves (PAW) method [12, 13], and a plane-wave basis set, as implemented in the Vienna Ab-initio Simulation Package (VASP) [14, 15]. The kinetic energy cutoff for the plane-wave basis set was 400 eV for geometry optimizations and increased to 600 eV for total energy calculations. Dispersion correction, which considers van der Waals interactions, was employed at the self-consistent van der Waals density functional (vdW-DF) level with the optB88 functional for the exchange functional (optB88-vdW) [16] which has been shown to reliably describe the energetics at molecule-metal interfaces [17]. An 8 × 8 supercell consisting of 256 gold atoms in four layers, with at least 15 Å vacuum region, was employed to model the BPPA tetramers adsorbed on the Au(111) surface as well as all calculations of differential charge density (DCD) and a 4 × 3 one consisting of 180 Au atoms in five layers for all isolated molecules. Free-standing molecular clusters were modeled using a 30 × 30 × 15 Å3 supercell. Only the gamma point was used to sample the Brillouin zone in all structural relaxations, and the total energy calculations for all free-standing clusters, as well as the plots of density of states (DOS), electron density of a few particular electronic states for spatial visualizing wavefunctions and differential charge density (DCD); while for the rest total energy calculations, a 3 × 3 × 1 k-mesh were adopted. In structural optimizations of free-standing clusters, all atoms were allowed to move until the residual force per atom is less than 0.005 eV/Å; while for constrained clusters, the z coordinates of all atoms were kept fixed during the relaxation. For the adsorbed molecules, all Au atoms except those at the bottom two layers were fully relaxed until the residual force per atom was less than 0.02 eV/Å. We used Moll's model [18] for the simulations of frequency shift in AFM images, in which the Pauli repulsion energy was written by the increase of kinetic energy in a power law form as ΔEkinetic(R) = Aρsample (R)B, where A and B were two chemical-element dependent fitting parameters. The parameter set for N given in the literature [18] was used in the present simulations. We calculate the lateral attractive or repulsive energy for the tetramer with formula of EL = Etetramer -4 × Esingle, in which Etetramer and Esingle are the adsorption energies of the tetramer and single molecule, respectively. For the constrained free standing system, Etetramer and Esingle are the total energies of the constrained tetramer and a single BPPA molecule.
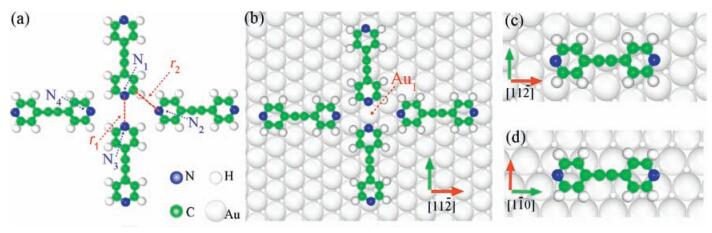
3. Results and discussionWe first consider free-standing molecular clusters to examine the role of intermolecular interactions only. The optimized fully free-standing tetramer is heavily distorted, mostly along the normal-plane direction with its two-fold symmetry broken. To avoid it, an in-plane constrain that keeps all atoms moving in the molecular plane was applied. Fig. 1a shows the fully relaxed atomic structure of a constrained free-standing tetramer (cFT) where the length between nitrogen atoms N1 and N3, denoted r1, is 4.07 Å and the C–H…N2 (r2) distance is 4.05 ± 0.10 Å, within the range of weak hydrogen bonds [19]. Notably that r1 is 0.77 Å longer than that of the experimental value [10]. This prominent difference in length reflects the repulsive intermolecular “head-to-head” interaction and is also an indication for the overwhelming role of the substrate that brings the molecules closer. The presence of the Au(111) surface, as expected, shortens r1 by 0.77 Å, but its mechanism is yet to be uncovered. Fig. 1b shows the atomic structure of the most energetically stable tetramer adsorbed on the Au substrate (AT) among all 12 considered candidates (Fig. S1 in Supporting information lists six examples among them). The two head-to-head BPPAs are orientated along the [110] direction, in which the N1 and N3 atoms reside at the two bridge sites of the surface with an Au atom underneath, denoted Au1. Another two molecules are parallel to the [112] direction with the N2 or N4 atom sits slightly off a hollow site. Lengths r1 and r2 are reduced to 3.30 Å and 3.90 ± 0.10 Å, respectively, remarkably consistent with the experimentally reported value [10].

|
Download:
|
| Figure 1. Fully relaxed atomic structures of the most energetically favorable configurations for constrained-freestanding tetramer (cFT) (a), adsorbed tetramer (AT) (b), and two isolated BPPA molecules along [110] (c) and [112] (d) directions, respectively. Filled blue, white, green and light gray balls represent N, H, C, and Au atoms separately. Two red dashed lines in panel (a) denote the length of N1–N3 (r1) and C–H…N2 (r2), respectively, while atoms N1 to N4 and Au1 were marked in panels (a) and (b). | |
The Au substrate plays a crucial role in determining the length of r1, while the hydrogen bonds only have minor effect. In comparison with the 0.77 Å expansion without the substrate, r1 elongates by only 0.06 Å in a constrained free-standing head-tohead dimer, in which no intermolecular hydrogen bond is formed. The tetramer-substrate interaction energy is -5.88 eV. As a comparison, the attractive energy of the hydrogen bonds is estimated -0.10 eV, while 0.04 eV for the N1–N3 repulsion at the inter-nitrogen distance of 4.07 Å. These values explicitly indicate the crucial role of Au substrate. The exclusion of hydrogen bonds in AT only enlarges r1 by 0.08 Å, i.e. from 3.30 Å to 3.38 Å (schematically shown in Fig. S2 in Supporting information). These hydrogen bonds result in an effective in-plane pressure to the head-to-head BPPA molecules, while its strength is quite limited. In other words, the tetramer is significantly compressed after adsorbed on the Au substrate, with a driving energy of 0.46 eV. Such a compression, as suggested by the literature [20], is a result of the substrate confinement, which may be resulted from two possible origins, namely the N–Au–N three-center bonding or substrate-assistant intermolecular bonding within a tetramer.
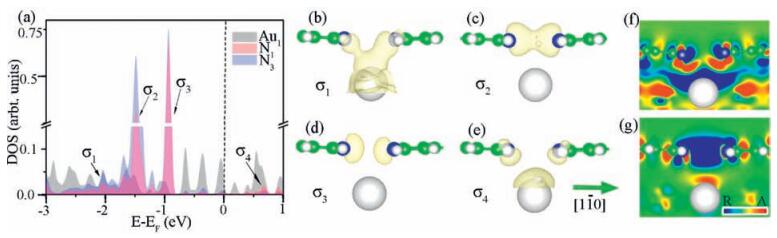
Electronic structures were inspected to identify the contributions of these two possible origins. We found four hybridized states at -2.04 eV, -1.48 eV, -0.93 eV and 0.67 eV of AT from the density of states (DOS) shown in Fig. 2a, namely σ1, σ2, σ3 and σ4, from which the intermolecular (N1 and N3) and molecule–substrate (N1/N3 and Au1) electronic hybridizations were clearly confirmed. It turns out that the molecule–substrate bonds primarily provide the confinement, i.e. state σ1 in Fig. 2a, while the substratemediated direct intermolecular wavefunction overlap does occur between the lone electron pairs (LEPs) of N1 and N3, see state σ2 in Fig. 2a. Visualized wavefunctions manifest that σ1 (Fig. 2b) and σ4(Fig. 2e) are bonding and anti-bonding states of the molecule– substrate hybridization; while σ2 (Fig. 2c) and σ3 (Fig. 2d) are those for the direct intermolecular wavefunction overlap.

|
Download:
|
| Figure 2. Electronic density of states of Au1 (gray shaded area), N1 (light red shaded area) and N3 (light blue shaded area) in the adsorbed tetramer were shown in (a). Wavefunctions of these four hybridized electronic states, namely σ1 to σ4 found in panel (a), were visualized in panels (b) to (e), respectively. Isosurface contours of electron density are drawn at 1E-5 e/Å3 for panels (b) and (e) while 1E-4 e/Å3 for (c) and (d). Two differential charge densities, i.e. DCD1 (f) and DCD2 (g) account for the electron redistribution upon adsorption and formation of the tetramer, respectively. The slabs were cleaved across atoms N1, N3 and Au1. Letters “R” and “A” of the color bar stand for electron reduction and accumulation, respectively. | |
The visualized wavefunction of state σ1, together with DCD1 shown in Fig. 2f, suggests a three-center covalent bonding between Au1–N1 and Au1–N3, which was supported by the N1(N3)–Au1 vertical distance of 3.09 ± 0.08 Å, appreciably smaller than the sum of the vdW radii of N and Au of 3.21 Å. Here, DCD1 reflects the molecule–substrate electronic interaction, which is defined as ρDCD1 = ρTotal – ρTetramer - ρSubstrate, where ρTotal, ρTetramer and ρSubstrate are the total electron densities of the tetramer-Au(111) interface, the tetramer itself and the solely Au(111) substrate, respectively. The slab is cleaved across atoms N1, N3 and Au1. Electron reduction near these three atoms and electron accumulation in the middle of N1–Au1 and N3–Au1 explicitly indicate the covalent character of the bonding. This bonding significantly stabilizes the BPPA molecules on the substrate, in other words, the molecule–substrate attraction substantially balances the repulsion between the LEPs of N1 and N3 and thus brings the two N atoms closer.
Differential charge density DCD2, defined as ρDCD2 = ρTotal – 4*ρisolated + 3*ρSubstrate, illustrates the electron redistribution when putting four isolated adsorbed BPPA molecules together forming an adosrbed tetramer on Au(111) surface. Here, ρisolated is the total electron density of an adsorbed isolated BPPA molecule. Electron reduction between the two molecules and accumulation above Au1 manifest the non-bonding nature of the intermolecular wavefunction overlap; while the substrate is effectively an electron acceptor. It is exceptional that the intermolecular hybridization leads to non-bonding. If we revisit the DOS, both the bonding and antibonding states of the intermolecular (N1 and N3) electronic hybridization are fully occupied, which thus gives rise to an overall result of non-bonding. The substrate, however, receives extra electrons squeezed from the two LEPs, which further stabilizes the “compressed” tetramer. In addition to the stabilizing effect, the substrate significantly modifies the electron density at the N–N region, which indicates that it is highly necessary to include the substrates in modeling nc-AFM images.
We confirm that the much shortened N1–N3 distance in AT is a consequence of strong molecule–substrate covalent bonds, resulting in a closer contact of the two head-to-head molecules. At such a short distance of 3.30 Å, electronic hybridization between the two LEPs of N1 and N3 does occur but has nearly no contribution to the stabilization, owing to both occupied bonding and anti-bonding states. As a side effect, electrons are squeezed out because of the two LEPs strongly superposed. The electron density along N1–N3 redistributes with, most likely, a trend moving downward to the substrate. It thus becomes an interesting issue that the exact electron density along the N–N line.
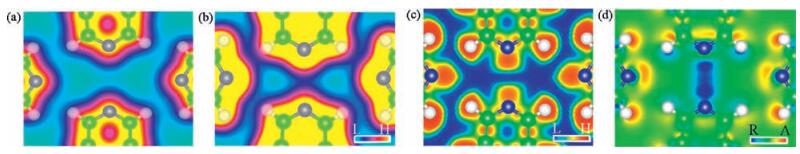
Exceptional large electron density was found at the middle region of N1 and N3 in AT. Fig. 3a and b shows the total electron densities (TEDs) of cFT and AT, respectively, in which electron density at the middle region is highly pronounced in AT, but unapparent in the cFT case. We inspected the correlation of the strength of electronic hybridization, namely the separation of bonding and anti-bonding states (ΔE), to the N1–N3 distance (Fig. S3 in Suporting information) in constrained free-standing tetramers. As shown in Fig. S3, the smaller the distance, the larger the separation and the stronger the hybridization. Therefore, the shorter N1–N3 distance of 3.30 Å in AT plays an important role in the more explicit electron density, consistent with the TED results. Electron localization function shown in Fig. 3c suggests highly localized electron density between N1 and N3, which originates from the LEPs of the two N atoms. We have to stress that although the electron reductions occur between N1 and N3, the bonding state (σ2), effectively two compressed LEPs, still retains substaintilly high and localized electron density around the middle of the N1–N3 line. In addition, we also found relatively high electron density along r2 in the TEDs of cFT and AT (Fig. 3a and b), a piece of evidence for intermolecular hydrogen bonds [9], as confirmed by the top view of DCD2 (Fig. 3d). Thus the line features are developed from the electron reduction near N2, N4 and the associated H atoms and electron accumulation between them. These distinctive features, namely intermolecular hydrogen bonds and sufficient electron density along the N1–N3 line, shall be detectable in the state-of-the-art frequency-modulation non-contact atomic force microscopy.

|
Download:
|
| Figure 3. Total electron densities ofconstrained free-standing tetramer(a)and adsorbed tetramer(b).Theslab surfaceswere cleavedat1.5 Å above themolecularplane. Electron localization function of the adsorbed tetramer was shown in (c), with the associated top view of DCD2 (d). Both slabs were cleaved across the molecular plane. Letters “L”, “H”, “R”, and “A” stand for low and high electron density and electron reduction and accumulation, respectively. | |
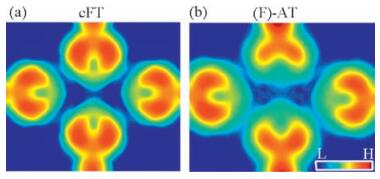
Simulations of nc-AFM images were performed for cFT and (F)-AT (Fig. 4) using the model proposed by Moll [18] which considers the Pauli repulsion between a CO tip and the sample with the rigid tip assumption. Here, (F)-AT stands for a free-standing tetramer that its atomic structure was extracted from the adsorbed tetramer. The N1–N3 distance, again, dominates the appearance of the images that the N1–N3 line becomes more prominent with the distance decreased from 4.07 Å to 3.30 Å. Even though the electron density is slightly reduced by the substrate attraction, it is still sufficiently high at the N1–N3 region compared with a generally thought “no-bond” area which often refers to “no electrondensity”.A number of previous investigations suggest that the larger inter-atomic electron density results in more apparent line feature in nc-AFM image [3–7, 9, 21]. This statement has also been recently confirmed by a theoretical study that considers the tip tilting effect [22].

|
Download:
|
| Figure 4. Simulated AFM images of constrained free-standing tetramer (a) and adsorbed tetramer (b) using the model proposed by Moll [18] with a sample-tip separation of 3.5 Å. In the simulation for adsorbed tetramer, only the molecules were considered by extracting the atomic coordinates of the molecules from the fully relaxed adsorbed tetramer structure. | |
Here, the imaging is, we believe, more sensitive to the electron density accumulated by the direct wavefunction overlap than to that of the three-center covalent bonding, owing to its higher vertical position, less screening charge, and high electronic localizability. Therefore, the line feature between N1 and N3 imaged by nc-AFM reflects the accumulation of electron density, not limited to a conventionally chemical bonding. This finding is consistent with a major consideration that the high resolution contrast in nc-AFM images comes from the strong short-range Pauli repulsion between the wavefunctions of the sample and the CO-functionalized nc-AFM tip [3–9, 18, 23]. The energy change induced by the Pauli repulsion can be approximately written as the change of the kinetic energy of the sample electronic states, which can be expressed by a function of sample electron density in a form similar to the Thomas-Fermi expression of kinetic energy [18]. Whereas, the tilting effect of the CO molecule only plays a role in sharpening observed features.
Considering the strong repulsion between the two LEPs of N1 and N3, a remaining question is that how it is possible to maintain such a strong constrain between adsorbed molecules. In the present case, the confinement is provided by the N–Au–N threecenter covalent bonds. This molecule–substrate attraction is prone to minimize the surface area, effectively applying an in-plane pressure to the tetramer. It usually needs quite high pressure allowing two LEPs to hybridize in three-dimensional (3D) materials, however, it drops by two orders of magnitude in onedimensional (1D), which guarantees the substrate induced effective pressure can affect the inter-nitrogen electronic hybridization. A pressure of over 100 GPa is often needed to form electronic hybridization among LEPs in abul kmaterial [2], whichis even higher than the Young's modulus of Au [24]. Regardless how strong themolecule–substrate interaction, itappears impossibleto apply such a high pressure by the substrate confinement.However, the BPPA tetramer indeed forms a 1D structure because of the anisotropy of the Au(111) surface. We argue that with reduced dimension, in 1D for the present case, electrons could be squeezed into another two dimensions (Fig. 5a), which substantially reduces the repulsion between the LEPs and thus enables a much smaller in-plane pressure to promote the electronic hybridization.

|
Download:
|
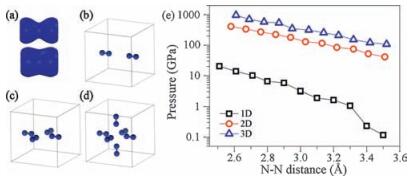
| Figure 5. (a) Total electron densities of a N2 molecule with N–N bond lengths of 3.3 and 3.0 Å. (b)–(d) One-, two-and three-dimensional models to considered the needed pressure for compressing N2 molecules. (e) Needed pressure as a function of N–N bond length in the one-(black square), two-(red circle), three-dimensional (blue triangle) models. | |
This assumption was verified by a model calculation. We employ N2 molecules as prototype to construct 1D, 2D and 3D models shown in Fig. 5b–d to reveal the values of pressuredistance relation in 1D to 3D. We change the distance of two farthest N atoms and keep them fixed during structural relaxation. After the structure fully relaxed, we plot the pressure as a function the distance of two nearest N atoms. Fig. 5e clearly shows that the pressures required to bring the two LEPs closer in 2D or 3D are two orders of magnitude larger than that in 1D. It only needs less than 1.1 GPa to maintain a 3.30 Å N1–N3 distance in AT, a value that is definitely applicable by the Au(111) substrate.
The shortened distance of two nuclei under a certain pressure gives rise to a higher electron density between them and thus a stronger wavefunction overlap for a given bond [25], which is detectable by nc-AFM as enhanced imaging contrast. It has been seeking for a technique that can achieve atomically resolved real-space observation of the evolution of electronic structure under pressure [2]. The nc-AFM is potentially such a technique that is sensitive to the variation of electron density with respect to the distance change of nuclei. Given the effectively applied inplane pressure by the substrate, it may offer a novel method with atomic resolution to study various high-pressure phenomena which are relevant to substantial electron redistributions between two nuclei [2].
4. ConclusionIn summary, we identity a unexpectedly strong intermolecular interaction that adequately associates with molecule–substrate interactions in BPPA/Au(111). Given the description of its geometric and electronic structures, we quantitatively revealed how molecule–substrate interaction affects intermolecular wave functions. In particular, an N–Au–N three-center covalent bond was found in BPPA/Au(111) with an energy gain of 0.46 eV, rather strong than the previously known N–Au coordination bond. This bond, with a minor role played by the intermolecular hydrogen bonds, effectively applies an in-plane pressure to the adsorbed tetramer, enforcing the two LEPs of two BPPAs resided at a much shorter distance of 3.30 Å from its equilibrium of 4.07 Å upon adsorption. These two closely contacted LEPs hybridize into two new states, but both are fully occupied by electrons. They are thus non-bonding in this region in terms of a general chemical sense. Besides the Au(111) surface, we can infer that the bonding mechanism remains as long as the lateral compressive force is preserved on the tetramer. This force may come from diverse origins, like molecule–substrate (N–metal–N three-center bonding) covalent bond or interlayer van der Waals (vdW) interactions. If Au(111) is replaced with Ag(111) or Cu(111), the stronger N–Ag–N or N–Cu–N interaction offers sufficient effective pressure compressing the LEPs of N to hybridize. Similarly, in multilayer black phosphorus [26] and PtS2 [27], two prototype 2D materials, interlayer vdW interactions drive the LEPs of P or S atoms to hybridize. We use term “covalent-like quasi-bonding” to describe this interlayer interaction in 2D materials. Although they are nonbonding in general senses, the bonding state of the hybridization, appeared as direct wavefunction overlap, can accumulate sufficient electrons at the middle of the N1–N3 line, which, together with hydrogen bonds, were observable in nc-AFM [10].
These results imply that nc-AFM can be used to reveal novel intermolecular interactions; while in the theoretical consideration, atoms cannot be simply regarded as classic electrostatic spheres at the atomic scale, the distribution of electrons among them is of paramount importance. This work also suggests that electron density is the key physical quantity for nc-AFM imaging. Line-like features reflect localized, less-screened, and appreciable electron density in the line region, regardless whether the electrons can form a classical chemical bond with energy gain or just enhance electron density due to the external constrain. In light of this, we believe, the tilting effect of the CO tip only sharpens or perturbs the image based on electron density. Here, we also demonstrated that metal substrate can act as an external constrain to apply in-plane pressures to molecular assembles, which enables the direct ncAFM imaging for the evolution of chemical interactions under certain pressures. It appears a new application of nc-AFM and might be devoted to solve some remaining issues in high-pressure physics and chemistry of molecular systems at the atomic scale.
AcknowledgmentThis work was supported by the Ministry of Science and Technology (MOST) of China (Nos. 2012CB932704, 2012CB933001), the National Natural Science Foundation of China (NSFC, Nos. 11274380, 91433103, 21173058, 11622437, 61674171 and 21203038). C.-G. W. was supported by the Outstanding Innovative Talents Cultivation Funded Programs 2015 of Renmin University of China. The Calculations were performed at the Physics Laboratory for High-Performance Computing of Renmin University of China and at the Shanghai Supercomputer Center.
Appendix A. Supplementary dataSupplementary data associated with this article can be found, in the online version, at http://dx.doi.org/10.1016/j.cclet.2016.08. 004.
| [1] | J. D. Lee, Concise Inorganic Chemistry, New York: John Wiley & Sons, 2008 . |
| [2] | W. Grochala, R. Hoffmann, J. Feng, N.W. Ashcroft, The chemical imagination at work in very tight places. Angew.Chem.Int.Ed. 46 (2007) 3620–3642. DOI:10.1002/(ISSN)1521-3773 |
| [3] | L. Gross, F. Mohn, N. Moll, P. Liljeroth, G. Meyer, The chemical structure of a molecule resolved by atomic force microscopy. Science 325 (2009) 1110–1114. DOI:10.1126/science.1176210 |
| [4] | L. Gross, F. Mohn, N. Moll, Bond-order discrimination by atomic force microscopy. Science 337 (2012) 1326–1329. DOI:10.1126/science.1225621 |
| [5] | M. Emmrich, F. Huber, F. Pielmeier, Subatomic resolution force microscopy reveals internal structure and adsorption sites of small iron clusters. Science 348 (2015) 308–311. DOI:10.1126/science.aaa5329 |
| [6] | L. Gross, F. Mohn, N. Moll, Organic structure determination using atomic-resolution scanning probe microscopy. Nat.Chem. 2 (2010) 821–825. DOI:10.1038/nchem.765 |
| [7] | D.G. de Oteyza, P. Gorman, Y.C. Chen, Direct imaging of covalent bond structure in single-molecule chemical reactions. Science 340 (2013) 1434–1437. DOI:10.1126/science.1238187 |
| [8] | J. Welker, F.J. Giessibl, Revealing the angular symmetry of chemical bonds by atomic force microscopy. Science 336 (2012) 444–449. DOI:10.1126/science.1219850 |
| [9] | J. Zhang, P.C. Chen, B.K. Yuan, Real-space identification of intermolecular bonding with atomic force microscopy. Science 342 (2013) 611–614. DOI:10.1126/science.1242603 |
| [10] | S.K. Hämäläinen, N. van der Heijden, J. van der Lit, Intermolecular contrast in atomic force microscopy images without intermolecular bonds. Phys.Rev.Lett. 113 (2014) 186102. DOI:10.1103/PhysRevLett.113.186102 |
| [11] | P. Hapala, G. Kichin, C. Wagner, Mechanism of high-resolution stm/afm imaging with functionalized tips. Phys.Rev.B 90 (2014) 085421. DOI:10.1103/PhysRevB.90.085421 |
| [12] | P.E. Blöchl, Projector augmented-wave method. Phys.Rev.B 50 (1994) 17953–17979. DOI:10.1103/PhysRevB.50.17953 |
| [13] | G. Kresse, D. Joubert, From ultrasoft pseudopotentials to the projector augment-ed-wave method. Phys.Rev.B 59 (1999) 1758–1775. |
| [14] | G. Kresse, J. Furthmüller, Efficiency of ab-initio total energy calculations for metals and semiconductors using a plane-wave basis set. Comput.Mater.Sci. 6 (1996) 15–50. DOI:10.1016/0927-0256(96)00008-0 |
| [15] | G. Kresse, J. Furthmüller, Efficient iterative schemes for ab initio total-energy calculations using a plane-wave basis set. Phys.Rev.B 54 (1996) 11169–11186. DOI:10.1103/PhysRevB.54.11169 |
| [16] | J. Klimeš, D. R. Bowler, A. Michaelides, Chemical accuracy for the van der Waals density functional, J. Phys. : Condens. Matter 22(2010)022201. |
| [17] | Z.X. Hu, H.P. Lan, W. Ji, Role of the dispersion force in modeling the interfacial properties of molecule-metal interfaces:adsorption of thiophene on copper surfaces. Sci.Rep. 4 (2014) 5036. |
| [18] | N. Moll, L. Gross, F. Mohn, A. Curioni, G. Meyer, A simple model of molecular imaging with noncontact atomic force microscopy. New J.Phys. 14 (2012) 083023. DOI:10.1088/1367-2630/14/8/083023 |
| [19] | G. A. Jeffrey, An Introduction to Hydrogen Bonding, New York: Oxford University Press, 1997 . |
| [20] | J. Zhang, B.K. Yuan, P.C. Chen, Exceptionally stiff two-dimensional molecular crystal by substrate-confinement. ACS Nano 8 (2014) 11425–11431. DOI:10.1021/nn505969v |
| [21] | N. Pavliček, B. Schuler, S. Collazos, On-surface generation and imaging of arynes by atomic force microscopy. Nat.Chem. 7 (2015) 623–628. DOI:10.1038/nchem.2300 |
| [22] | C.S. Guo, M.A. Van Hove, X.G. Ren, Y. Zhao, High-resolution model for noncontact atomic force microscopy with a flexible molecule on the tip apex. J.Phys.Chem.C 119 (2015) 1483–1488. |
| [23] | L. Gross, Recent advances in submolecular resolution with scanning probe microscopy. Nat.Chem. 3 (2011) 273–278. DOI:10.1038/nchem.1008 |
| [24] | W. D. Callister Jr. , D. G. Rethwisch, Materials Science and Engineering: An Introduction, Wiley, New York, 2007. |
| [25] | G.V. Gibbs, F.C. Hill, M.B. Boisen, R.T. Downs, Power law relationships between bond length, bond strength and electron density distributions. Phys.Chem.Miner. 25 (1998) 585–590. DOI:10.1007/s002690050151 |
| [26] | J.S. Qiao, X.H. Kong, Z.X. Hu, F. Yang, W. Ji, High-mobility transport anisotropy and linear dichroism in few-layer black phosphorus. Nat.Commun. 5 (2014) 4475. |
| [27] | Y.D. Zhao, J.S. Qiao, P. Yu, Extraordinarily strong interlayer interaction in 2D layered Pts2. Adv.Mater. 28 (2016) 2399–2407. DOI:10.1002/adma.v28.12 |