 2017, Vol. 28


b Gansu Entry-Exit Inspection and Quarantine Bureau, Lanzhou 730020, China
Ascorbic acid, also known as vitamin C, is a kind of natural organic compounds, which widely exists in animals and plants. As an essential micronutrient due to the strong antioxidant capacity, it is required for numerous physiological and biochemical functions in human body. In addition, a variety of clinical researches have shown that ascorbic acid is associated with many chronic diseases, including gout, mucositis, infertility, skin disease, HIV/AIDS and cancer [1-3]. Moreover, as a water-soluble vitamin, ascorbic acid is also widely used as antioxidant in food, beverage, animal feed, medical formula and cosmetic to prevent the change of taste and smell. Unfortunately, ascorbic acid is an exogenous substance and cannot be synthesized in the human body. Therefore, taking a daily supplement of ascorbic acid from different dietary sources high in ascorbic acid is very necessary for maintaining the ascorbic acid levels in body and counteracting many undesired diseases. Hence, determination of ascorbic acid levels in different foods is of great significance in disease prevention and daily ascorbic acid supplement.
So far, a large number of detection systems for ascorbic acid have been reported, including high-performance liquid chromatography (HPLC) [4], ultraviolet-visible spectrophotometry (UV-vis) [5, 6], solid phase method [7, 8], electrochemistry (EC) method [9-12] as well as the chemiluminescence (CL) technology [13], and so on. Nevertheless, these methods have various different defects, such as high cost, complicated sample preparation, timeconsuming, large infrastructure and professional knowledge. Recently, fluorescent detection technology has attracted more and more interest that can achieve high sensitivity, high selectivity, simple process before preparation, no large instrument, and can directly detect the target molecules in living cells, bodies and tissues [14-20].
Molybdenum disulfide (MoS2) is a kind of transition metal chalcogenide, which is composed of S-Mo-S triple layers structure formed by weak Van der Waals force [21, 22]. It possesses unique properties and provides wide-ranging applications including batteries, catalyst, biosensors, and so forth [23-28]. MoS2 quantum dots (QDs) are a new type of graphitic-like fluorescent nano-material. It not only has two dimensional structures but also has unique optical properties. However, very few investigations of the relevant application of MoS2 QDs have been reported. This is mainly because the synthesis of MoS2 QDs with high performance is hard to achieve [29]. Most of them were prepared using "top- down" method, which are generally more sensitive to the environment, or use expensive and toxic organic solvent, or need a complex pretreatment procedure [30, 31]. Hydrothermal synthesis, a most widely-used "bottom-up" method, has significant advantages, such as simple, environmentally friendly and energysaving. Wang and Ni proposed a hydrothermal synthesis with ammonium molybdate and cysteine as the precursors for MoS2 QDs with excellent properties [29].
In the present work, we prepare fluorescent MoS2 QDs through hydrothermal synthesis by choosing sodium molybdate and glutathione as the precursors. And then, we demonstrate a "switch-on" fluorescent probe for sensitive and rapid sensing of ascorbic acid in fruit samples, which is a powerful and widely-used method [32, 33]. The fluorescence of MoS2 QDs is obviously quenched by MnO2 nanosheets through inner filter effect (IFE). Upon the addition of ascorbic acid, a remarkable fluorescence recovery emerges, which is mainly based on the reduction of MnO2 to Mn2+ by ascorbic acid. Therefore, the structure of the MoS2 QDsMnO2 nanosheets probe was decomposed, and the fluorescence intensity of MoS2 QDs was restored remarkably as the ascorbic acid concentration increased. Furthermore, the fabricated fluorescence probe is successfully applied for the determination of ascorbic acid in hawthorns and fresh jujubes.
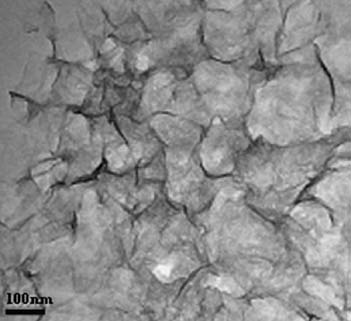
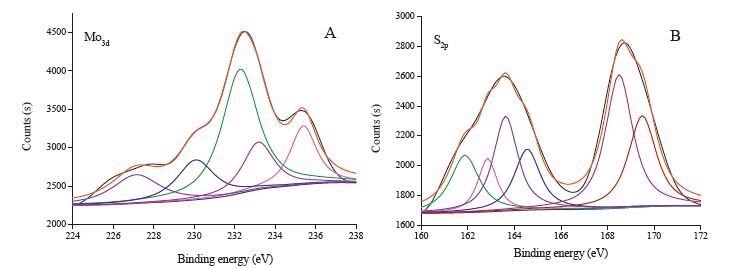
2. Results and discussion 2.1. CharacterizationThe morphology and structure of the MoS2 QDs and MnO2 nanosheets were shown in their TEM images. The MoS2 QDs are regular in shape and monodisperse as estimated from Fig. 1A, and their diameters are mainly distributed in the narrow range of 2.8 ± 0.4 nm (seen in Fig. 1B, the size is statistically calculated from more than 100 QDs in the TEM images). And from Fig. 2, it can be seen that the prepared MnO2 nanosheets are homogeneous layer structure. The surface composition and elemental analysis of the MoS2 QDs were investigated by XPS. The full range XPS analysis of the resultant MoS2 QDs clearly showed the existence of Mo and S, together with N, C and O, which originate from the precursor. Mo and S were further confirmed with the high-resolution XPS of Mo3d and S2p spectrum, respectively (Fig. 3A and B). The surface components of MoS2 QDs determined by the XPS were in good agreement with the previous report [29].

|
Download:
|
| Figure 1. The TEM images (A) and the size distribution (B) of MoS2 QDs. | |

|
Download:
|
| Figure 2. The TEM image of the MnO2 nanosheets. | |

|
Download:
|
| Figure 3. High-resolution peak-fitting XPS spectra of the Mo3d (A) and S2p (B) regions for MoS2 QDs. | |
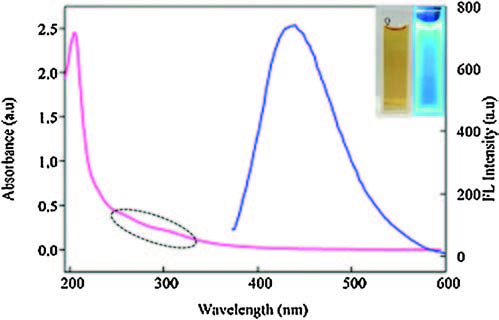
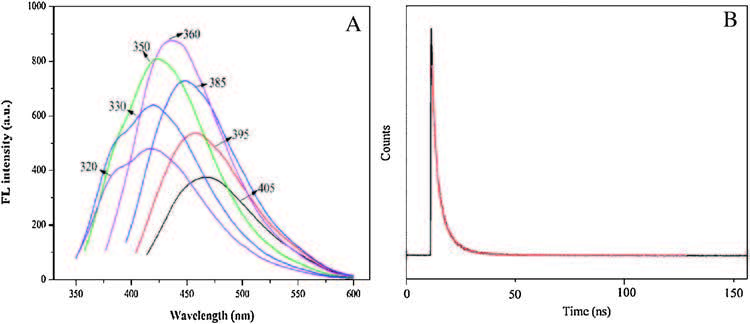
It was clearly observed from Fig. 4 that the as-obtained MoS2 QDs presented a narrow and symmetrical photoluminescence (PL) peak at an emission wavelength around 430 nm under excitation at 360 nm. In addition, the UV-vis spectrum exhibited a characteristic absorption peak at around 275 nm [29]. Moreover, the PL emission peak of MoS2 QDs was red-shifted from 420 nm to 465 nm with the excitation wavelength ranging from 320 nm to 405 nm (Fig. 5A). The fluorescence intensity increased until λex = 360 nm, and then decreased remarkably. The strong excitation-dependent PL behaviour of MoS2 QDs may be resulted from the heterogeneous distribution of particles sizes and surface states, as in the case of most luminescent graphene quantum and carbon dots [36-38]. Fig. 5B displayed the fluorescent decay curves of the MoS2 QDs, and the average lifetime (t) is 5.3 ns

|
Download:
|
| Figure 4. UV-vis absorption (red line) and fluorescence emission (blue line) spectra of the MoS2QDs.Insetisthe photographofMoS2QDs dispersionsolutionunder visible light and UV light (365nm). | |

|
Download:
|
| Figure 5. (A) Fluorescence emission (FL) spectra of the MoS2 QDs under different excitation wavelength. (B) The time-resolved luminescence spectra of MoS2 QDs. | |
The absolute quantum yield (QY) of MoS2 QDs was measured to be 3.2%, which was comparable with the previous report [29].
2.2. Mechanism study of MoS2 QDs-MnO2 nanosheets probe for ascorbic acidAs presented in Scheme 1, the fluorescence of MoS2 QDs was greatly quenched after addition of MnO2 nanosheets to construct the MoS2 QDs-MnO2 nanosheets probe. After adding the reductant of ascorbic acid, the quenching phenomenon disappeared. Therefore, the MoS2 QDs-MnO2 nanosheets probe was decomposed and the fluorescence intensity of MoS2 QDs was restored remarkably as the ascorbic acid concentration increased.

|
Download:
|
| Scheme1. Schematic illustration of the principle of MoS2 QDs-MnO2 nanosheets system based chemosensor for ascorbic acid (AA). | |
2.2.1. Quenching mechanism
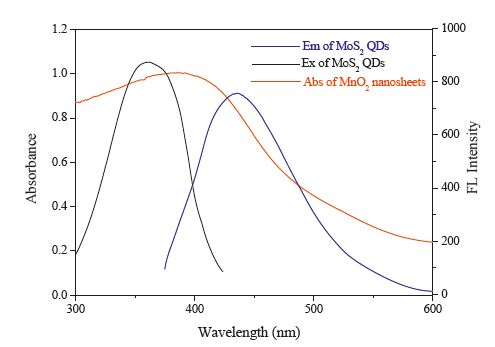
As displayed in Fig. 6, MnO2 nanosheets have a wide range of absorption spectrum in the range of 200-600nm, and there was a relative large overlap region between the absorption spectrum of MnO2 nanosheets and the fluorescence excitation/emission spectra of MoS2 QDs. Meanwhile, MnO2 nanosheets possess a rather large molar extinction coefficient of 9.6×10³ Lmol-1cm-1 [34]. Combined the two factors, MnO2 nanosheets were usually served as an efficient candidate for fluorescence quencher [39, 40]. Based on the large spectrum overlap, the MnO2 nanosheetsinduced fluorescence suppression of MoS2 QDs was first considered to stem from inner filter effect (IFE).

|
Download:
|
| Figure 6. The UV-vis absorption of MnO2 nanosheets (red line) and the fluorescence spectra of MoS2 QDs (black line for excitation and blue line for emission). | |
2.2.2. Restoration mechanism
Evidently, a fluorescence recovery of MoS2 QDs was observed immediately upon addition of ascorbic acid tothe MoS2 QDs-MnO2 nanosheets system. At this stage, the fluorescence sensor was switched to the "on" state. Based on the literatures, the fluorescence recovery should be ascribed to the redox reaction between MnO2 nanosheets and ascorbic acid. The reductant of ascorbic acid was an effective antioxidant, it could reduce the MnO2 nanosheets into Mn2+ [39].
2.3. Optimization of experimental conditionsIn order to achieve accurate and reliable detection results, we have conducted several control tests to systematically study the influences of different variables on the detection sensitivity, including the pH of buffer solution, quenching agent concentration and the time needed for the quenching and restoration process.
Fig. 7A showed the effect of pH on the determination performance over a pH range from 5.0 to 12.0 with a universal PBS buffer. The largest degree of fluorescence restoration was obtained at pH 8.0. Therefore, pH 8.0 was finally chosen as the optimal pH. As shown in Fig. 7B, different concentrations of MnO2 nanosheets were added into the same amount of MoS2 QDs solution, and then 100 μmol/L ascorbic acid was introduced to the above quenching system. From the relationship between the fluorescence restoration changes and MnO2 nanosheets dosages, we could find that less MnO2 nanosheets could not quench the fluorescence of MoS2 QDs thoroughly and thus caused just a weak fluorescence restoration. However, when a high amount of quenching agent was introduced, it would reduce the detection sensitivity of the MoS2 QDs-MnO2 nanosheets system. This is probably because the analyte of ascorbic acid preferentially react with the dissociative MnO2 nanosheets in solution rather than the MnO2 combined with the MoS2 QDs. Thus resulted in poor sensitivity. From Fig. 7B, 80 mL was chosen as the best amount of quenching agent to join, which presented the most obvious fluorescence recovery. From Fig. 7C and D, it can be seen that the quenching and recovery process were very rapid. The quenching process could reach the balance state in 2 min and the recovery process achieved the platform area in 5 min.

|
Download:
|
| Figure 7. Effects of (A) pH of buffer solution and (B) concentration of MnO2 nanosheets on fluorescence restoration. ΔF = F-F0, where F and F0 are the fluorescence intensities of MoS2 QDs-MnO2 nanosheets system in the presence and absence of ascorbic acid. (C, D) Relationship between fluorescence intensity and incubation time of quenching and restoration, respectively. Experimental conditions: 0.2 mol/L PBS buffer, 5.0 μmol/L ascorbic acid. | |
2.4. Analytical performance of MoS2 QDs-MnO2 nanosheets sensor for ascorbic acid sensing 2.4.1. Sensitivity
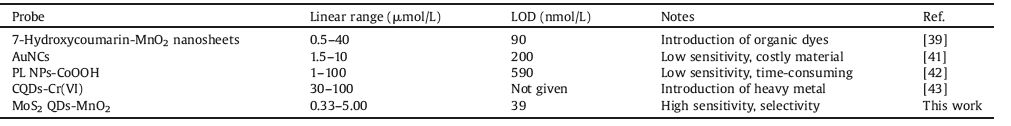
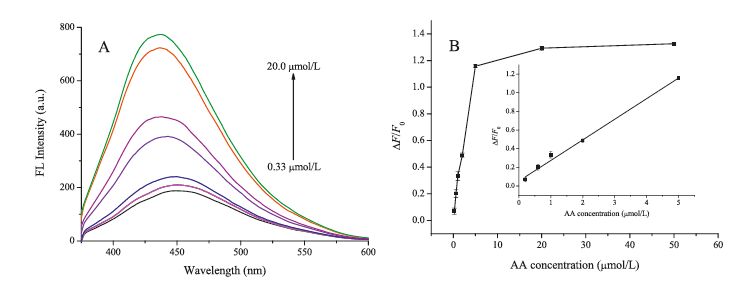
Under the optimum experimental conditions, the sensitivity of this sensing system was investigated. As indicated in Fig. 8A, the fluorescence intensity enhancement was closely related to the concentration of ascorbic acid. Fig. 8B demonstrated the linear plot of ΔF/F0 against the concentration of ascorbic acid, where DF is the difference between F0 and F, corresponding to the fluorescence intensity before and after the addition of ascorbic acid into probe system respectively. The linear regression equation was ΔF/F0 = 0.0637 + 0.219 c (R2 = 0.9921), where c is the concentration of ascorbic acid. Good linearity was found with ascorbic acid concentrations ranging from 0.33 to 5.00 μmol/L. The limit of detection (LOD) was estimated to be 39 nmol/L on the basis of the generalized 3s method, which is comparable to or even better than the previous reported fluorescence systems for ascorbic acid sensing (Table 1).

|
Download:
|
| Figure 8. (A) Fluorescence emission spectra of MoS2 QDs with increasing concentration of ascorbic acid (0.33, 0.66, 1.00, 2.00, 5.00, 20.00 μmol/L). (B) Relationship between ΔF/F0 and the concentration of ascorbic acid. The fluorescence emission intensity at 430 nm was measured with an excitation of 360 nm. The error bar represents the average value ± the relative standard deviation (n= 3). | |
|
|
Table 1 Comparison of different methods for ascorbic acid sensing. |
2.4.2. Selectivity
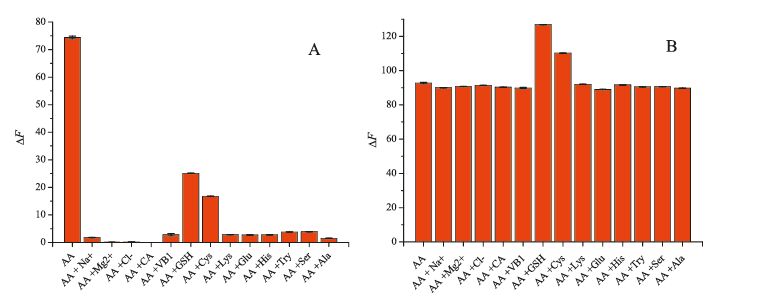
In order to assess the selectivity of fluorescent probe established in this study, we have investigated the influences of possible foreign substances. The potential interference in fruits included some mineral ions and amino acids, especially some amino acid also possessing the effect of reduction, including glutathione and cysteine. As the experimental data shown in Fig. 9A, under the same conditions, ascorbic acid revealed an obvious fluorescence enhancement against the other analytes at a 10-fold concentration of ascorbic acid, demonstrating that this MoS2 QDs-MnO2 nanosheets system provided an excellent selectivity. Meanwhile, the anti-interference experiments were also evaluated by adding the mixture of ascorbic acid (0.5 mmol/L) with the other analytes (0.5 mmol/L) to the MoS2 QDs-MnO2 nanosheets system. As presented in Fig. 9B, the fluorescence recovery caused by the mixture was similar to that caused solely by ascorbic acid. That is, most of the substances do not interfere with the ascorbic acid detection, only glutathione and cysteine have certain interferences, which should be as a result of the reduction effect of sulphur in the structure of glutathione and cysteine. Fortunately, the glutathione and cysteine are also usually used to evaluate their health benefit as the good sources of natural antioxidants in fruits. These results proved that this fluorescence probe system for ascorbic acid has an excellent selectivity.

|
Download:
|
| Figure 9. (A) Fluorescence emission intensity of MoS2 QDs-MnO2 nanosheets system to 0.5 mmol/L ascorbic acid (AA) and 13 other analytes (10-fold concentration of AA). (B) Fluorescence emission intensity of MoS2 QDs-MnO2 nanosheets system to AA and 13 other analytes (0.5 mmol/L) in the presence of AA (0.5 mmol/L). The 13 potential interferences are: Na+, Mg2+, Cl-, citric acid (CA), vitamin B1 (VB1), glutathione (GSH), cysteine (Cys), lysine (Lys), glutamic acid (Glu), histidine (His), tryptophan (Try), serine (Ser), alanine (Ala), respectively. The error bar represents the average value ± the relative standard deviation (n= 3). | |
2.5. Analytical applications in fruit samples
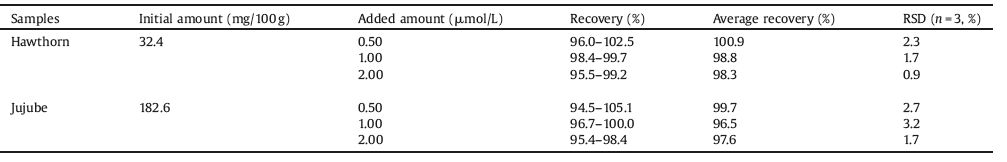
To examine the practical application of the proposed chemosensor, the determination of ascorbic acid concentration in various kinds of fruits was further explored. Because there have been a lot of reports relative to ascorbic acid determination in oranges and grapes, in this work, hawthorn and jujube were chosen as the potential dietary source for the daily supplement of ascorbic acid. As the results summarized in Table 2, the amounts of ascorbic acid in hawthorn and jujube detected by the fabricated "switch-on" fluorescence sensor were 32.4 and 182.6 mg/100 g, respectively. Under the optimal sensing conditions, the recovery experiments were carried out to evaluate the accuracy and reliability of the chemosensor. The average recoveries of ascorbic acid in hawthorn and jujube were found to be in the range of 98.3%-100.9% and 96.5%-99.7%, respectively. These results further indicated that the "switch-on" fluorescence sensor based on MoS2 QDs-MnO2 nanosheets system for monitoring ascorbic acid in practical fruit samples was reliable and feasible.
|
|
Table 2 Recovery test of ascorbic acid in hawthorn and jujube samples. |
3. Conclusion
In summary, we have successfully established a "switch-on" fluorescent sensor based on MoS2 QDs-MnO2 nanosheets system for a sensitive and selective detection of ascorbic acid in fruit samples. This method was mainly based on the fluorescence recovery in the presence of ascorbic acid resulted from the decomposition of MoS2 QDs-MnO2 nanosheets probe due to the strong reducibility of ascorbic acid. The MoS2 QDs having good luminescence properties were synthesized through simple and energy-saving hydrothermal route. Notably, the fabricated fluorescent sensing system has been successfully applied in the analysis of ascorbic acid in hawthorn and jujube. We believe that such a "switch-on" fluorescent probe was not only suitable for the detection of ascorbic acid in fruits, but also in the cell imaging and biological research field.
4. Experimental 4.1. MaterialsAscorbic acid and glutathione were purchased from J & K Scientific Ltd. (Beijing, China). Tetramethylammonium hydroxide pentahydrate (TMA·OH), NH4HCO3, H2O2 (30%), Na2MoO4·2H2O, Na2HPO4 and NaH2PO4 were purchased from Tianjin Guangfu Chemical Reagents Co., Ltd. (Tianjin, China). MnCl2·4H2O and HCl were bought from Chengdu Kelong Chemical Reagents Co., Ltd. (Chengdu, China). Citric acid, NaCl and MgCl2 were acquired from Sinopharm Chemical Reagent Co., Ltd. (Shanghai, China). Vitamin B1 and all amino acids were bought from Shenggong Biological Engineering Co., Ltd. (Shanghai, China). All chemicals were of analytical reagent grade and used without further purification. The ultra-pure water used throughout the experiments was purified through a 18202V AXL water purification system (Chongqing, China).
4.2. Apparatus and characterizationThe morphology and size of MoS2 QDs and MnO2 nanosheets are measured on a Hitachi-600 transmission electron microscope (TEM, Hitachi, Kyoto, Japan). The sample for TEM characterization was prepared by placing a drop of colloidal solution on a carboncoated copper grid and dried at room temperature. X-ray photoelectron spectra (XPS) were acquired with a PHI 5702 spectrometer equipped with an Al Ka exciting source. Time-resolved fluorescence spectra were carried out in a time-correlated-singlephoton-counting (TCSPC) system from FL920P spectrometer (Edinburgh Instruments, U.K.) with λex = 365 nm. The fluorescence emission spectra were recorded on an RF-5301PC spectrofluorometer using 5/5 nm slit width and equipped with a 1 cm quartz cell (Shimadzu, Kyoto, Japan). The absorption spectra were recorded on a TU-1901 double-beam UV-vis spectrophotometer (Purkine General Instrument Co., Ltd., Beijing, China) at room temperature.
4.3. Preparation of MoS2 QDsThe MoS2 QDs were synthesized using a simple one-step hydrothermal method with glutathione and sodium molybdate as the precursors. Briefly, 0.25 g Na2MoO4·2H2O was dissolved in 25 mL of ultrapure water and ultrasonicated for 5 min. Next, the solution was adjusted to pH 6.5 with 0.1 mol/L HCl. Then, 0.5 g glutathione was added to the solution followed by ultrasonication for 10 min. The mixture was then transferred into a 100 mL Teflonlined stainless steel autoclave and reacted at 200 ℃ for 36 h. After the solution cooled naturally, the supernatant containing MoS2 QDs was collected after being centrifuged for 5 min three times at the speed of 12, 000 rpm.
4.4. Preparation of MnO2 nanosheetsThe preparation of MnO2 nanosheets was according to the previously reported procedure [34]. In briefly, 2 mL of H2O2 (30%) and 12 mL of TMA·OH (1.0 mol/L) solution were mixed, and then the above mixture was added into 10 mL of MnCl2·4H2O (0.3 mol/L) within 15 s. The obtained dark brown mixture was stirred vigorously over night at room temperature in dark condition.
4.5. Sample pretreatmentHawthorns and fresh jujubes were purchased from a local supermarket in Lanzhou, China, and used immediately after treatment. The food samples were prepared according to a previous literature with a little modification [35]. First, the samples were washed with ultrapure water and naturally dried in air at room temperature. Then, they were accurately weighed and homogenized in a commercial blender. After centrifugation at 4 ℃ in a refrigerated centrifuge at 3000 rpm for 15 min, the final juices of hawthorns and fresh jujubes were diluted to 40 and 10 times, respectively. All of the samples were stored in a refrigerator at 4 ℃ for use.
4.6. Fluorescence detection of ascorbic acid in fruit samplesThe ascorbic acid concentration in hawthorns and fresh jujubes were determined according to the following steps: (a) 50μL of MoS2 QDs was dissolved in 2.95 mL of 10 μmol/L phosphate buffer solution (PBS, NaH2PO4-Na2HPO4, pH 8.0). And then, 80mL MnO2 nanosheets solution was added into the MoS2 QDs solution and incubated for 2 min so that the probe could be formed. (b) 500mL of sample solution was then added and mixed thoroughly. The resulting solution was maintained at room temperature for 5 min to hold the reaction completely. Finally, the spectra were recorded under excitation at 360 nm, and the slit widths were set at 5/5 nm.
AcknowledgementThis work was financially supported by National Nature Science Foundation of China (No. 21475053).
| [1] | J.A. Drisko, J. Chapman, V.J. Hunter, The use of antioxidants with first-line chemotherapy in two cases of ovarian cancer. J. Am. Coll. Nutr. 22 (2003) 118–123. DOI:10.1080/07315724.2003.10719284 |
| [2] | H.K. Choi, X. Gao, G. Curhan, Vitamin C intake and the risk of gout in men:a prospective study. Arch. Intern. Med. 169 (2009) 502–507. DOI:10.1001/archinternmed.2008.606 |
| [3] | A. Pardakhty, S. Ahmadzadeh, S. Avazpour, V.K. Gupta, Highly sensitive and efficient voltammetric determination of ascorbic acid in food and pharmaceutical samples from aqueous solutions based on nanostructure carbon paste electrode as a sensor. J. Mol. Liq. 216 (2016) 387–391. DOI:10.1016/j.molliq.2016.01.010 |
| [4] | M. Szultka, M. Buszewska-Forajta, R. Kaliszan, B. Buszewski, Determination of ascorbic acid and its degradation products by high-performance liquid chromatography-triple quadrupole mass spectrometry. Electrophoresis. 35 (2014) 585–592. DOI:10.1002/elps.201300439 |
| [5] | R. Sandulescu, S. Mirel, R. Oprean, The development of spectrophotometric and electroanalytical methods for ascorbic acid and acetaminophen and their applications in the analysis of effervescent dosage forms. J. Pharm. Biomed. Anal. 23 (2000) 77–87. DOI:10.1016/S0731-7085(00)00277-6 |
| [6] | N.E. Llamas, M.S.D. Nezio, B.S.F. Band, Flow-injection spectrophotometric method with on-line photodegradation for determination of ascorbic acid and total sugars in fruit juices. J. Food Comp. Anal. 24 (2011) 127–130. DOI:10.1016/j.jfca.2010.06.002 |
| [7] | M. Adam, P. Pavlíková, A. Cí žková, P. Bajerová, K. Ventura, Microextraction by packed sorbent (MEPS) as a suitable selective method for L-ascorbic acid determination in beverages. Food Chem. 135 (2012) 1613–1618. DOI:10.1016/j.foodchem.2012.06.039 |
| [8] | H. Filik, D. Aksu, D. Giray, R. Apak, Colourimetric solid-phase extraction coupled with fibre optic reflectance spectroscopy for determination of ascorbic acid in pharmaceutical formulations. Drug Test. Anal. 4 (2012) 493–499. DOI:10.1002/dta.v4.6 |
| [9] | B.D. Liu, L.Q. Luo, Y.P. Ding, Differential pulse voltammetric determination of ascorbic acid in the presence of folic acid at electro-deposited NiO/graphene composite film modified electrode. Electrochim. Acta. 142 (2014) 336–342. DOI:10.1016/j.electacta.2014.07.126 |
| [10] | K. Tyszczuk-Rotko, I. Bęczkowska, M. Wójciak-Kosior, I. Sowa, Simultaneous voltammetric determination of paracetamol and ascorbic acid using a borondoped diamond electrode modified with Nafion and lead films. Talanta. 129 (2014) 384–391. DOI:10.1016/j.talanta.2014.06.023 |
| [11] | L. Chen, X.M. Guo, B. Guo, S.K. Cheng, F. Wang, Electrochemical investigation of a metalloporphyrin-graphene composite modified electrode and its electrocatalysis on ascorbic acid. J. Electroanal. Chem. 760 (2016) 105–112. DOI:10.1016/j.jelechem.2015.11.018 |
| [12] | M.P. Kingsley, P.B. Desai, A.K. Srivastava, Simultaneous electro-catalytic oxidative determination of ascorbic acid and folic acid using Fe3O4 nanoparticles modified carbon paste electrode. J. Electroanal. Chem. 741 (2015) 71–79. DOI:10.1016/j.jelechem.2014.12.039 |
| [13] | Y.P. Dong, T.T. Gao, X.F. Chu, J. Chen, C.M. Wang, Flow injection-chemiluminescence determination of ascorbic acid based on luminol-ferricyanide-gold nanoparticles system. J. Lumin. 154 (2014) 350–355. DOI:10.1016/j.jlumin.2014.05.011 |
| [14] | K. Ariqa, K. Minami, L.K. Shrestha, Nanoarchitectonics for carbon-materialbased sensors. Analyst. 141 (2016) 2629–2638. DOI:10.1039/C6AN00057F |
| [15] | A.Q. Zhang, C.M. Lieber, Nano-bioelectronics. Chem. Rev. 116 (2016) 215–257. DOI:10.1021/acs.chemrev.5b00608 |
| [16] | P.F. Shen, Y.S. Xia, Synthesis-modification integration:one-step fabrication of boronic acid functionalized carbon dots for fluorescent blood sugar sensing. Anal. Chem. 86 (2014) 5323–5329. DOI:10.1021/ac5001338 |
| [17] | A.W. Zhu, Q. Qu, X.L. Shao, B. Kong, Y. Tian, Carbon-dot-based dual-emission nanohybrid produces a ratiometric fluorescent sensor for in vivo imaging of cellular copper ions. Angew. Chem. Int. Ed. 51 (2012) 7185–7189. DOI:10.1002/anie.201109089 |
| [18] | B. Kong, A.W. Zhu, C.Q. Ding, Carbon dot-based inorganic-organic nanosystem for two-photon imaging and biosensing of pH variation in living cells and tissues. Adv. Mater. 24 (2012) 5844–5848. DOI:10.1002/adma.201202599 |
| [19] | S.H. Fan, J. Shen, H. Wu, K.Z. Wang, A.G. Zhang, A highly selective turn-on colorimetric and luminescence sensor based on a triphenylamine-appended ruthenium(II) dye for detecting mercury ion. Chin. Chem. Lett. 26 (2015) 580–584. DOI:10.1016/j.cclet.2014.11.031 |
| [20] | Y. Zhang, Y.G. Gao, Y.D. Shi, [12]aneN3-based BODIPY as a selective and sensitive off-on sensor for the sequential recognition of Cu2+ ions and ADP. Chin. Chem. Lett. 26 (2015) 894–898. DOI:10.1016/j.cclet.2015.05.032 |
| [21] | B. Radisavljevic, A. Radenovic, J. Brivio, V. Giacometti, A. Kis, Single-layer MoS2 transistors. Nat. Nanotechnol. 6 (2011) 147–150. DOI:10.1038/nnano.2010.279 |
| [22] | S.X. Wu, Z.Y. Zeng, Q.Y. He, Electrochemically reduced single-layer MoS2 nanosheets:characterization, properties, and sensing applications. Small. 8 (2012) 2264–2270. DOI:10.1002/smll.201200044 |
| [23] | T.F. Jaramillo, K.P. Jørgensen, J. Bonde, Identification of active edge sites for electrochemical H2 evolution from MoS2 nanocatalysts. Science. 317 (2007) 100–102. DOI:10.1126/science.1141483 |
| [24] | H.T. Wang, Z.Y. Lu, S.C. Xu, Electrochemical tuning of vertically aligned MoS2 nanofilms and its application in improving hydrogen evolution reaction. Proc. Natl. Acad. Sci. U. S. A. 110 (2013) 19701–19706. DOI:10.1073/pnas.1316792110 |
| [25] | T. Stephenson, Z. Li, B. Olsen, D. Mitlin, Lithium ion battery applications of molybdenum disulfide (MoS2) nanocomposites. Energy Environ. Sci. 7 (2014) 209–231. DOI:10.1039/C3EE42591F |
| [26] | T.Y. Wang, H.C. Zhu, J.Q. Zhuo, Biosensor based on ultrasmall MoS2 nanoparticles for electrochemical detection of H2O2 released by cells at the nanomolar level. Anal. Chem. 85 (2013) 10289–10295. DOI:10.1021/ac402114c |
| [27] | L.P. Hansen, Q.M. Ramasse, C. Kisielowski, Atomic-scale edge structures on industrial-style MoS2 nanocatalysts. Angew. Chem. Int. Ed. 50 (2011) 10153–10156. DOI:10.1002/anie.201103745 |
| [28] | W.H. Dai, H.F. Dong, B. Fugetsu, Tunable fabrication of molybdenum disulfide quantum dots for intracellular microRNA detection and multiphoton bioimaging. Small. 11 (2015) 4158–4164. DOI:10.1002/smll.v11.33 |
| [29] | Y. Wang, Y.N. Ni, Molybdenum disulfide quantum dots as a photoluminescence sensing platform for 2,4,6-trinitrophenol detection. Anal. Chem. 86 (2014) 7463–7470. DOI:10.1021/ac5012014 |
| [30] | D. Gopalakrishnan, D. Damien, M.M. Shaijumon, MoS2 quantum dotinterspersed exfoliated MoS2 nanosheets. ACS Nano. 8 (2014) 5297–5303. DOI:10.1021/nn501479e |
| [31] | X.F. Liu, T. Xu, X. Wu, Top-down fabrication of sub-nanometre semiconducting nanoribbons derived from molybdenum disulfide sheets. Nat. Commun. 4 (2013) 1776. DOI:10.1038/ncomms2803 |
| [32] | B. Chen, Y.B. Ding, X. Li, Steric hindrance-enforced distortion as a general strategy for the design of fluorescence "turn-on" cyanide probes. Chem. Commun. 49 (2013) 10136–10138. DOI:10.1039/c3cc46008h |
| [33] | Y.S. Xie, Y.B. Ding, X. Li, Selective, sensitive and reversible "turn-on" fluorescent cyanide probes based on 2,2'-dipyridylaminoanthracene-Cu2+ ensembles. Chem. Commun. 48 (2012) 11513–11515. DOI:10.1039/c2cc36140j |
| [34] | K. Kai, Y. Yoshida, H. Kageyama, Room-temperature synthesis of manganese oxide monosheets. J. Am. Chem. Soc. 130 (2008) 15938–15943. DOI:10.1021/ja804503f |
| [35] | Y.L. Xu, X.Y. Niu, H.J. Zhang, Switch-on fluorescence sensing of glutathione in food samples based on a graphitic carbon nitride quantum dot (g-CNQD)-Hg2+ chemosensor. J. Agric. Food Chem. 63 (2015) 1747–1755. DOI:10.1021/jf505759z |
| [36] | D.Y. Pan, J.C. Zhang, Z. Li, M.H. Wu, Hydrothermal route for cutting graphene sheets into blue-luminescent graphene quantum dots. Adv. Mater. 22 (2010) 734–738. DOI:10.1002/adma.v22:6 |
| [37] | A. Jaiswal, S.S. Ghosh, A. Chattopadhyay, One step synthesis of C-dots by microwave mediated caramelizationof poly(ethyleneglycol). Chem. Commun. 48 (2012) 407–409. DOI:10.1039/C1CC15988G |
| [38] | S.N. Baker, G.A. Baker, Luminescent carbon nanodots:emergent nanolights. Angew. Chem. Int. Ed. 49 (2010) 6726–6744. DOI:10.1002/anie.200906623 |
| [39] | W.Y. Zhai, C.X. Wang, P. Yu, Y.X. Wang, L.Q. Mao, Single-layer MnO2 nanosheets suppressed fluorescence of 7-hydroxycoumarin:mechanistic study and application for sensitive sensing of ascorbic acid in vivo. Anal. Chem. 86 (2014) 12206–12213. DOI:10.1021/ac503215z |
| [40] | Y.X. Yuan, S.F. Wu, F. Shu, Z.H. Liu, An MnO2 nanosheet as a label-free nanoplatform for homogeneous biosensing. Chem. Commun. 50 (2014) 1095–1097. DOI:10.1039/C3CC47755J |
| [41] | X.X. Wang, P. Wu, X.D. Hou, Y. Lv, An ascorbic acid sensor based on proteinmodified Au nanoclusters. Analyst. 138 (2013) 229–233. DOI:10.1039/C2AN36112D |
| [42] | N. Li, Y.H. Li, Y.Y. Han, A highly selective and instantaneous nanoprobe for detection and imaging of ascorbic acid in living cells and in vivo. Anal. Chem. 86 (2014) 3924–3930. DOI:10.1021/ac5000587 |
| [43] | M. Zheng, Z.G. Xie, D. Qu, On-off-on fluorescent carbon dot nanosensor for recognition of chromium(VI) and ascorbic acid based on the inner filter effect. ACS Appl. Mater. Interfaces. 5 (2013) 13242–13247. DOI:10.1021/am4042355 |