 2017, Vol. 28


b Analytical & Testing Center, Sichuan University, Chengdu 610064, China
Mercury contamination poses serious threats to public health globally because of its long distance transportation, persistent toxic and bio-accumulative characteristics [1-3]. In October 2013, governments from 92 countries signed the United Nations Environment Programme (UNEP) Minamata Convention on mercury to prevent from increasing mercury emission from the anthropogenic activities [4]. In order to monitor mercury emission, a variety of methods have been developed for the determination of mercury including electrothermal atomic absorption spectrometry (ET-AAS) [5], cold vapor generation atomic absorption spectrometry/atomic fluorescence spectrometry (CVG-AAS/AFS) [6-8] and inductively coupled plasma optical emission spectrometry/mass spectrometry (ICP-OES/MS) [9, 10]. Although these methods can meet the requirement of mercury routine analysis, the used instrumentations are large, expensive, gas and power consuming and not suitable for real-time field analysis of mercury. Significant efforts have been devoted to develop portable, inexpensive and accurate methods for field analysis of mercury, which include colorimetric or fluorescent sensor systems [11-14]. Although these approaches can partly overcome the mentioned drawbacks occurred in the atomic spectrometric techniques, most of them remain several limitations including serious interferences from similar metal ions, insufficient sensitivity (limit of detection, LOD > 100 nmol-1) and the need of carefully designed and expensive DNA probes.
Recently, some atomic spectrometers were successfully miniaturized and used for the determination of trace mercury in various samples [15-25]. Among these, miniaturized plasma OES are preferred because of their small size, elimination of light source, low power and gas consumption. These microplasmas include dielectric barrier discharge (DBD) [15-18], microstrip microwave-induced plasma (MIP) [19-21], direct current atmospheric pressure glow microdischarge (dc-μAPGD) [22], electrolyte cathode discharge (ELCAD) [23, 24], and capacitively coupled plasma (CCP) [25]. Unfortunately, all the reported microplasmas are seriously influenced even extinguished by high concentration of condense water or hydrogen due to their low atomization/ excitation capability. The analytical performance of microplasma OES would be significantly improved if analytes can be converted to “dry” state species without generating hydrogen prior to introduction to microplasma [26]. CVG is considered as the most mature technique to accomplish this purpose because it not only alleviates the spectral or matrix interferences arising from liquid phase but also provides an almost 100% sample introduction efficiency [14-20]. However, the conventional CVG techniques using SnCl2-HCl or sodium hydroborate (NaBH4) -HCl system either generate hydrogen or use relatively toxic, unstable and expensive reagents. Photochemical vapor generation (PVG) has been recently proved that can be used to transport mercury vapor to microplasma without using toxic chemicals and generating hydrogen and thus significantly improve analytical performance [27], whereas the power consumption ( >20 W) and size of UV photoreactor are strangling its further evolution in microplasma OES. Therefore, it is still a great challenge to develop a simple, environmentally friendly and low power consuming CVG technique for microplasma OES. Recently, microplasma induced CVG was developed to determine Hg, I, Os, Cd and Zn, including solution cathode glow discharge (SCGD) induced CVG, liquid electrode glow discharge (LEGD) induced CVG and dielectric barrier discharge induced (DBDI) CVG [28-32]. Due to their low power consumption (<10 W) and small size of both cold vapor generator and detection system, we believe that microplasma induced CVG coupling to microplasma OES retains a great potential in the real time field analysis of mercury. To the best of our knowledge, however, there are no reports using microplasma induced CVG coupled with microplasma OES for elemental determination.
Therefore, the purpose of the present work was to utilize flow injection thin film (TF) DBDI-CVG to couple with a DBD-OES for the detection of mercury in water samples. Mercury cold vapor (Hg0) generated from the TF-DBDI-CVG system can be efficiently and rapidly separated from liquid phase and transported to the DBD microplasma for further atomization/excitation without introducing moisture and hydrogen. Thus the analytical performance particularly LOD could be significantly improved to 0.2 μg-1, which much lower than the maximum allowable concentration by World Health Organization (5 μg-1) . It is worth to note that the DBDI-CVG and the DBD-OES can simultaneously work by sharing one single power supply. Therefore, the instrumental setup could be further miniaturized and the power consumption was reduced to about 10 W, which make the proposed system retain great potential for the real time field analysis of mercury.
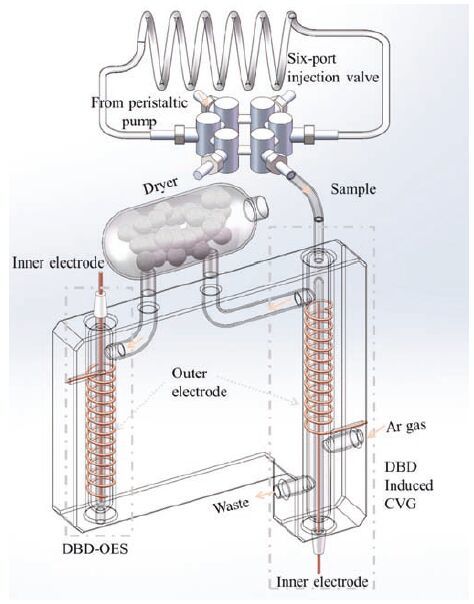
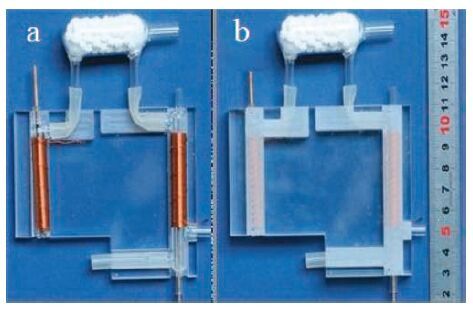
2. Experimental 2.1. InstrumentationThe full instrumental setup is shown in Fig. 1 and mainly consists of a flow injection TF-DBDI-CVG system, a cylindrical dryer filled with CaCl2 and a DBD-OES. The flow injection TF-DBDICVG system comprises a peristaltic pump (BT100-02, Baoding Qili Precision Pump Co., Ltd.), a six-port injection valve (Genuine Rheodyne Co., USA) equipped with a 3.0 mL sampling loop and a TF-DBDI-CVG reactor. The reactor integrates both cold vapor generation and gas liquid separation functions and is constructed according to the previous work [32]. Briefly, a copper wire (1.7 mm in diameter) housed in a small quartz tube (2.0 mm i.d. × 4.0 mm o. d. × 60 mm in length) is used as inner electrode and inserted into a big quartz tube (6.0 mm i.d. × 8.0 mm o.d. × 75 mm in length). The big quartz tube is tightly and evenly wrapped with copper wire (0.4 mm in diameter), which is used as outer electrode. Sample solution is introduced to the reactor, yielding a thin liquid film on the outer surface of the small quartz tube. The thin liquid film not only increases the plasma-liquid interaction area but also facilitates rapid escape of mercury vapor from the liquid phase. The DBD-OES is similar to that reported in previous work [33] and consists of a DBD excitation source and a commercial hand-held charge coupled device (CCD) spectrometer (Maya 2000 Pro, Ocean Optics Inc., Dunedin, FL, USA) with 0.4 nm of spectral resolution and a detectable spectral range from 200 to 600 nm. The DBD excitation source consists of a quartz tube (4.0 mm i.d. × 6.0 mm o. d. × 60 mm in length) and two copper wire electrodes, which one (1.7 mm in diameter) inserted into a quartz tube (2.0 mm i. d. × 4.0 mm o.d. × 45 mm in length) is used as inner electrode and the other (0.4 mm in diameter) tightly wrapped around the outer side of the tube is used as outer electrode, respectively. In order to miniaturize and immobilize the instrumentation, the DBDI-CVG reactor and DBD-OES were finally integrated on a small polymethyl methacrylate (PMMA) plate (10.5 cm length × 8.0 cm width × 1.2 cm height). The photograph of the DBDI-CVG-DBD-OES is showed in Fig. 2. A compact ac neon sign electron transformer power supply (NGB408BL, Electronic Equipment Factory of Jinshi, Guangzhou, China; 14 cm length × 6 cm width × 5 cm height, with a rated output of 8 kV, 30 kHz, and 24 W at 220 V, 60 Hz input) was used to supply power to both the DBDI-CVG reactor and DBD excitation source for generating and sustaining their plasma. The optical emission of mercury from the DBD excitation source is focused onto an optical fiber, and finally recorded with the CCD spectrometer.

|
Download:
|
| Figure 1. Schematic of the experimental set-up. | |

|
Download:
|
| Figure 2. The photographs of the DBDI-CVG-DBD-OES. (a) Uncovered; (b) covered. | |
2.2. Reagents and samples
High purity 18.2 MV cm deionized water (DIW) produced from a water purification system (Chengdu Ultrapure Technology Co., Ltd., China) was used for preparation of all solutions. 1000 μg-1 stock standard solution of mercury (GBW08617) was obtained from National Research Centre for Certified Reference Materials, China. Calibration solutions were prepared daily by dilution of the stock standard solution with DIW and formic acid (88%, Kelong Chemical Factory, China). Other inorganic salts used to investigate their interferences on DBDI-CVG were also obtained from Kelong Chemical Factory. High purity argon (99.99%) was purchased from Qiaoyuan Gas Co. (Chengdu, China).
Three water samples were collected from three rivers (Sha River, Fu River and Nan River) of Chengdu City, respectively. These samples were stored in 100 mL quartz bottles and analyzed immediately after transport to the laboratory.
2.3. Analytical procedureDIW carrier solution was initially pumped to the DBDI-CVG reactor and then the DBD plasmas of both the reactor and the excitation source were ignited and stabilized for about 3 min. Then, sample or standard solutions of mercury were directed into the 3.0 mL sample loop through the six-port valve with the aid of the peristaltic pump at a flow rate of 3.0 mL min-1. The valve was activated to introduce DIW so as to flush the analyte solution into the DBDI-CVG reactor. The analyte solution formed thin film liquid and exposed to the plasma irradiation for the generation of mercury vapor (Hg0) in the reactor. After that, the generated Hg0 was rapidly separated from liquid phase and swept to the dryer to remove any water vapor by argon flow. Finally, Hg0 was transported to the DBD excitation source for atomization and excitation, and the optical emission of mercury atom at 253.7 nm was measured by the CCD spectrometer.
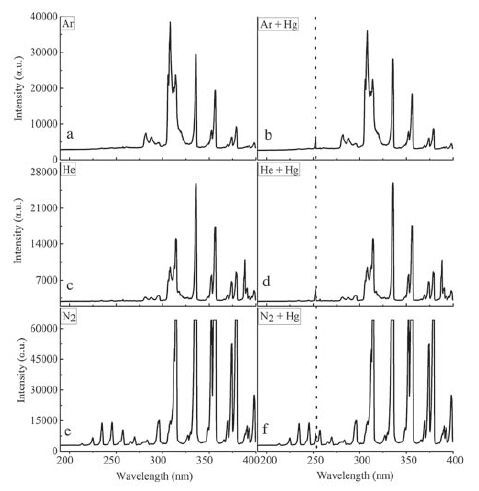
3. Results and discussion 3.1. Evaluation of the practicability of TF-DBDI-CVG-DBD-AESAlthough coupling DBDI-CVG to DBD-OES can significantly miniaturize instrumental setup and reduce power consumption, this is the first report of use of this system for quantitative analysis. Therefore, an initial experiment was undertaken to evaluate the feasibility and practicability of DBDI-CVG-DBD-OES for the determination of mercury. A 3 mL blank or 100mg -1 of mercury standard solution was introduced to the DBDI-CVG reactor and exposed to the plasma irradiation, respectively. A 300 mL min-1 of argon flow was introduced to sweep the generated volatile species into the DBD-OES for their emission spectrometric detection. It should be noted that no formic acid was added into the blank and the standard solution. The emission spectrums from the blank and the standard solution are summarized in Fig. 3a and b, respectively. The results show that typical molecular emission bands of OH (283, 309 nm), NH (337 nm), and N2 (316, 358 and 380 nm) were found in the both spectrum obtained from blank and standard solution, which is agree well with the previous works [27, 33]. Compared to the emission spectrum of blank, obvious specific atomic emission lines of mercury at 253.7 nm were observed in the emission spectrum obtained by injecting 3 mL of 100mg -1 mercury standard solution. Moreover, the linear coefficient of the typical calibration curve of the intensity of mercury atomic emission at 253.7 nm versus mercury concentration is better than 0.99. These support the feasibility of this method for mercury analysis.

|
Download:
|
| Figure 3. Atomic or molecular emission spectrum obtained using DBDI-CVG-DBD-OES under different discharge gas. (a) Ar; (b) Ar + 100 μg-1 Hg; (c) He; (d) He + 100 μg-1Hg; (e) N2; (f) N2 + 100 μg-1 Hg. | |
3.2. Optimization of operation parameters for TF-DBDI-CVG-DBD-AES
To obtain the optimum analytical performance, the parameters both affecting DBDI-CVG efficiency and DBD excitation capability were investigated including the type and flow rate of discharge gas, discharge voltage, the concentration of formic acid and sample flow rate. Previous works [27, 33] reported that the type and flow rate of discharge gas strongly affected the analytical performance of DBD-OES. In this work, discharge gas is not only used to generate and sustain DBD plasma for the generation and excitation of Hg0 but also acts as carrier gas to separate the generated vapor from liquid phase and further transport it to the detector, so as to seriously influence the CVG efficiency of mercury, the efficiency of gas-liquid separation, the atomization/excitation capability of DBD-OES, the analyte concentration in the carrier gas, and its residence time in the DBD excitation source. Ar, He and N2 were tested as the discharge gas to investigate their effects on emission response of mercury atom. The results are summarized in Fig. 3 and show both the atomic emission line of mercury at 253.7 nm and other typical molecular emission bands found in DBD plasma can be obviously detected regardless of the use of the discharge gas. The effects of the flow rate of Ar, He and N2 on response were studied (Fig. 4a). The optimum carrier gas flow rates for Ar, He and N2 are 300, 200 and 200 mL min-1, respectively. Lower flow rate could not generate stable DBD plasma; and higher flow rate resulted in significant dilution of analyte in the carrier gas and plasma cooling. Although N2 is the cheapest among these tested gases, it generates strong emission bands in the spectral range 200-400 nm (Fig. 2) , which results in serious spectral interference for the determination of mercury. Finally, 300 mL min-1 of Ar flow was chosen as discharge gas in this work because it is relatively inexpensive than helium.

|
Download:
|
| Figure 4. Effect of instrumental parameters on the responses of Hg obtained by flow injection DBDI-CVG-DBD-OES. (a) Type and flow rate of discharge gas; (b) discharge voltage; (c) sample flow rate; (d) concentration of formic acid. | |
In order to separately investigate the effects of the discharge voltages of DBDI-CVG and DBD-OES, two power supply systems were used to provide power for the CVG reactor and the DBD-OES, respectively. The effect of the discharge voltage of DBDI-CVG on the signal response was investigated by fixing the discharge voltage of DBD-OES at 50 V, with results shown in Fig. 4b. Response increased significantly with the increasing input voltage throughout the range 40-60 V followed by a slight decrease at higher voltage. Thus, a 60 V discharge voltage of DBDI-CVG was used to investigate the effect of the discharge of DBD-OES on the signal response, as shown in Fig. 4b. Finally, a 60 V discharge voltage was selected for DBD-OES in consideration of both minimization of power consumption and simplification of the whole analytical system by sharing one single power supply. It is worth to note the total power consumption is about 10 W when 60 V discharge voltage was used for both DBDI-CVG and DBD-OES, which makes the proposed system retains great potential for environmentally friendly and real time field analysis of mercury.
Ideally, the analyte response should increase linearly with sample introduction flow rate until saturation occurs due to the cause of detector function. However, sample flow rate of this system not only significantly affects the sample mass introduced into the DBD-CVG reactor but also influences the residence time of solution in the area of plasma irradiation. The effect of sample flow rate on the signal response is summarized in Fig. 4c. A 3 mL min-1 of sample flow rate was selected to the subsequent experiments.
The previous works [27, 31] reported low molecular weight organic compounds could significantly increase the PVG or SCGD Fig. 4 induced CVG efficiency of mercury. Therefore, the effect of concentration of formic acid on the signal response was investigated, as shown in Fig. 4d. It is of great interest that obvious signal response was observed in the absence of formic acid. Recently, Richmonds and Sankaran [34-36] found that argon microplasma jet could be used to reduce some metal ions to their colloidal metals, ferricyanide ions to ferrocyanide ions and protons to hydrogen. After careful investigation, they considered these phenomena were attributed to the electron-transfer between the nonthermal atmospheric pressure microplasma and liquid surface. Therefore, it is speculated that the electron-transfer reaction could convert Hg2+ to mercury cold vapor (Hg0) even in high purity DIW medium. To our best knowledge, only electrochemical CVG can be used for the real sample analysis without using any chemicals. However, careful selection of the cathode material and frequent cleaning of the electrode are needed to increase reproducibility and minimize memory effects. It is worth to note that the disadvantages of electrochemical CVG can be completely solved by the proposed technique because the two electrodes of DBDI-CVG are protected by the dielectric barrier (quartz tube). Response increased significantly with increasing concentration of formic acid throughout the range 0-0.5% (v/v), finally obtained about 3-fold of improvements on sensitivity compared to that obtained without using formic acid. This is probably because low concentration of formic acid provides more reducing radicals under DBD plasma irradiation; higher concentration of formic acid produces volatile organic compounds and disturbs the DBD plasma. Therefore, 0.5% (v/v) of formic acid was chosen for improving the analytical performance of the proposed system.
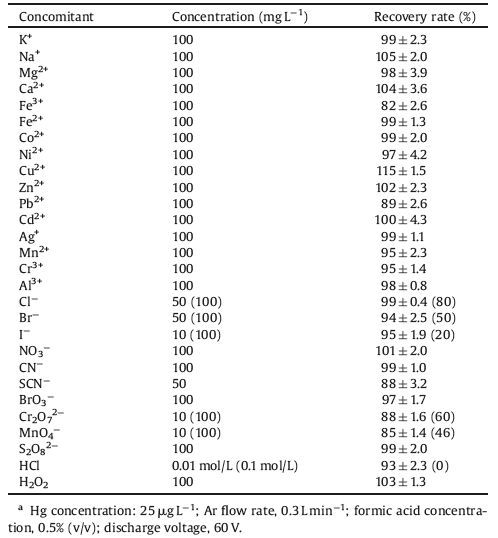
3.3. Interference from concomitantsA major disadvantage of conventional CVG is the serious interferences from coexisting ions, particularly from transition and noble metal ions. To evaluate the analytical applicability of the proposed system, the effects of a series of concomitants on response was carefully studied, with results summarized in Table 1. No significant interference from most of the tested ions was detected, even at their concentration as high as 100 μg-1. For oxidizing ions, although the response decreased to 60% and 46% at 100 μg-1 of Cr2O72- and MnO4-, respectively, the interferences from 10 μg-1 of these ions were negligible. These results demonstrated that the proposed system has higher tolerable levels to transition metal ions and oxidizing agents. Unfortunately, 0.1 mol-1 hydrochloric acid could completely suppress the mercury response, which agree well with those occurred in PVG and ultrasound induced CVG [27]. Other halide ions including Cl-, Br- and I- also resulted in obvious interferences at their high concentration because of the formation of strong complexes of mercury and halide ions. Therefore, it is necessary to separated Hg2 + from the sample matrix prior to analysis using the proposed system if the samples containing high concentration of halide ions and oxidizing ions.
|
|
Table 1 Effect of concomitants on DBDI-Hg VG.a |
3.4. Figures of merit and potential applications
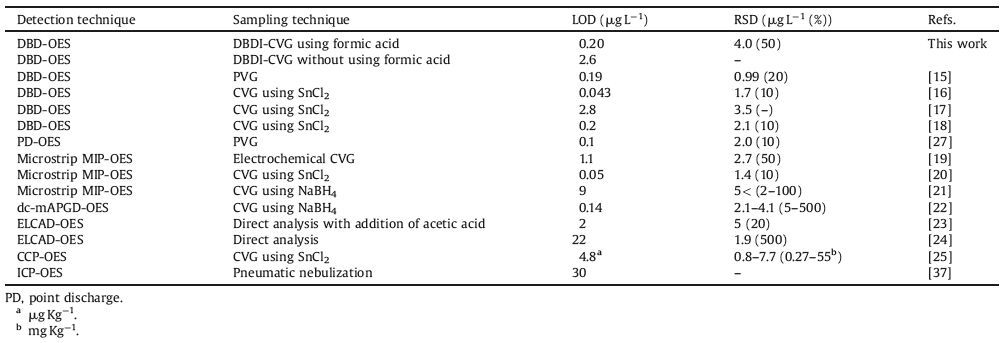
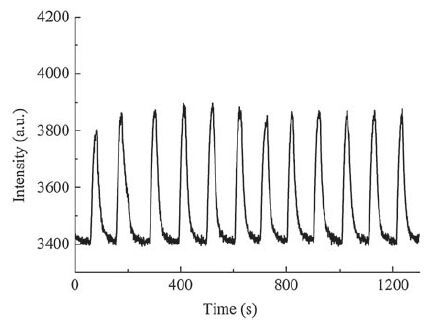
Analytical figures of merit were evaluated under optimal experimental conditions. Typical calibration curve was established by analyzing a series of mercury standard solutions with or without using formic acid, as shown in Fig. 5. The linear correlation coefficients (R2) of the calibration curves were better than 0.99. The limits of detection (LOD), defined as the analytes concentration calculated by using the three-fold standard deviation of 11 measurements of a blank solution divided by the slope of the calibration curve, were found to be 0.20 μg-1 and 2.6 μg-1 for the proposed system with and without using formic acid, respectively. The linear range of the calibration curve can be extended to 500 μg-1 and 2500 μg-1, respectively. Fig. 6 illustrates steady-state signals obtained for the replicate measurements of 50 μg-1 mercury using the DBDI-CVG-DBD-OES, yielding precision of 4.0% RSD (based on 11 measurements). Table 2 summarizes the figures of merit achieved with the proposed system as compared to those arising from similar microplasma OES. The proposed system not only retains a comparable even better LOD than those obtained by the reported microplasma OES but provides several unique advantages including more portable, lower power consumption and greener analytical chemistry.

|
Download:
|
| Figure 5. Calibration curve and temporal profiles of the DBDI-CVG-DBD-OES with (a and b) or without formic acid (c and d). | |

|
Download:
|
| Figure 6. Temporal emission profiles of 11 replicate measurements of 50 μg-1 mercury. Experimental conditions: discharge voltage, 60 V; Ar flow rate, 300 mL min-1; formic acid concentration, 0.5% (v/v). | |
|
|
Table 2 Analytical figures of merit in comparison with those of other methods. |
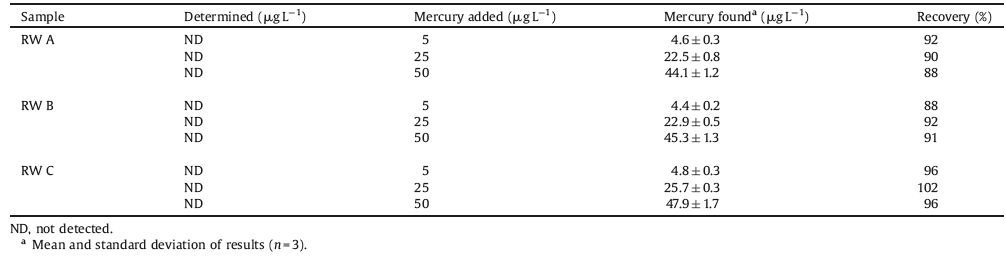
Due to the serious interferences from chloride and high concentration of oxidizing agents, the proposed system cannot be directly used for the determination of trace or ultra-trace mercury in those samples required complete digestion using HCl, HNO3 and other oxidizing reagents prior to analysis. Therefore, the utility and accuracy of the proposed system were validated by determination of Hg in three river water. It was necessary to spike the river samples with various concentration of mercury because their endogenous concentrations were far below the LOD of the proposed system. The analytical results are summarized in Table 3, and show that good recoveries (88-102%) of mercury could be achieved. A Certified Reference Material (CRM) of water sample GBW (E) 080393 (certified Hg concentration: 100 ± 4 μg-1, containing 0.05% K2Cr2O7) was used to further validated the accuracy and practicability of the proposed system. Due to the serious interferences from Cr2O72-, this ion was removed by using TiO2 according to the previously reported method [38], prior to analysis. The t-test also showed that the analytical results obtained by the proposed system (93 ± 3 μg-1) were not significantly different from the certified values at the confidence level of 95%.
|
|
Table 3 Analytical results of Hg in river water (RW) samples. |
4. Conclusion
A sensitive, environmentally friendly, low power consumption, compact and miniaturized OES system integrated flow injection DBDI-CVG and DBD-OES was developed for the determination of trace mercury in water samples. The proposed system not only retains the advantages of the reported microplasma OES but also eliminates the disadvantages of the conventional CVG techniques such as production of hydrogen, use of toxic or unstable reductant. In addition, the DBDI-CVG and DBD-OES of the proposed system can integrate in a miniature plate. The power consumption of the whole system is about 10 W, which makes the system can be operated by a mobile battery. These imply that the proposed system retains great potential in field mercury analysis.
Author contributionsThe manuscript was written through contributions of all authors. All authors have given approval to the final version of the manuscript.
AcknowledgementWe gratefully acknowledge the National Natural Science Foundation of China (No. 21575092) for financial support.
| [1] | C.H. Lamborg, C.R. Hammerschmidt, K.L. Bowman, et al., A global ocean inventory of anthropogenic mercury based on water column measurements, Nature 512(2014) 65-68. |
| [2] | R.K. Zalups, C.C. Bridges, Relationships between the renal handling of DMPS and DMSA and the renal handling of mercury. Chem. Res. Toxicol. 25 (2012) 1825–1838. DOI:10.1021/tx3001847 |
| [3] | P.A. Ariya, M. Amyot, A. Dastoor, Mercury physicochemical and biogeochemical transformation in the atmosphere and at atmospheric interfaces:a review and future directions. Chem. Rev. 115 (2015) 3760–3802. DOI:10.1021/cr500667e |
| [4] | UNEP, Minamata convention on mercury, United Nations Environment Programme, Geneva, Switzerland, 2013. |
| [5] | M.T. Peng, Z.A. Li, X.D. Hou, C.B. Zheng, In-atomizer atom trapping on gold nanoparticles for sensitive determination of mercury by flow injection cold vapor generation atomic absorption spectrometry. J. Anal. At. Spectrom. 29 (2014) 367–373. DOI:10.1039/C3JA50286D |
| [6] | Y. Gao, Z.M. Shi, Z. Long, Determination and speciation of mercury in environmental and biological samples by analytical atomic spectrometry. Microchem. J. 103 (2012) 1–14. DOI:10.1016/j.microc.2012.02.001 |
| [7] | J. Huber, L.E. Heimbürger, J.E. Sonke, Nanogold-decorated silica monoliths as highly efficient solid-phase adsorbent for ultratrace mercury analysis in natural waters. Anal. Chem. 87 (2015) 11122–11129. DOI:10.1021/acs.analchem.5b03303 |
| [8] | M. Campanella, A. Onor, S. D'Ulivo, E. Giannarelli, Impact of protein concentration on the determination of thiolic groups of ovalbumin:a size exclusion chromatography-chemical vapor generation-atomic fluorescence spectrometry study via mercury labeling. Anal. Chem. 86 (2014) 2251–2256. DOI:10.1021/ac4041795 |
| [9] | D.Y. Deng, S. Zhang, H. Chen, Online solid sampling platform using multiwall carbon nanotube assisted matrix solid phase dispersion for mercury speciation in fish by HPLC-ICP-MS. J. Anal. At. Spectrom. 30 (2015) 882–887. DOI:10.1039/C4JA00436A |
| [10] | H. Wang, B.B. Chen, S.Q. Zhu, Chip-based magnetic solid-phase microextraction online coupled with microHPLC-ICPMS for the determination of mercury species in cells. Anal. Chem. 88 (2016) 796–802. DOI:10.1021/acs.analchem.5b03130 |
| [11] | K. Saha, S.S. Agasti, C. Kim, X.N. Li, V.M. Rotello, Gold nanoparticles in chemical and biological sensing. Chem. Rev. 112 (2012) 2739–2779. DOI:10.1021/cr2001178 |
| [12] | E.M. Nolan, S.J. Lippard, Tools and tactics for the optical detection of mercuric ion. Chem. Rev. 108 (2008) 3443–3480. DOI:10.1021/cr068000q |
| [13] | H.N. Kim, W.X. Ren, J.S. Kim, J. Yoon, Fluorescent and colorimetric sensors for detection of lead, cadmium, and mercury ions. Chem. Soc. Rev. 41 (2012) 3210–3244. DOI:10.1039/C1CS15245A |
| [14] | Y. Liu, E.B. Yang, R. Han, et al., A new rhodamine-based fluorescent chemosensor for mercury in aqueous media, Chin. Chem. Lett. 25(2014) 1065-1068. |
| [15] | H.Y. He, Z.L. Zhu, H.T. Zheng, Dielectric barrier discharge micro-plasma emission source for the determination of thimerosal in vaccines by photochemical vapor generation. Microchem. J. 104 (2012) 7–11. DOI:10.1016/j.microc.2012.03.022 |
| [16] | Z.L. Zhu, G.C.Y. Chan, S.J. Ray, X.R. Zhang, G.M. Hieftje, Microplasma source based on a dielectric barrier discharge for the determination of mercury by atomic emission spectrometry. Anal. Chem. 80 (2008) 8622–8627. DOI:10.1021/ac801531j |
| [17] | W.S. Abdul-Majeed, J.H.L. Parada, W.B. Zimmerman, Optimization of a miniaturized DBD plasma chip for mercury detection in water samples. Anal. Bioanal. Chem. 401 (2011) 2713–2722. DOI:10.1007/s00216-011-5118-9 |
| [18] | Y.L. Yu, Z. Du, M.L. Chen, J.H. Wang, Atmospheric-pressure dielectric-barrier discharge as a radiation source for optical emission spectrometry. Angew. Chem. Int. Ed. 47 (2008) 7909–7912. DOI:10.1002/anie.v47:41 |
| [19] | V. Červený, M. Horváth, J.A.C. Broekaert, Determination of mercury in water samples by electrochemical cold vapor generation coupled to microstrip microwave induced helium plasma optical emission spectrometry. Microchem. J. 107 (2013) 10–16. DOI:10.1016/j.microc.2012.05.023 |
| [20] | U. Engel, A.M. Bilgiç, O. Haase, E. Voges, J.A. Broekaert, A microwave-induced plasma based on microstrip technology and its use for the atomic emission spectrometric determination of mercury with the aid of the cold-vapor technique, Anal. Chem. 72(2000) 193-197. |
| [21] | P. Pohl, I.J. Zapata, E. Voges, N.H. Bings, J.A.C. Broekaert, Comparison of the cold vapor generation using NaBH4 and SnCl2 as reducing agents and atomic emission spectrometry for the determination of Hg with a microstrip microwave induced argon plasma exiting from the wafer. Microchim. Acta 161 (2008) 175–184. DOI:10.1007/s00604-007-0887-8 |
| [22] | K. Greda, P. Jamroz, P. Pohl, Coupling of cold vapor generation with an atmospheric pressure glow microdischarge sustained between a miniature flow helium jet and a flowing liquid cathode for the determination of mercury by optical emission spectrometry. J. Anal. At. Spectrom. 29 (2014) 893–902. DOI:10.1039/c3ja50395j |
| [23] | R. Shekhar, Improvement of sensitivity of electrolyte cathode discharge atomic emission spectrometry (ELCAD-AES) for mercury using acetic acid medium. Talanta 93 (2012) 32–36. DOI:10.1016/j.talanta.2012.02.004 |
| [24] | M.R. Webb, F.J. Andrade, G.M. Hieftje, Compact glow discharge for the elemental analysis of aqueous samples. Anal. Chem. 79 (2007) 7899–7905. DOI:10.1021/ac070789x |
| [25] | T. Frentiu, A.I. Mihaltan, M. Senila, New method for mercury determination in microwave digested soil samples based on cold vapor capacitively coupled plasma microtorch optical emission spectrometry:comparison with atomic fluorescence spectrometry. Microchem. J. 110 (2013) 545–552. DOI:10.1016/j.microc.2013.06.009 |
| [26] | X.M. Jiang, Y. Chen, C.B. Zheng, X.D. Hou, Electrothermal vaporization for universal liquid sample introduction to dielectric barrier discharge microplasma for portable atomic emission spectrometry. Anal. Chem. 86 (2014) 5220–5224. DOI:10.1021/ac500637p |
| [27] | S. Zhang, H. Luo, M.T. Peng, Determination of Hg, Fe Ni, and Co by miniaturized optical emission spectrometry integrated with flow injection photochemical vapor generation and point discharge. Anal. Chem. 87 (2015) 10712–10718. DOI:10.1021/acs.analchem.5b02820 |
| [28] | Z.A. Li, Q. Tan, X.D. Hou, K.L. Xu, C.B. Zheng, Single drop solution electrode glow discharge for plasma assisted-chemical vapor generation:sensitive detection of zinc and cadmium in limited amounts of samples. Anal. Chem. 86 (2014) 12093–12099. DOI:10.1021/ac502911p |
| [29] | Z.L. Zhu, G.C.Y. Chan, S.J. Ray, X.R. Zhang, G.M. Hieftje, Use of a solution cathode glow discharge for cold vapor generation of mercury with determination by ICP-atomic emission spectrometry. Anal. Chem. 80 (2008) 7043–7050. DOI:10.1021/ac8011126 |
| [30] | Z.L. Zhu, Q. He, Q. Shuai, H.T. Zheng, S.H. Hu, Solution cathode glow discharge induced vapor generation of iodine for determination by inductively coupled plasma optical emission spectrometry. J. Anal. At. Spectrom. 25 (2010) 1390–1394. DOI:10.1039/b927298d |
| [31] | X. Wu, W.L. Yang, M.G. Liu, X.D. Hou, C.B. Zheng, Vapor generation in dielectric barrier discharge for sensitive detection of mercury by inductively coupled plasma optical emission spectrometry. J. Anal. At. Spectrom. 26 (2011) 1204–1209. DOI:10.1039/c1ja10016e |
| [32] | Z.L. Zhu, Q.J. Wu, Z.F. Liu, Dielectric barrier discharge for high efficiency plasma-chemical vapor generation of cadmium. Anal. Chem. 85 (2013) 4150–4156. DOI:10.1021/ac400368h |
| [33] | Y. Lin, Y. Yang, Y.X. Li, Ultrasensitive speciation analysis of mercury in rice by headspace solid phase microextraction using porous carbons and gas chromatography-dielectric barrier discharge optical emission spectrometry. Environ. Sci. Technol. 50 (2016) 2468–2476. DOI:10.1021/acs.est.5b04328 |
| [34] | C. Richmonds, R.M. Sankaran, Plasma-liquid electrochemistry:rapid synthesis of colloidal metal nanoparticles by microplasma reduction of aqueous cations. Appl. Phys. Lett. 93 (2008) 131501. DOI:10.1063/1.2988283 |
| [35] | M. Richmonds, B. Witzke, Electron-transfer reactions at the plasma-liquid interface. J. Am. Chem. Soc. 133 (2011) 17582–17585. DOI:10.1021/ja207547b |
| [36] | M. Witzke, P. Rumbach, D.B. Go, R.M. Sankaran, Evidence for the electrolysis of water by atmospheric-pressure plasmas formed at the surface of aqueous solutions. J. Phys. D:Appl. Phys. 45 (2012) 442001. DOI:10.1088/0022-3727/45/44/442001 |
| [37] | C.B. Zheng, R.E. Sturgeon, C. Brophy, X.D. Hou, Versatile thin-film reactor for photochemical vapor generation. Anal. Chem. 82 (2010) 3086–3093. DOI:10.1021/ac100229k |
| [38] | P.Wu,H.Chen,G.L.Cheng,X.D.Hou,Exploringsurfacechemistryofnano-TiO2 for automated speciation analysis of Cr(III) and Cr(VI) in drinking water using flow injection and ET-AAS detection, J. Anal. At. Spectrom. 24(2009) 1098-1104. |