 2016, Vol. 27


In recent years, quantum dots (QDs), particularly semiconductor nanocrystals, have attracted considerable interest among researchers; QDs are composed of II-VI and III-V elements (2-20 nm) as a stable nanocrystal. Water-soluble QDs provide advantages such as wide-band excitation, narrow and highly efficient emission, color tunability, and good stability. Given the distinct electronic and optical properties of QDs [1], they can be applied in biological markers [2, 3], light-emitting diodes (LEDs) [4, 5], lasers [6], photocatalysts [7, 8], and solar cells [9]. In 1993, Rajh T. et al.[10] first reported the preparation of sulfhydryl glycerin-coated CdTe QDs in aqueous solution. Thiol molecules on the QD surface act as protective agents that enhance the optical stability of QDs, a significant improvement in the preparation of water soluble QDs.
Coating QDs can prevent photo-oxidation and improve their performance. Recently, photoluminescent CdTe@BaSO4 [11], CdTe@NaCl [12] powders, and CdTe@Ca(OH)2 nanocrystals [13], which are used as white LEDs, have been prepared successfully in the aqueous phase through a coprecipitation approach. Moreover, CdTe QDs have been protected from the surrounding environment by incorporation into BaSO4, NaCl, and Ca(OH)2 matrices. CdTe@BaSO4, CdTe@NaCl powders, and CdTe@Ca(OH)2 nanocrystals exhibit excellent optical properties, including long fluorescent lifespans, strong photoluminescence, and high photostability and thermal stability, as well as antacid properties.
In this study, CdTe@Zn5(CO3)2(OH)6 composite nanospheres were successfully developed. To our knowledge, the use of hydrothermal methods to create inorganic materials and QD composites for use as fluorescent microscopy pigments is not well explored. Therefore, we systematically investigated the hydrothermal synthesis of QD fluorescent powders by mainly focusing on their reaction times and the mole ratios of Zn/Te.
2. ExperimentalMaterials:TeO2 (99.99%), NaOH, CdCl2-2.5H2O(99.0%), NaBH4 (96%), Zn(NO3)2-6H2O(99.00%), CO(NH2)2 (99.00%), 3-thiohy- dracrylic acid (3-MPA, 98%), and C2H5OH (99.70%) were used in the experiments. All procured chemicals were used without further purification. Deionized water and distilled water were also used throughout the experiments.
Preparation of CdTe QDs: CdTe QDs were prepared in an aqueous solution [14]. First, CdCl2 solution and 3-MPA were mixed in a three-necked flask, and the pH value was adjusted to 10.0-10.5 by adding NaOH solution. Second, a precursor solution was added to the mixed solution. The Cd2+/3-MPA/TeO2 molar ratio was 1.0:1.6:0.1. Finally, the solid CdTe QD samples were collected via centrifugation and then dried overnight.
Preparation of CdTe@Zn5(CO3)2(OH)6 composites: Samples of CdTe QD@Zn5(CO3)2(OH)6 mixed crystals were obtained by mixing the as-prepared aqueous CdTe QD solutions with a mixed solution of CO(NH2)2 and Zn(NO3)2 6H2O. Subsequently, the solution was poured into a Teflon-lined autoclave, which was sealed in stainless steel tanks and maintained at 95 ℃ for several hours. The precipitate was collected through filtration and dried afterward.
Characterization: X-ray powder diffraction (XRD) patterns of the products were performed using a Rigaku D/max-2500 system (Cu Ka = 1.5406 A). Fluorescence microscopy was recorded on a Leica fluorescence Stereomicroscope. UV-vis spectra were obtained on a TU-1901 UV-vis spectrophotometer (Beijing Purkinje General Instrument Co., Ltd., Beijing, China). Scanning electron microscopy (SEM; Hitachi-S4700, Tokyo, Japan) was also performed. Energy-dispersive X-ray (EDX) spectrometers fitted to electron microscopes were used for elemental analysis. PL spectra were obtained using a Hitachi-2500 fluorescence spectrometer.
3. Results and discussionFig. 1a shows the XRD patterns of 3-MPA-stabilized CdTe QDs and CdTe@Zn5(CO3)2(OH)6 composites under the following reaction times: 1, 3, and 5 h. Three obvious diffraction peaks are shown in Fig. 1a at 2-theta values of 23.82°, 39.45°, and 46.72°, which can be readily assigned to the (111), (220), and (311) planes of cubic CdTe (JCPDS No. 65-1082), respectively. Thus, the 3-MPA-stabi- lized CdTe QDs were synthesized successfully. Notably, the reaction times significantly affected the structure of the CdTe@Zn5(CO3)2(OH)6 composites. The characteristic diffraction peaks of CdTe QDs became weak, whereas the characteristic diffraction peaks at 13.2°, 32.9°, and 59.2°, which are respectively assigned to the (200), (021), and (510) planes of the Zn5(CO3)2(OH)6 composites (JCPDS No. 19-1458) increased with increasing reaction time. During the hydrothermal reaction, CdTe QDs were completely embedded within the Zn5(CO3)2(OH)6 crystals. This finding can be proven by the fact that the parental solution shows no PL under a UV lamp, whereas CdTe@Zn5(- CO3)2(OH)6 composites show high PL [12]. Therefore, the effect of insoluble matter on encapsulated CdTe QDs is enhanced with increased reaction time [15]. Fig. 1b shows the XRD patterns of CdTe@Zn5(CO3)2(OH)6 composites under different molar propor tions of Zn/Te (300:1, 500:1, and 700:1). The diffraction peaks of the CdTe@Zn5(CO3)2(OH)6 structure gradually increased with the increase in the molar proportions of Zn/Te. Moreover, after forming CdTe@Zn5(CO3)2(OH)6 composites, only the diffraction pattern of Zn5(CO3)2(OH)6 (JCPDS NO. 19-1458) could be observed because the quantity of CdTe QDs was so small that their XRD peaks were hidden by those of Zn5(CO3)2(OH)6.

|
Download:
|
| Figure 1. (a) XRD patterns of MPA-stabilized CdTe QDs and CdTe@Zn5(CO3)2(OH)6 composites formed under different concentrations and reaction times (h): 1, 3, and 5 h and (b) different molar proportions of Zn/Te: 300:1, 500:1, and 700:1. | |
Fig. 2 displays the UV-vis absorption spectra of solid CdTe QDs and CdTe@Zn5(CO3)2(OH)6 at Zn2+/CO(NH2)2 ratios from 1:1 to 1:6. The UV-vis spectra of each crystal cover a broad range of 350600 nm, which clearly proves the representative excitonic peak of band-gap energy. As the mole ratio increases, the intensity of UV absorption increases at first and subsequently decreases. The absorption is significantly higher compared with that of solid CdTe QDs, probably because the density of CdTe QDs increases per unit volume when they are coated with Zn5(CO3)2(OH)6. However, excessive amounts of Zn5(CO3)2(OH)6 prevent CdTe QDs from absorbing UV-vis light. In addition, the absorption peak reaches a maximum at 525 nm, corresponding to a Zn(NO3)2/CO(NH2)2 ra tio of 1:3.

|
Download:
|
| Figure 2. UV–vis spectra of solid CdTe QDs and CdTe@Zn5(CO3)2(OH)6 at different Zn2+/ CO(NH2)2 ratios. | |
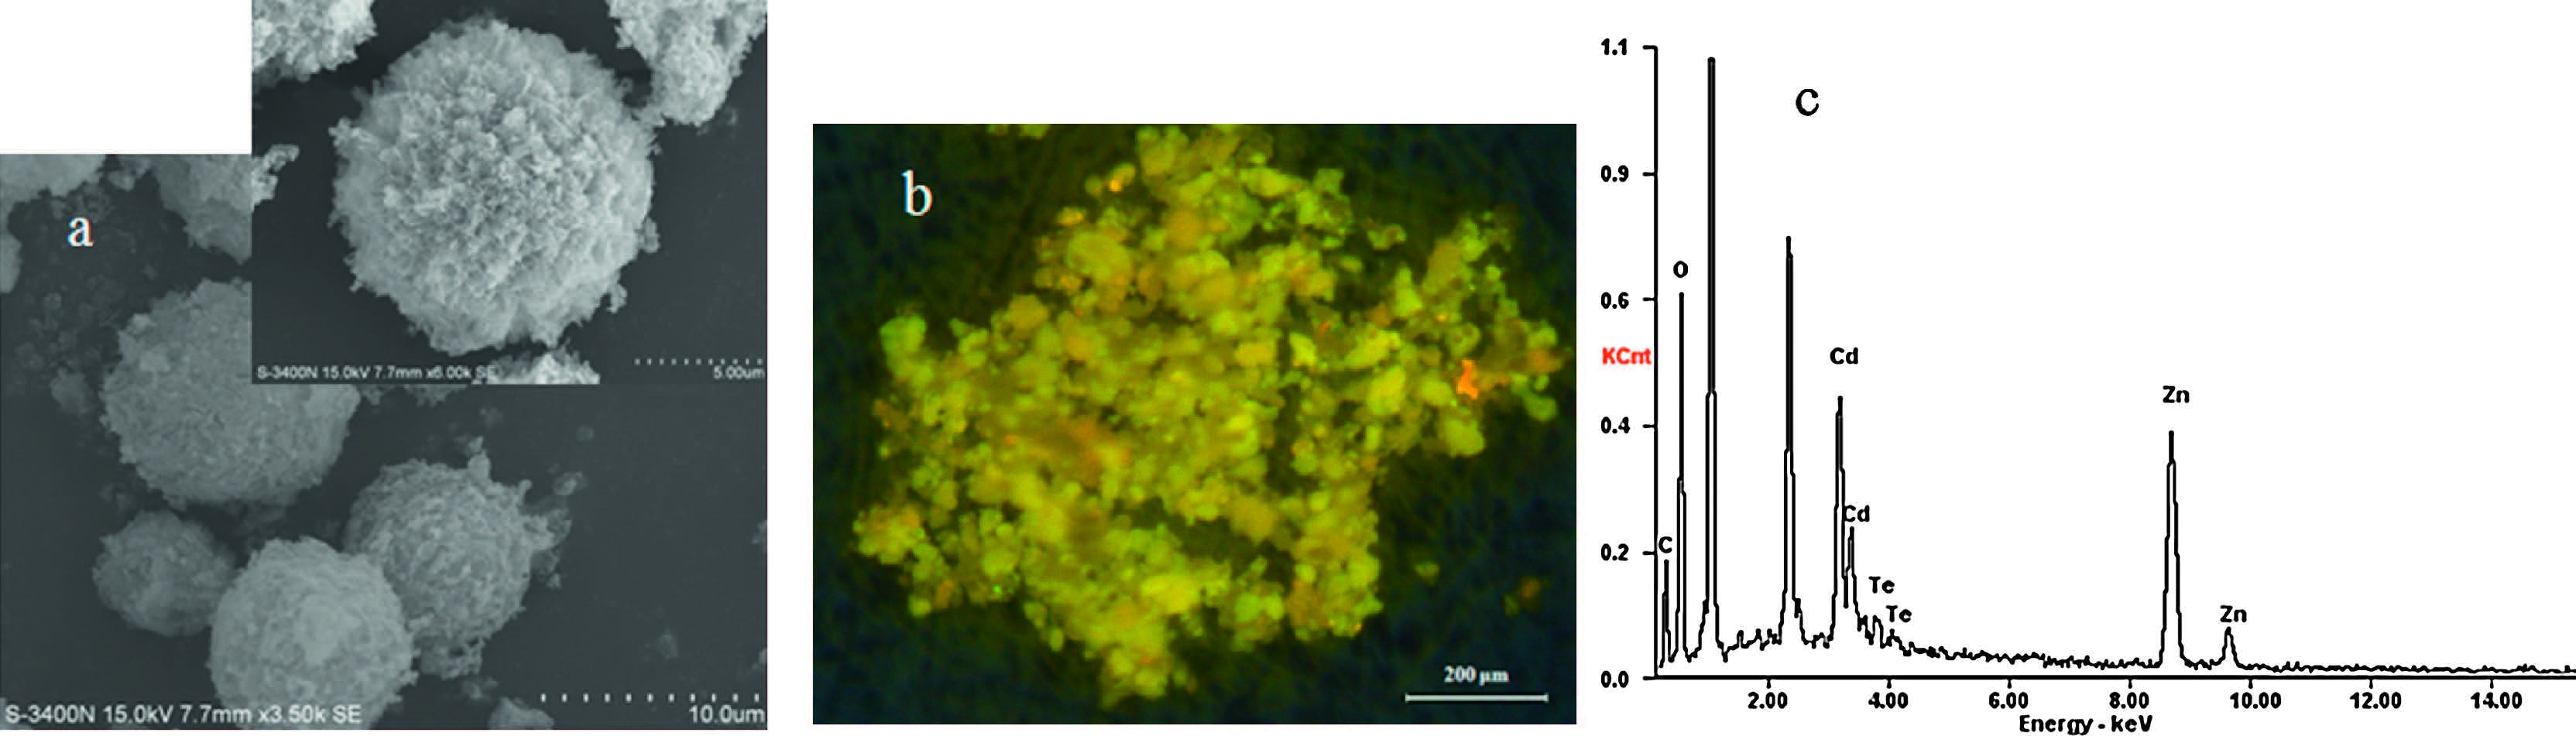
The SEM image in Fig. 3a shows the formation of monodispersed globular-shaped CdTe@Zn5(CO3)2(OH)6 particles. These particles exhibit a regular shaped, uniform-sized distribution, diameter of 6-10 mm, and coral-like rough surface; the corresponding average particle size is 8 um. Fig. 3b shows fluorescence microscopy images of the representative yellow CdTe@Zn5(CO3)2(OH)6 composites. It can be observed that every crystal exhibits yellow emission, which clearly indicates that the CdTe QDs are incorporated into Zn5(CO3)2(OH)6 crystals. Fig. 3c presents the EDX images of the CdTe@Zn5(CO3)2(OH)6 composites which demonstrates the existence of CdTe QDs and Zn5(CO3)2(OH)6 when the samples were fully ground. These images allowed the determination of chemical species distribution within each sample. Particles containing Cd and Te clearly also indicate that CdTe QDs are incorporated into the Zn5(CO3)2(OH)6 crystals because no XRD peak is observed in Fig. 1b.

|
Download:
|
| Figure 3. (a) SEM, along with fluorescence microscopy images (b) and (c) EDX images of CdTe@Zn5(CO3)2(OH)6 composites. | |
Fig. 4a shows the PL spectra of CdTe@Zn5(CO3)2(OH)6 composites under the following reaction times: 1, 3, and 5 h. The fluorescence intensity first increases and then decreases with the increase of reaction time, along with a slight red shift. This effect is attributed to the increase per unit volume of the number of CdTe QDs when they are coated with Zn5(CO3)2(OH)6. Furthermore, the Zn5(CO3)2(OH)6 content increases with reaction time, which prevents part of CdTe QD fluorescence from being emitted. Therefore, the appropriate Zn5(CO3)2(OH)6 content can either increase or decrease the fluorescence intensity of the CdTe@Zn5(- CO3)2(OH)6 composites. Fig. 4b displays the CIE images of CdTe@Zn5(CO3)2(OH)6 with formed under different reaction times. Their fluorescent colors are associated with the PL spectra (Fig. 4a); CdTe@Zn5(CO3)2(OH)6 particles exhibit a strong yellow light at 3 h. Fig. 4c illustrates the PL spectra of the CdTe@Zn5(CO3)2(OH)6 composites in the presence of different molar proportions of Zn/ Te: 300:1, 500:1, and 700:1. The fluorescence intensity tends to weaken and red shifts gradually with the increase in the molar proportion of Zn/Te. The results can be observed intuitively in Fig. 4d, showing the CIE images of CdTe@Zn5(CO3)2(OH)6 composites formed with different molar proportions of Zn/Te. This reaction affects the fluorescent performance of the CdTe@Zn5(CO3)2(OH)6 composites because Zn2+ can replace Cd2+ to form Zn/Te when adding excess Zn2+ [16]. The CdTe@Zn5(CO3)2(OH)6 composites demonstrated the strongest fluorescence emission at 575 nm when the molar ratio of Zn/Te was 300:1.

|
Download:
|
| Figure 4. (a) PL spectra and CIE pictures (b) of CdTe@Zn5(CO3)2(OH)6 with different reaction times (h): 1, 3, and 5 h. (c) PL spectra and CIE pictures (d) of CdTe@Zn5(CO3)2(OH)6 formed with molar proportions of Zn/Te: 300:1, 500:1 and 700:1. | |

|
Download:
|
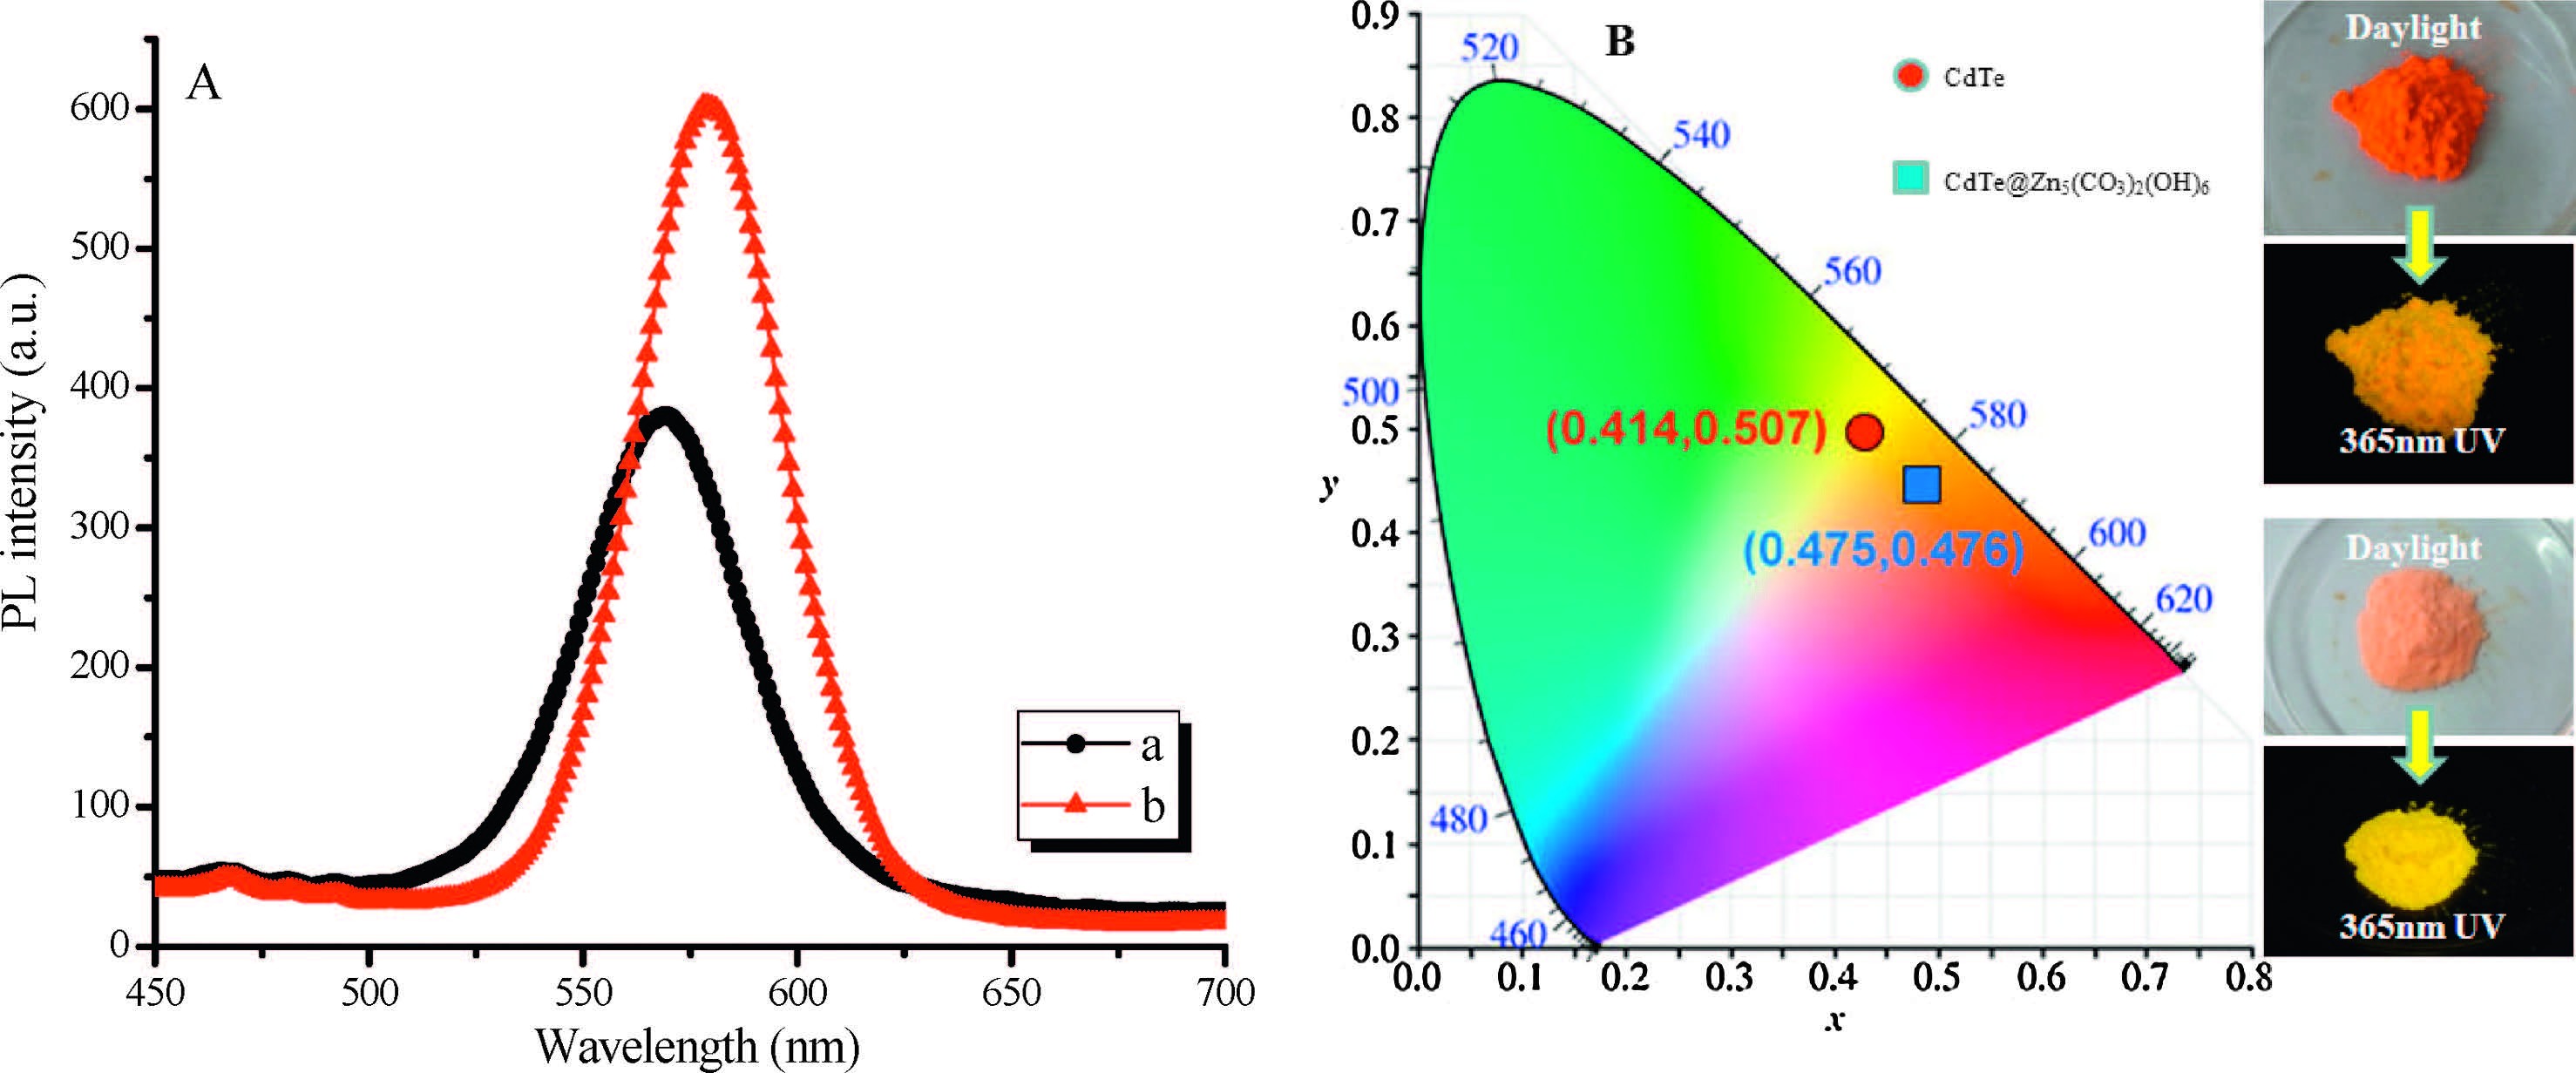
| Figure 5. (A) the PL spectra of powder of CdTe QDs (a) and CdTe@Zn5(CO3)2(OH)6 (b), along with their corresponding chromaticity coordinates and digital images of samples under natural light and UV irradiation (B). | |
Fig. 5A presents the PL spectra of CdTe QD (a) and CdTe@Zn5(CO3)2(OH)6 (b) solid powders. The PL intensity of CdTe QDs, which were prepared under optimal conditions, is shown in Fig. 5A(a). The result illustrates that CdTe QDs reached their maximum emission at 569 nm, with a half peak width of 48 nm. Fig. 5A(b) displays the PL emission of the CdTe@Zn5(CO3)2(OH)6 composites obtained under optimal conditions. The PL intensity reached its maximum value at 578 nm, which was 1.6-fold stronger than that of CdTe QDs. The half peak width of the CdTe@Zn5(CO3)2(OH)6 composites was narrower than that of the CdTe QDs. This finding indicates that the size distribution of the CdTe@Zn5(CO3)2(OH)6 composites was more homogeneous. In addition, the emission peak of the CdTe QDs red shift to a long wavelength region because the QDs are coated with Zn5(CO3)2(OH)6, hence leading to particle growth. The chromatici- ty coordinates of CdTe and CdTe@Zn5(CO3)2(OH)6 composites based on the corresponding emission under excitation with 365 nm are shown in Fig. 5B. It can be seen that the corresponding coordinates of CdTe and CdTe@Zn5(CO3)2(OH)6 composites are (0.414, 0.507) and (0.475, 0.476), respectively. The CdTe QDs under daylight appear as an orange powder and exhibit weak yellow photoluminescence when excited by the 365 nm NUV lamp. The CdTe@Zn5(CO3)2(OH)6 has a pink color in natural light, and it emits bright yellow light at 365 nm NUV irradiation.
4. ConclusionIn this work, we developed a green, inexpensive, and facile method to synthesize CdTe QDs and CdTe@Zn5(CO3)2(OH)6, which emitted a stronger yellow light than that produced by the original CdTe QD solid under UV excitation. The PL emission of CdTe@Zn5(CO3)2(OH)6 composites obtained under optimal conditions was 1.6-fold stronger than that of CdTe QDs. The proposed approach incorporated QDs into inorganic microparticles. Furthermore, inorganic particles can be easily observed through fluorescence microscopy. Thus, these particles can be used to study cell uptake and cellular distribution. CdTe@Zn5(CO3)2(OH)6 particles emitting a strong yellow fluorescence can be applied potentially as phosphors for white LEDs.
Acknowledgment This work was supported by grants from the Science Foundation of Guangxi Province (No. 2015GXNSFAA139025) and the Students Innovation and Entrepreneurship Training Program of Guangxi University (No. 201610593040).| [1] | Ayyaswamy A., Ganapathy S., Alsalme A., Alghamdi A., Ramasamy J., Structural, optical and photovoltaic properties of co-doped CdTe QDs for quantum dots sensitized solar cells. Superlattice Microstruct. 88 (2015) 634–644. DOI:10.1016/j.spmi.2015.10.032 |
| [2] | Wang Y.Q., Chen Y., Cai J.Y., Zhong L.Y., QD as a bifunctional cell-surface marker for both fluorescence and atomic force microscopy. Ultramicroscopy 109 (2009) 268–274. DOI:10.1016/j.ultramic.2008.11.020 |
| [3] | Dong W., Guo L., Wang M., Xu S.K., CdTe QDs-based prostate-specific antigen probe for human prostate cancer cell imaging. J. Lumin. 129 (2009) 926–930. DOI:10.1016/j.jlumin.2009.03.017 |
| [4] | Bera S., Singh S.B., Ray S.K., Green route synthesis of high quality CdSe quantum dots for applications in light emitting devices. J. Solid State Chem. 189 (2012) 75–79. DOI:10.1016/j.jssc.2011.11.048 |
| [5] | Al Husseini H.B., Al Naimee K.A., Al Khursan A.H., Modulation response, mixed-mode oscillations and chaotic spiking in quantum dot light emitting diode. Chaos Solitons Fract. 78 (2015) 229–237. DOI:10.1016/j.chaos.2015.07.033 |
| [6] | Salah A., Mansour A., Mohamed M.B., Effects of nanoparticles size and concentration and laser power on nonlinear optical properties of Au and Au-CdSe nanocrystals. Appl. Surf. Sci. 353 (2015) 112–117. DOI:10.1016/j.apsusc.2015.06.060 |
| [7] | Zheng D.D., Zhang G.G., Wang X.C., Integrating CdS quantum dots on hollow graphitic carbon nitride nanospheres for hydrogen evolution photocatalysis. Appl. Catal. B-Environ. 179 (2015) 479–488. DOI:10.1016/j.apcatb.2015.05.060 |
| [8] | Ge L., Liu J., Efficient visible light-induced photocatalytic degradation of methyl orange by QDs sensitized CdS-Bi2WO6. Appl. Catal. B-Environ. 105 (2011) 289–297. DOI:10.1016/j.apcatb.2011.04.016 |
| [9] | Wang J.Y., Zhang T.J., Wang D.F., Influence of CdSe quantum dot interlayer on the performance of polymer/TiO2 nanorod arrays hybrid solar cell. Chem. Phys. Lett. 541 (2012) 105–109. DOI:10.1016/j.cplett.2012.05.074 |
| [10] | Rajh T., Micic O.I., Nozik A.J., Synthesis and characterization of surface-modified colloidal CdTe quantum dots. ChemInform 25 (1994) . |
| [11] | Chang Y.J., Yao X.D., Zhang Z.P., Preparation of highly luminescent BaSO4 protected CdTe quantum dots as conversion materials for excellent color-rendering white LEDs. J. Mater. Chem. C 3 (2015) 2831–2836. DOI:10.1039/C4TC02806F |
| [12] | Chang Y.J., Yao X.D., Mi L.F., A water-ethanol phase assisted co-precipitation approach toward high quality quantum dot-inorganic salt composites and their application for WLEDs. Green Chem. 17 (2015) 4439–4445. DOI:10.1039/C5GC01109D |
| [13] | Zhao Z.X., Wang X.Q., Ling L.T., Wang C.F., Chen S., Rapid green manufacture of high yield CdTe@Ca(OH)2 nanocrystals and their performance on WLED. AIChE J. 62 (2016) 580–588. DOI:10.1002/aic.v62.2 |
| [14] | Wang R.F., Li B., Dong L.H., Photocatalytic activity of CdTe quantum dots encapsulated in zeolite Y. Mater. Lett. 135 (2014) 99–102. DOI:10.1016/j.matlet.2014.07.112 |
| [15] | Kalytchuk S., Zhovtiuk O., Kershaw S.V., Zbořil R., Rogach A.L., Temperature-dependent exciton and trap-related photoluminescence of CdTe quantumdotsembedded in a NaCl matrix:implication in thermometry. Small 12 (2016) 466–476. DOI:10.1002/smll.v12.4 |
| [16] | Liu X.M., Tian J.T., Jia J.Q., Zn2+ addition:a facile way to obtain CdTe nanocrystals powders with enhanced fluorescence emission. Colloid. Surf. A 451 (2014) 85–89. DOI:10.1016/j.colsurfa.2014.03.046 |