 2016, Vol. 27


b Laboratory of Structure Identification, Beijing Institute of Pharmacology and Toxicology, Beijing 100850, China ;
c State Key Laboratory of Toxicology and Medical Countermeasures, Beijing Institute of Pharmacology and Toxicology, Beijing 100850, China
Polymorphism creates challenges during drug development and manufacturing because different polymorphs of a compound have different physicochemical properties such as density, morphology, solubility, dissolution rate, stability, and hygroscopicity. In addition, sometimes different polymorphs of the same drug exhibit differences in bioavailability, efficacy, and drug product performance in clinical situations. So the identification and specification of polymorphs has become an important part of the quality assurance process for pharmaceuticals [1]. In order to control the polymorphic impurities of the final product, developing an accurate quantification method for detecting lowlevel polymorphic impurities in pharmaceuticals has become an important aspect of drug development and manufacture.
Many analytical techniques, including infrared (mid-and nearIR), FT-Raman, solid-state NMR spectroscopy, thermal methods, and X-ray powder diffraction (XRPD) [2-7] have been used to determine the polymorphic content of mixtures or the amorphous content of crystalline materials. However, XRPD has become the most preferred and extensively used technique for quantitatively analyzing the purity of a polymorphic drug because of its advantages, including the uniqueness of the X-ray powder patterns of different compounds, non-destructive nature, simplicity, and the ability to make the measurements of both the active ingredient and the final commercial product at room temperature [8-14]. Single-peak and whole pattern fitting are the primary quantification methods of XRPD. The single-peak method is suitable for the quantitative analysis of crystals due to its advantages, such as requiring less information about the sample in advance, its simplicity, and its high sensitivity. But this method relies heavily on having a pure standard sample and is dependent on the orientation of the crystal. Therefore, the single-peak method often requires validation in practical applications. The whole pattern fitting method has a higher signal to noise ratio (SNR), greater sensitivity, and a higher level of specificity compared to the single-peak method, and it is not dependent on the purity of a standard sample, and the influence of the orientation is also reduced. However, the application of whole pattern fitting method is still limited by its requiring prior information about the sample’s structure.
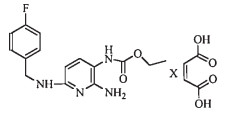
Flupirtine maleate (FPTM) (Fig. 1), 2-amino-3-carbethoxyamino-6-(4-fluorobenzylamino) pyridine maleate, an antipsychotic drug, has seven polymorphs. Forms A and B are the most common crystalline forms and usually coexist in a mixture [15]. Form A is the more stable anhydrous form at room temperature and is the one used as a medicine. Form B is unsuitable due to its metastability and is rapidly transformed into form A in concentrated isopropanol suspensions or at higher temperature [16]. Thus, it is necessary to develop a simple, highly sensitive and accurate technical method for quantifying the amount of form B in polymorphic (forms A and B) mixtures of flupirtine maleate. To the best of our knowledge, the crystal structures of forms A and B of FPTM have not been published. In this work, the single-peak-based XRPD method was utilized to quantify the polymorphic forms of FPTM (forms A and B). As mentioned before, an authentic and validated single-peak-based XRPD calibration curve requires an accurate identification and measurement of parameters, such as the intensity, height, and area of the diffraction lines, which is the most critical factor in developing any assay errors for solid-state forms. To reduce these errors, the instrument and sample preparation parameters, type of sample holders, sample rotation, particle size, and powder packing, all of which influence the quantification results by affecting the diffraction peak intensities, areas, and balance, must be considered [9, 13, 14].

|
Download:
|
| Figure 1. Flupirtine maleate. | |
This study focused on three objectives: i) characterizing the inherent nature of samples using differential scanning calorimetry (DSC), thermogravimetric analysis (TGA), Fourier transform infrared spectroscopy (FT-IR), and X-ray powder detection (XRPD) to test the purity and the choice of quantification methods; ii) optimizing the instrument and sample preparation parameters with the goal of minimizing the errors; and (iii) developing a quantification calibration curve, which has been validated and checked for assay errors, for quantifying the amount of form B in polymorphic of FPTM using data obtained by XRPD.
2. Experimental 2.1. MaterialsFTPM form A and FTPM form B were prepared and supplied by the Hong de Pharmaceutical Co., Beijing and were used without any further purification. All other reagents and solvents obtained from commercial suppliers were used as received.
2.2. InstrumentationThermal analysis: DSC: A differential scanning calorimeter (DSC-Q2000; TA, UK) was used. The samples were heated from 40 to up to 200 °C at a heating rate of 10 °C·min-1 under a nitrogen purge flow rate of 50 mL min-1. The temperature end point was determined by the melting point of the less fusible component. The samples in all the DSC experiments weighed between 2.35 and 3.24 mg, with an accuracy of±0.01 mg. TGA: The thermogravimetric measurements were performed using a Q500 TGA (TA, UK) system. The mass loss of the sample as a function of temperature was determined. 2.8590 mg of form A and 1.8480 mg of form B were weighed, respectively, with an accuracy of±0.0001 mg, separately placed in an open alumina crucible, and then heated at a rate of 10 °C min-1 under nitrogen purge (60 mL min-1). And then a recorded TGA spectrum was obtained.
FT-IR: The FT-IR spectra for each of the FTPM forms were obtained by averaging 32 scans performed using a Thermo Nicolet 6700 FT-IR spectrometer. About 2 mg of sample was gently ground with 200 mg of KBr and pressed into a 13 mm-diameter pellet with a hydraulic press at 700 MPa for 20 s. The spectrum for each sample was recorded over the 4000-400 cm-1 spectral region at a resolution of 4 cm-1.
XRPD: XRPD patterns for samples of different percentages of B/ A were recorded at room temperature on a Bruker D8 Advance diffractometer (Karlsruhe, West Germany) that utilizes Cu Ka radiation (1.54 Å) at 40 kV, 40 mA passing through a nickel filter with a 0.5° variable slit, a 2.5 mm solar slit, and a 1 mm receiving slit to obtain both reflection and transmission measurements. The diffractometer had a 2θ compensating slit and the accuracy of the peak positions was calibrated with α-Al2O3 as standard sample. One hundred milligrams of the powder mixture was loaded into the 0.2 mm deep hollow of an aluminum sample holder equipped with a quartz monocrystal zero background plate. To ensure a flat surface that was continuous with the holder surface, a clean glass slide was used to compress the sample into the hollow of the holder plate. The samples were analyzed by a continuous mode Xray powder diffraction analysis with a step size of 0.018 and a step time of 0.6 s over an angular range of 4-16°. During the measurements, the sample holder was rotated in the surface plane at 15 rpm. DIFFRACplus EVA (ver. 9.0) diffraction software was used to analyze the resulting diffractograms.
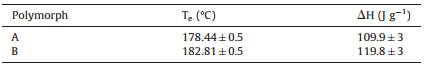
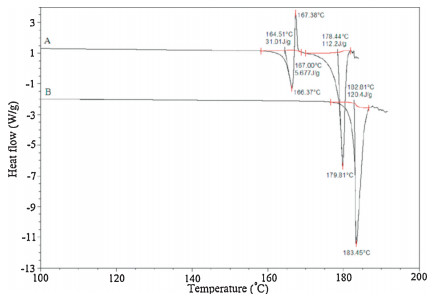
3. Results and discussion 3.1. Solid-state characterization of crystal forms A and B 3.1.1. Thermal analysisThe DSC curve (Fig. 2) for form A showed a melting endotherm at 164.88-168.37 °C, a subsequent recrystallization exotherm at 169.86-170.2 °C, and a final melt at 178.44-179.81 °C. Form B only had a single melting endotherm at 182.81-183.45 °C. The melting point and melting enthalpy are listed in Table 1.

|
Download:
|
| Figure 2. DSC curves of forms A and B. | |
|
|
Table 1 Quantitative data of melting of flupirtine maleate polymorphs (10°C min-1). |
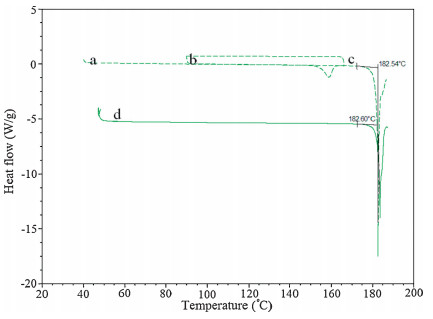
In order to evaluate the reversible character of the thermal events between form A and B, cyclic measurements were taken (Fig. 3). The first step was to heat the FPTM at a rate of 10 °C min-1 to 167 °C (the temperature corresponding to the end of the first endothermic peak) or up to 169 °C (the temperature corresponding to the end of the exothermic peak). The FPTM samples were then cooled to room temperature and, finally, reheated to 190 °C. When a sample was heated to 167 °C, an exothermic peak with a size that corresponded to that of the exothermic peak present in the original rise in temperature occurred immediately after the cooling began. However, when the temperature reached in the first heating was 169 °C, no thermal event occurred during the cooling period and in the second heating, only an endothermic peak, which corresponds to the endothermic peak of form B. These results indicate that form A transforms to form B at high temperatures. So form A and form B are pure polymorphs.

|
Download:
|
| Figure 3. DSC curves of the modifications as well as of preheated (a) form A heated up to 170 °C; (b) cooling to 80 °C; (c) preheated up to 190 °C; and (d) form B. | |
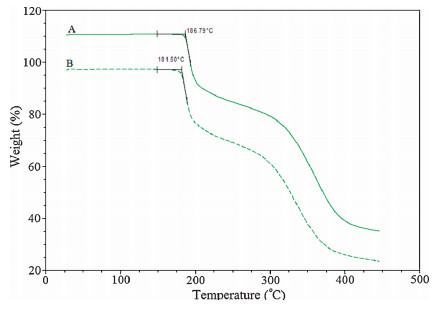
The TGA analysis results indicated that FPTM crystal forms A and B were anhydrous, as they exhibited no weight loss up to the melting peak (Fig. 4).

|
Download:
|
| Figure 4. TGA curves of form A and form B. | |
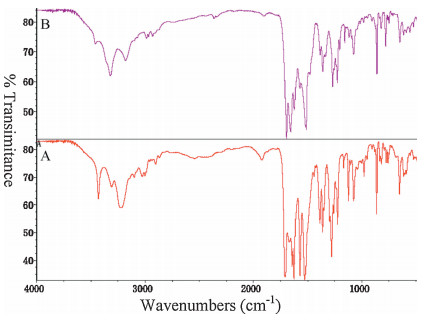
3.1.2. FT-IR spectroscopy
The spectral regions between 3500-3100 cm-1 and between 1800-1000 cm-1 are important for the FT-IR identification of forms A and B. Fig. 5 showed that the most characteristic peaks of form A were at 3429, 1709, 1670, 1643, and 1527 cm-1, which differed from those of form B (3319, 1695, 1655, and 1513 cm-1). In particular, the spectral region between 3500-3100 cm-1 corresponds to the OH group or amino group; The spectral peak at 1709 cm-1 corresponds to the carbonyl group; The spectral region between 1500-1700 cm-1 corresponds to the aromatic carbonyl group; Compared to that of form A, the FT-IR spectrum of form B is red shifted. The most obvious reason is that the formation of hydrogen bonds in form B. These results agree well with the claims in US patent 2011/0184030 Al [15].

|
Download:
|
| Figure 5. FT-IR of form A and B. | |
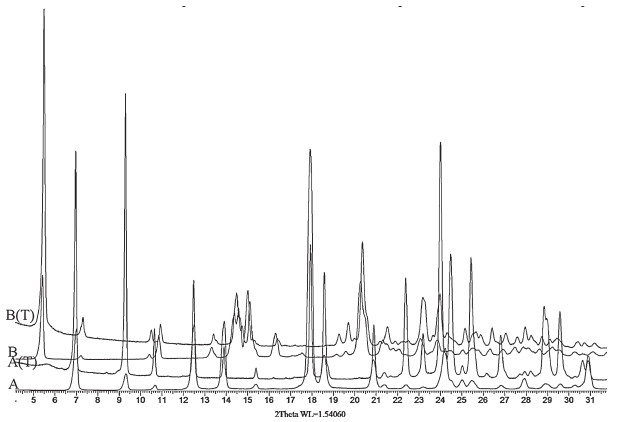
3.1.3. The XPRD analysis
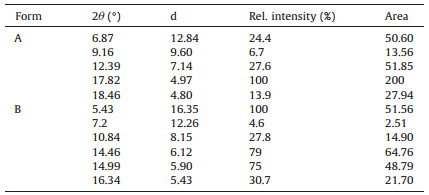
The XRPD patterns (Fig. 6) for form A and form B showed several differences in their characteristic peaks that can be used to identify the two crystal forms. The characteristic peaks for the two forms are listed in Table 2 and corresponds well with the values reported in the US patent 2011/0184030 Al [15].
|
|
Table 2 XRPD characteristic peaks of form A and form B. |

|
Download:
|
| Figure 6. X-ray diffractograms of form A and B. | |
3.2. The quantitative analysis of flupirtine maleate polymorphs A and B 3.2.1. The choice of a scanning mode
Two scanning modes of XRPD technology, reflection and transmission, are commonly used in analyzing the purity of polymorphs. Errors due to the preferred orientation are the most widely studied factor affecting XRPD. The mode of packing of the powder sample in the holder can lead to the crystals arranging in a preferred orientation because of a non-random distribution of the crystal orientations [9]. A crystallographic orientation of the crystal particles can affect the intensity as much as 100%, and the consequences are more prominent for acicular and irregularly shaped crystals. In theory, using the transmission mode can decrease the preferred orientation and improve the resolution. In this work, form A was initially studied using the transmission mode. Fig. 7 shows that the transmission mode reduced the preferred orientation and increased the resolution. Thus, the relative intensity of each characteristic peak was more balanced and reflective of the actual crystal structure. For form A, the resolution of the peaks was improved, especially between 20° (2θ) and 30° (2θ). However, the captured film used in the transmission mode has a diffraction peak at 5.4°, which coincides with the characteristic peak of form B at 5.43°/2θ (Ⅰ/Ⅰ0 100%). Therefore, even though the reflection mode has more inherent difficulties with resolution, it is better suited for analyzing polymorphic FTPM. In order to find ways to overcome the disadvantages of the reflection mode, studies of the preparation of the sample, the optimization of the instrumental parameters, and the choice of quantifiable characteristic peaks are necessary.

|
Download:
|
| Figure 7. X-ray reflection and transmission diffractograms of forms A and B. | |
3.2.2. Preparation of polymorphic mixtures for XRPD study
Before mixing, the two forms of FTPM were passed through a 200-mesh sieve to reduce the effect of particle size on the preferred orientation [9]. A mixed sample of forms A and B was prepared by accurately weighing out specific amount of the previously ground pure form A (200-mesh) after which, form B was physically mixed into form A in an agate mortar with a pestle to form separate mixtures with the following percentages of form B/form A: 0, 0.5, 1, 2, 5, 10, 15, 20, 25, 30, 40, 60, 80, and 100 w/w%. A qualitative crystal study of FTPM by XRPD showed that grinding did not induce a polymorph transformation between the crystal forms A and B. The samples were made in triplicates and 100 mg powder mixtures with an accuracy of±0.01 mg were loaded into a sample holder.
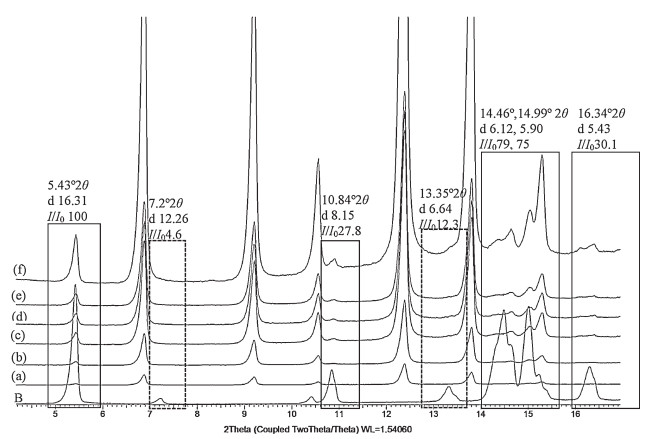
3.2.3. Optimization of instrumental parametersEarlier studies reported that the scan rate and chopper increment critically affect the area of the diffraction peaks [10]. In this study, six groups with different scan rates and chopper increments were investigated using a 5%, w/w polymorphic mixture of form A and form B. Fig. 8 showed that when the scan rate was 12° min-1, only one peak was identified at 5.43°, whereas when the scan rates were 2, 1, 0.6 and 0.3° min-1, a maximum of four peaks of form B were identified at 2θ 5.43°, 10.84°, 14.46/ 14.99°, and 16.30°. Because the 7.2° and 13.35° 2θ peaks were of very low intensity (Ⅰ/Ⅰ0=6.6%, 12.3%), they were not observed in any of the combinations. Therefore, in order to keep a balance between the peak resolution and recording time, a scan rate of 2° min-1 with about 21.5 min recording time was selected for the experiments.

|
Download:
|
| Figure 8. Effect of scan rate on X-ray diffractogram of 5% (w/w) of form B. (a) 12° min-1, (b) 6° min-1, (c) 2° min-1, (d) 1° min-1, (e) 0.6° min-1, and (f) 0.3° min-1 with the solid line boxes depicting the identifiable peaks and the dotted boxes showing the peaks that were not detected in 5% (w/w) mixture. | |
3.2.4. The choice of quantifiable characteristic peaks
In previous studies of the quantification of polymorphic forms of drugs by XRPD, the highest intensive peak (Ⅰ/Ⅰ0=100%) was usually used to detect the amount of the different polymorphs in polymorphic mixtures [17]. In this study, FTPM form B had six characteristic peaks, so the highest peak (5.43° Ⅰ/Ⅰ0=100%, area=51.56) was used to detect the polymorphic content of the mixtures. The other characteristic peaks at 7.2°, 10.84°, 14.46°, 14.99°, and 16.34° 2θ were low in resolution and intensity and exhibited low R2 values (less than 0.926) and, therefore, were not used in the quantification process.
Form A had five characteristics peaks at 6.87°, 9.16°, 12.39°, 18.46°, and 17.82° 2θ. Choosing the quantitative characteristic peaks was important. The peak at 6.87° 2θ could not be selected for the quantification because the peak at 6.87° 2θ (from 6.45° to 7.18°) overlapped with the peak at 7.2° 2θ (from 6.9° to 7.5°) of form B. The other low area and intensity peak (9.16°, 18.46° 2θ) and the high area and intensity peak (17.62° 2θ) exhibited low R2 values (less than 0.914) and, thus, were not used for quantification. Therefore, for form A, the peak at 12.39° 2θ (Ⅰ/Ⅰ0=27.6%, area=51.85), which exhibited higher R2 values (0.999), was selected to quantify the amount of form A in mixtures. The choice showed that if the area of the peak was closer to that of the characteristic peak of form B, the linear correlation of the calibration curve was better.
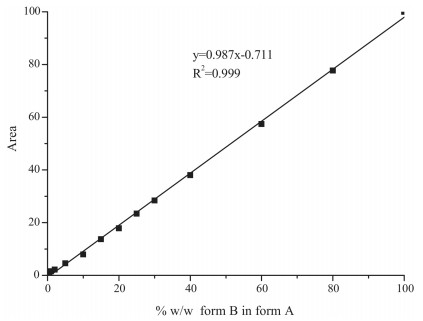
3.2.5. Calibration curve developmentIn general, the height and area of peaks are both considered for analysis. Peak shape and height vary more with changes in particle size, but the peak area tends to be less variable [13, 14]. Therefore, in this study, peak area was used for the quantitative analysis. The peak area at 5.43° 2θ was useful for monitoring the amount of form B in the samples. Fig. 9 showed that the calibration curve was quite linear over a wide range (0-100%, w/w) of form B, with a linear equation of y=0.987x -0.711 and a high correlation coefficient of 0.999. These results confirmed that XRPD is a very good method for quantifying FPTM mixtures of polymorphs (forms A and B).

|
Download:
|
| Figure 9. Calibration curve for determination of FTPM polymorphic form B in form A by XRPD. | |
3.2.6. Validation of the analytical method
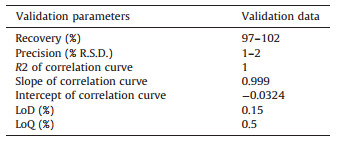
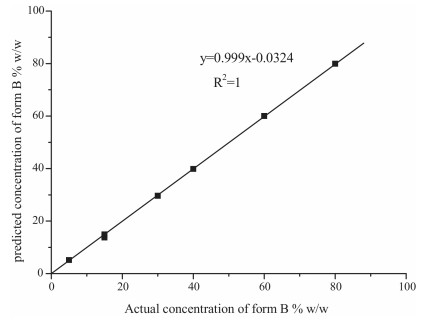
The analytical method developed for quantifying the amount of FPTM form B in form A was validated using accuracy, precision, ruggedness, LoD, and LoQ [10, 17, 18]. The results are provided in Table 3. The accuracy of the result was confirmed by an average recovery of 97.0%-102.0%, and the precision was demonstrated in that the %RSD was between 1.0% and 2.0%. The detection and quantitation limits were calculated using ICH guidelines with consideration of both the background and blank responses to determine the noise level. The results showed that the linear relationship covered the whole range (0-100%), and the LoD and LoQ were 0.15% and 0.5%, respectively. The curve showing the relationship between the actual and the predicted content (%, w/w) of form B was plotted (Fig. 10) with an R2 value of 1, a fitted slope of 0.999, and a small intercept of -0.0324. Although the correlation between the actual and calculated concentrations of form B was excellent, we also investigated the impacts of potential sources of error, as reported in the next section.
|
|
Table 3 Validation parameters. |

|
Download:
|
| Figure 10. Correlation curve of observed vs. theoretical percentage of form B in form A, obtained using peak areas in XRPD. | |
3.2.7. Estimation of assay errors and sources of error
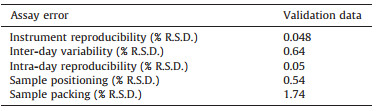
Many potential assay errors, including instrument, inter-day, intra-day, sample position, and sample packing errors, which are associated with an XRPD quantitative analysis [14]. So, all the assay errors were investigated in this work. In order to determine the effect of these errors on the quantification of forms A and B, a single mixture (5 wt% of form B) was used to calculate the size of error. The data from the assay error evaluation are shown in Table 4.
|
|
Table 4 Assay error evaluation for 0-100% (w/w). |
The instrument reproducibility was tested by repeatedly measuring a single sample without disturbance throughout the whole assay process. The results showed good reproducibility with an RSD value of 0.048%. We also found a low intra-day variation of 0.05% and a higher inter-day variation of 0.64%. The day-to-day variability seemed to have resulted from a combination of several factors, such as the daily removal of the sample from the instrument and the resulting re-positioning of the sample each day, which in combination may have disturbed the sample. The observed variability from changing the sample position and repacking the same sample was 0.54% and 1.74%, respectively. Taking into account of the potential sources of error investigated in this study, sample packing seemed to be the most critical factor influencing the accuracy of the quantitative analysis. This, in turn, implies that the geometric orientation, especially the adopting of a preferred orientation by the crystals, may be the most important source of error, while sample particle size, sample rotation, and transmission mode can reduce the probability of the crystals adopting a preferred orientation a process that can aid in reducing the assay error.
4. ConclusionAn XRPD method for quantifying FPTM polymorphs was established by systematically optimizing the instrumental parameters and validating the analytical methodology. The reflectionscanning mode was found to be the more practicable XRPD method for quantifying FPTM polymorphs. A 200-mesh sample particle size and a scan rate of 2° min-1 were selected in determining the proportions of the polymorphs in the FPTM mixtures. The calibration curve was found to be a linear fit across the entire range from 0-100% (w/w) with an LoD as low as 0.15% and an LoQ of 0.5%. Although errors in assays can result from a multiplicity of factors, such as instrument variability or other instrument difficulties, inter-and intra-day variability, and/or sample packing issues, a systematic optimization of the instrumental parameters reduced the size of the errors. This systematic validation of the analytical methodology strongly indicated that the determination of the content of the FPTM mixtures was reliable. Therefore, this method was confirmed as an effective and practical method for the quantitative determination of FPTM polymorphs and could be used in the quality control of polymorphic FPTM in bulk drug samples to ensure the clinical therapeutic effects of FPTM. The strategies for systematically optimizing the instrumental parameters outlined in this article may be helpful in resolving similar technical problems in the quantification of the polymorphic forms of other drugs by XRPD.
AcknowledgmentsThis research was supported by the Major Program of Ministry of Science and Technology of China (No: 2015ZX09J15104-003002). The authors would like to acknowledge the English and content editing of Rhoda E. and Edmund F. Perozzi, PhDs.
| [1] | M. Saifee, N. Inamda, D. Dhamecha, A. Rath, Drug polymorphism: a review. Int. J. Health Res. 2 (2009) 291–306. |
| [2] | Y. Li, P.S. Chow, R.B.H. Tan, Quantification of polymorphic impurity in an enantiotropic polymorph system using differential scanning calorimetry, X-ray powder diffraction and Raman spectroscopy. Int. J. Pharm. 415 (2011) 110–118. DOI:10.1016/j.ijpharm.2011.05.058 |
| [3] | N. Chieng, S. Rehder, D. Saville, T. Rades, J. Aaltonen, Quantitative solid-state analysis of three solid forms of ranitidine hydrochloride in ternary mixtures using Raman spectroscopy and X-ray powder diffraction. J. Pharm. Biomed. Anal. 49 (2009) 18–25. DOI:10.1016/j.jpba.2008.09.054 |
| [4] | V. Uvarov, I. Popov, Development and metrological characterization of quantitative X-ray diffraction phase analysis for the mixtures of clopidogrel bisulphate polymorphs. J. Pharm. Biomed. Anal. 46 (2008) 676–682. DOI:10.1016/j.jpba.2007.11.026 |
| [5] | J. Ibáñez, O. Font, N. Moreno, Quantitative Rietveld analysis of the crystalline and amorphous phases in coal. Fuel 105 (2013) 314–317. DOI:10.1016/j.fuel.2012.06.090 |
| [6] | F.L.F. Soares, ${referAuthorVo.mingEn} R.L.Carneiro, Evaluation of analytical tools and multivariate methods for quantification of co-former crystals in ibuprofen-nicotinamide co-crystals. J. Pharm. Biomed. Anal. 89 (2014) 166–175. DOI:10.1016/j.jpba.2013.11.005 |
| [7] | R.D. Vickery, G.A. Nemeth, M.B. Maurin, Solid-state carbon NMR characterization of the polymorphs of roxifiban. J. Pharm. Biomed. Anal. 30 (2002) 125–129. DOI:10.1016/S0731-7085(02)00203-0 |
| [8] | K.H. Hestnes, B.E. Sørensen, Evaluation of quantitative X-ray diffraction for possible use in the quality control of granitic pegmatite in mineral production. Miner. Eng. 39 (2012) 239–247. DOI:10.1016/j.mineng.2012.06.006 |
| [9] | S.N.C. Roberts, A.C. Williams, I.M. Grimsey, S.W. Booth, Quantitative analysis of mannitol polymorphs. X-ray powder diffractometry-exploring preferred orientation effects. J. Pharm. Biomed. Anal. 28 (2002) 1149–1159. DOI:10.1016/S0731-7085(02)00053-5 |
| [10] | M. Tiwari, G. Chawla, A.K. Bansal, Quantification of olanzapine polymorphs using powder X-ray diffraction technique. J. Pharm. Biomed. Anal. 43 (2007) 865–872. DOI:10.1016/j.jpba.2006.08.030 |
| [11] | L. Alexander, H.P. Klug, Basic aspects of X-ray absorption in quantitative diffraction analysis of powder mixtures. Anal. Chem. 20 (1948) 886–889. DOI:10.1021/ac60022a002 |
| [12] | X.M. Chen, J.G. Stowell, K.R. Morris, S.R. Byrn, Quantitative study of solid-state acid-base reactions between polymorphs of flufenamic acid and magnesium oxide using X-ray powder diffraction. J. Pharm. Biomed. Anal. 51 (2010) 866–874. DOI:10.1016/j.jpba.2009.09.021 |
| [13] | V.J. Hurst, P.A. Schroeder, R.W. Styron, Accurate quantification of quartz and other phases by powder X-ray diffractometry. Anal. Chim. Acta 337 (1997) 233–252. DOI:10.1016/S0003-2670(96)00425-4 |
| [14] | R. Takehira, Y. Momose, S. Yamamura, Quantitative analysis of crystalline pharmaceuticals in tablets by pattern-fitting procedure using X-ray diffraction pattern. Int. J. Pharm. 398 (2010) 33–38. DOI:10.1016/j.ijpharm.2010.07.043 |
| [15] | M. Ernest, M.D. Bogdanovic, A. Danilovski, et al., Pharmaceutically acceptable salt and polymorphic forms of flupirtine maleate, US 2011184030 A1. |
| [16] | K.F. Landgraf, A. Olbrich, S. Pauluhn, Polymorphism and desolvation of flupirtine maleate. Eur. J. Pharm. Biopharm. 46 (1998) 329–337. DOI:10.1016/S0939-6411(98)00054-X |
| [17] | A. Nageswari, K.V.S.R. Reddy, K. Mukkanti, Stability-indicating UPLC method for determination of imatinib mesylate and their degradation products in active pharmaceutical ingredient and pharmaceutical dosage forms. J. Pharm. Biomed. Anal. 66 (2012) 109–115. DOI:10.1016/j.jpba.2012.03.022 |
| [18] | N. Vadera, G. Subramanian, P. Musmade, Stability-indicating HPTLC determination of imatinib mesylate in bulk drug and pharmaceutical dosage form. J. Pharm. Biomed. Anal. 43 (2007) 722–726. DOI:10.1016/j.jpba.2006.07.022 |