 2016, Vol. 27


b College of Chemistry and Chemical Engineering, Zhaoqing University, Zhaoqing 526061, China ;
c Key Laboratory of Synthetic Rubber, Changchun Institute of Applied Chemistry Chinese Academy of Sciences, Changchun 130022, China
Tannase (EC 3.1.1.20) is an inducible enzyme mainly produced by filamentous fungi, which hydrolyzes galloyl ester bonds present in gallotannins [1]. Thus far, tannases have mainly been commercially applied in manufacturing instant tea. The definite molecular mechanism of tannase catalysis is under investigation and needs to be demonstrated at the structural level for more accurate information. Hence, it is crucial to present a structurebased description of the molecular mechanism associated with the bioactivity of tannase. So far, the structures of fungi tannases, the main tannases applied in industry, have not been reported.
Determining the 3-D structure of proteins is a cornerstone for many aspects of modern biological research. Methods such as X-ray crystallography, NMR spectroscopy, and cryo-electron microscopy are available for the structural resolution of proteins. However, due to the technical difficulties, high costs, and labor intensiveness of these methods, protein structures are frequently predicted by modeling using modern computational techniques to annotate the biological functions of proteins [2]. There are two categories of protein structure prediction: homology modeling and ab initio modeling. The first is template based, and the full-length structure cannot be determined in the absence of complete query coverage. The ab initio modeling is free of templates and the structure is built from scratch [3].
Community-wide critical assessment of protein structure prediction (CASP) experiments has demonstrated significant advantages of composite approaches in protein structure prediction. I-TASSER [4], an online platform for protein structure prediction, is one example of a composite approach, which builds 3-D models based on multiple-threading alignments and iterative template fragment assembly simulations. I-TASSER has been widely used and ranked as the top 1 protocol for protein structure prediction over the last ten years of CASP experiments [5].
In this work, we used I-TASSER to predict the 3-D structure of tannase from Aspergillusniger N5-5. Furthermore, we have provided experimental validation of our predictions.
2. Experimental 2.1. Microorganism and inoculum preparationThe tannase-producing fungus Aspergillusniger N5-5 (CCTCCM 2014051) was isolated from Chinese gallnut. Inocula were prepared by growing the fungus for 72 h at 30 ℃. Spores were harvested in a 0.01% (v/v) solution of sterile Tween-80 in distilled water and were counted in a Neubauer chamber. A spore suspension containing 1 × 10⁶ spores mL-1 was used as the inoculum.
2.2. Plate cultureApart from the basal medium PDA, 2% (m/m) tannic acid was added to the mediumas a tannase-producing inducer, and 3% (m/m) agar was added to solidify the medium containing tannic acid. The inoculumwas aseptically added to the solidifiedmedium (1mL per plate, 40 plates) and was spread homogeneously on the surface of the medium, which were subsequently incubated at 30 ℃ for 42 h for mycelia formation.
2.3. cDNA cloningAerial mycelia were scraped off the plates into a sterile and liquid nitrogen-cooled mortar and were thoroughly ground for around 15 min, continuously adding liquid nitrogen. Total RNA were extracted using TaKaRaMiniBEST Universal RNA Extraction Kit (Takara Bio Inc., Japan) according to the manufacturer's instructions. RNA quality was subsequently checked by agarose gel electrophoresis. The first strand of cDNA was synthesized from 5 µg template RNA, viz., total RNA by reverse transcriptase and oligodT Primer (2.5 µmol/L, 1 µL).
A pair of PCR primers (Forward: 5'-ATGCGCTCCAAGATGAGCCTTCT- 3'; Reverse: 5'-CTAATACAGCGGCAGCTCGTAAGCA- 3') was designed using the Primer Premier 6.0 software (PREMIER Biosoft International, USA) according to Aspergillusnigertannase gene sequences obtained from GenBank. The PCR experiment was performed using the primers to amplify the cDNA product (5 µL) in 50 µL reaction mixture containing 0.5 µL TaKaRa Ex Taq HS (5 U/µL), 5 µL 10 × PCR Buffer Ⅱ, 2 µL dNTP Mixture (10 mmol/L each), and 35.5 µL ddH2O. The reaction conditions were as follows: 5 min pre-denaturation at 94 ℃, followed by 33 cycles of 45 s denaturation at 94 ℃, 45 s annealing at 55 ℃, 36 s primer extension at 72 ℃, followed by a final extension for 10 min at 72 ℃. The PCR products were electrophoresed on a 1% agarose horizontal slab gel and visualized by ethidium bromide staining.
2.4. TA cloning and sequencingThe amplified DNA fragments were cloned into pTG19-T Vector (Generay, China) and sequenced by ABI PRISMTM 3700 Genetic Analyser (Applied Biosystems, Japan) using the chain-termination procedure with a BigDyeTerminatorTM Cycle Sequencing Kit 3.1 (Applied Biosystems) according to the manufacturer's instructions. The nucleotide sequence of the tannase gene from Aspergillusniger N5-5 has been deposited in GenBank under accession no. KP677552.
2.5. Homology analysisThe protein sequence deduced from the cDNA sequence using ORF Finder (http://www.ncbi.nlm.nih.gov/gorf/gorf.html) was named as ‘‘proposed protein Aspergillusniger N5-5''. Then, multiple sequence alignment between the sequence of proposed protein Aspergillusniger N5-5 and the protein databasewas conducted using PSI-BLAST (http://blast.ncbi.nlm.nih.gov/Blast.cgi), a sequence similarity search tool for detecting distant relationships between proteins. Afterwards, proposed protein Aspergillusniger N5-5 and 15 different proteins with high sequence identities (all above 56%) from the aligned results were used to construct a Maximum Likelihood (ML) phylogenetic tree using MEGA 6.0 [6], and homology between the query and subject sequences was subsequently analyzed.
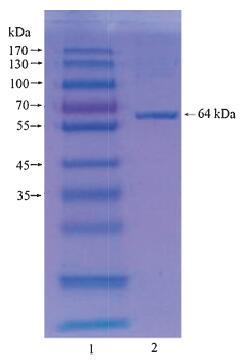
2.6. Three-dimensional structure predictionThe molecular weight of the tannase sequence was 64.1 kDa calculated using ProtParam [7], which was in accordance with the molecular weight (64 kDa) of the tannase from Aspergillusniger N5-5 detected using reducing SDS-PAGE (Fig. 1). From the result, we can infer the cDNA is just the tannase coding gene from Aspergillusniger N5-5. Therefore, we can construct the 3-D structure of tannase from Aspergillusniger N5-5 using protein structure prediction. The tannase sequence was then submitted to I-TASSER. The predicted models were sorted by C-score [8], an optimized confidence score for estimating the quality of predicted models based on multiple benchmark tests. Then, according to general guidelines, the top 5 models were collected as the candidates for tannase structure.

|
Download:
|
| Figure 1. Reducing SDS-PAGE of tannase from Aspergillusniger N5-5. Lane 1: Protein Marker; lane 2: purified tannase. | |
2.7. Experimental validation of the predicted structure
Protein particles accumulate charge at their surface due to the partial ionization of various residues that results in a surface potential. The relation between surface charge and surface potential can be approximated by the Grahame equation [9], and for the case of lower potentials, the simple equation expression is σ = ε ε0·Ψ0/λD, where σ is surface charge density defined as the amount of electric charge, q, that is present on a surface of given area, A, viz. σ = q/A, Ψ0 is surface potential, ε and ε0 are the dielectric constants of two phases, and λD is defined as the Debye length. Zeta potential is the electric potential in the interfacial double layer at the location of the slipping plane relative to a point in the bulk fluid away from the interface. Although zeta potential is not equal to surface potential in the double layer for their different locations, they vary in direct proportion to one another [10]. Moreover, for the proportional relation between surface potential and surface charge density according to Grahame equation, supposing the change in pH will not significantly affect λD and the conformation of protein, the changes of zeta potential can be regarded as the change from protein surface charge density. That is, the profile of zeta potential vs. pH can be an indirect but strict criterion for the distribution of chargeable residues on the protein surface. With this assumption, we can tentatively select protein structure models with the help of experimental measurements. Surface charges on predicted structural models were calculated at various pH values using Li's method [11, 12]. Zeta potentials of the purified tannase solutions (0.45 mg/mL) from AspergillusnigerN5-5 were measured at different pH values using Particle Sizer and Zeta Potential Analyzer (Brookhaven Instruments, USA). The optimum structural model could be chosen from the 5 predicted models by analysing proximity between zeta potentials of tannase and surface charge densities of 5 models at various pH values using surface charge densities-pH-zeta potential titration curves.
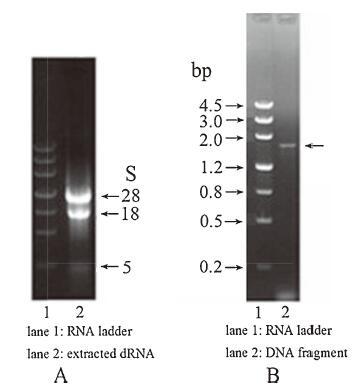
3. Results and discussionThe agarose gel electrophoresis of total RNA isolated from the mycelia and PCR products were performed respectively for quality assessment. As shown in Fig. 2, total RNA had almost no degradation (Fig. 2A), and PCR products appeared around 1750 bp as expected (Fig. 2B).

|
Download:
|
| Figure 2. Electrophoresis of total extracted RNA and DNA fragments. (A) Total RNA extracted from the mycelia electrophoresed on 1% agarose gel for 15 min at 150 V; (B) PCR products electrophoresed on 1% agarose gel for 30 min at 110 V. | |
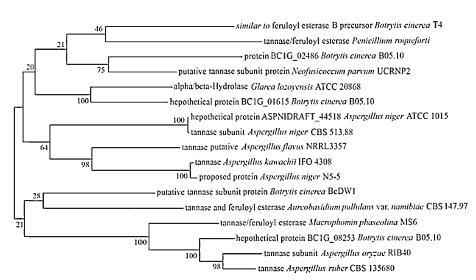
The phylogenetic tree (Fig. 3) inferred from 100 bootstrap replicates is taken to represent the evolutionary relationship between proposed protein Aspergillusniger N5-5 and a set of proteins retrieved from the protein database (non-redundant protein sequences (nr)) through PSI-BLAST. As shown in Fig. 3, proposed protein Aspergillusniger N5-5 and a tannase from the same node are sister groups [13]; they have a most recent common ancestor. Therefore, the conclusion that proposed protein Aspergillusniger N5-5 and tannase are homologous can be drawn.

|
Download:
|
| Figure 3. Phylogenetic analysis of proposed protein Aspergillusniger N5-5. The tree was constructed by MEGA 6.0 software using Maximum Likelihood method. The reliability of each branch was tested by 100 bootstrap replications. Numbers at the nodes indicated bootstrap values. The scale bar shows the amino acid number of substitutions per site. | |
The deduced protein sequence was submitted to I-TASSER, and the top 5 models according to a C-score ranking were kept as structure models (Fig. 4). These structure models were compared with the only solved homologous structure from Lactobacillus plantarum by X-ray with a resolution of 2.5Å (PDB ID: 4J0G) using TM-align [14]. These five models have TM-score values of 0.206, 0.412, 0.216, 0.410, and 0.217 respectively. TM-score has a value range from 0 to 1; higher value indicates two structures share more similarities. In addition, the sequence similarity of tannase between from Aspergillusniger N5-5 and 4J0G (chain A) is 34.4% aligned using EMBOSS Water (http://www.ebi.ac.uk/Tools/psa/ emboss_water). Therefore, the high TM-score value of model 2 and sequence similarity between the two tannases may suggest they should have similar folds in their structures, and model 2 maybe the closest-native structure model of Aspergillusniger N5-5.

|
Download:
|
| Figure 4. Top 5 models predicted by I-TASSER. From model 1 to model 5, the C-score (Confidence score) rate from high to low. A C-score of higher value signifies a model with a high confidence and vice versa. | |
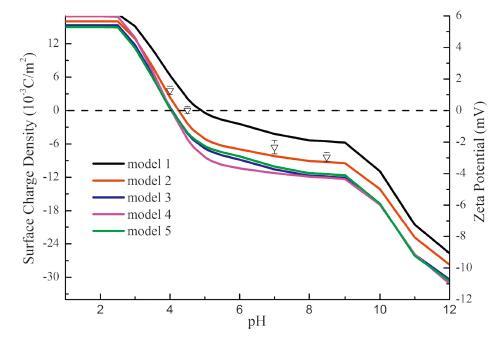
Further, we attempt to utilize more experimental data to depict the structure model of tannase from Aspergillusniger N5-5. As illustrated in Fig. 5, the pHdependence of the surface charge density of model 2 is the best match to the experimental zeta potential-pH titration profile. This is evidence that the proposed 3-Dstructure has correct folding at least regarding the location of chargeable residues on the protein surface. The introduction of zeta potential-pH titration profile in the selection of protein structuremodels seemsto provide acceptable discrimination over different folds. However, solid verificationof thismethodmay needfurther studywhichis still undergoing.

|
Download:
|
| Figure 5. Surface charge density-pH-zeta potential titration curves. The curves represent surface charge densities of 5 predicted models at various pH values, and the symbols represent zeta potentials of tannase at 4 different pH values. | |
4. Conclusion
In the current study, we extracted total RNA from Aspergillusniger N5-5 and cloned the cDNA sequence using RT-PCR amplification. Protein sequence deduced from the cDNA sequence was inferred as a homologue of tannase through sequence alignment and phylogenetic analysis. The deduced protein sequence was subsequently submitted to I-TASSER to predict the 3-D structure of the enzyme. From the top 5 predicted 3-D structure models, model 2 with the best match to the surface charge density-pH titration profile was validated as the final structure of the enzyme. This study lays an important foundation for catalytic mechanism research of fungi tannases.
AcknowledgmentsThe authors are grateful to the National Natural Science Foundation of China (No. 21374117) and the 100 Talents Program of Chinese Academy of Sciences for financial support.
| [1] | C.N. Aguilar, R. Rodríguez, G. Gutié rrez-Sá nchez, et al. , Microbial tannases: advances and perspectives. Appl. Microbiol. Biotechnol. 76 (2007) 47–59. DOI:10.1007/s00253-007-1000-2 |
| [2] | M. Srivastava, S.K. Gupta, P.C. Abhilash, N. Singh. Structure prediction and binding sites analysis of curcin protein of Jatropha curcas using computational approaches. J. Mol. Model. 18 (2012) 2971–2979. DOI:10.1007/s00894-011-1320-0 |
| [3] | Y. Zhang. Progress and challenges in protein structure prediction. Curr. Opin. Struct. Biol. 18 (2008) 342–348. DOI:10.1016/j.sbi.2008.02.004 |
| [4] | J.Y. Yang, R.X. Yan, A. Roy, et al. , The I-TASSER suite: protein structure and function prediction. Nat. Methods 12 (2015) 7–8. |
| [5] | Y. Zhang. Interplay of I-TASSER and QUARK for template-based and ab initio protein structure prediction in CASP10, . Proteins 82 (2014) 175–187. |
| [6] | K. Tamura, G. Stecher, D. Peterson, A. Filipski, S. Kumar. MEGA6: molecular evolutionary genetics analysis version 6.0. Mol. Biol. Evol. 30 (2013) 2725–2729. DOI:10.1093/molbev/mst197 |
| [7] | M. Wayengera. Searching for new clues about the molecular cause of endomyocardial fibrosis by way of in silico proteomics and analytical chemistry. PLoS ONE 4 (2009) e7420. DOI:10.1371/journal.pone.0007420 |
| [8] | Y. Zhang. I-TASSER: fully automated protein structure prediction in CASP8. Proteins 77 (2009) 100–113. DOI:10.1002/prot.v77.9s |
| [9] | H.J. Butt, K. Graf, M. Kappl, Physics and Chemistry of Interfaces, Wiley-VCH, Weinheim, 2004p. 64. |
| [10] | P.B. Lorenz. Surface conductance and electrokinetic properties of kaolinite beds. Clays Clay Miner. 17 (1969) 223–231. DOI:10.1346/CCMN |
| [11] | Y.Q. Li, L.J. An, Q.R. Huang. Replica exchange Monte Carlo simulation of human serum albumin-catechin complexes. J. Phys. Chem. B 118 (2014) 10362–10372. DOI:10.1021/jp5048503 |
| [12] | Y.Q. Li, Q. Zhao, Q.R. Huang. Understanding complex coacervation in serum albumin and pectin mixtures using a combination of the Boltzmann equation and Monte Carlo simulation. Carbohydr. Polym. 101 (2014) 544–553. DOI:10.1016/j.carbpol.2013.09.056 |
| [13] | N.S. Bujang, N.A. Harrison, N.Y. Su. A phylogenetic study of endo-beta-1, , 4-glucanase in higher termites. Insect. Soc. 61 (2014) 29–40. DOI:10.1007/s00040-013-0321-7 |
| [14] | Y. Zhang, J. Skolnick. TM-align: a protein structure alignment algorithm based on the TM-score. Nucleic Acids Res. 33 (2005) 2302–2309. DOI:10.1093/nar/gki524 |