 2016, Vol. 27


Matrix-assisted laser desorption/ionization mass spectrometric imaging (MALDI MSI) has become a powerful tool in biological,chemical and clinical applications since its introduction in 1980s due to its spatial resolution and label-free detection properties [1]. With MALDI MSI,both chemical information and spatial distribution of each analyte can be obtained through direct analysis of thin tissue sections [2]. Compared with other imaging methods,MALDI MSI can determine the distribution of multiple compounds in a single measurement and may provide a higher mass range and mass resolution [3]. Nowadays,MALDI MSI has been used to determine the local concentrations of proteins,peptides,lipids,drugs,metabolites,and other compounds in biological tissues [4-11] and polymers [12].
To the best of our knowledge,MALDI MSI has been applied mostly to determine the localized distribution of analytes in solid matrices (such as tissues and polymers) and was successfully employed in the determination of some biomarkers in tumor tissue sections which can provide not only spatial distribution,but also semi-quantitative information in tissues [13-15]. However,direct quantitative analysis of interested peptides and proteins in physiological fluids (serum,urine) is seldom realized by this kind of imaging technique. The stable-isotope labeling (SIL) technique,including chemical,enzymatic and metabolic methodologies,is a powerful method for absolute and relative quantitation [16, 17]. However,these techniques necessitate expensive labeling reagents (e.g. ICAT,SILAC,iTRAQ) and complicated,time-consuming separation steps [18]. The novel label-free method based on liquid chromatography requires complicated computation and reliable separation as the outcome is strongly dependent on the liquid chromatography (HPLC) conditions [19]. There are several key advantages of MALDI-MSI over traditional quantitative methods,namely,no requirement to label the analyte due to its identification by its mass and fragmentation pattern and the ability to detect multiple analytes from one experiment (with full mass range capabilities).
A patterned hydrophilic chip based MALDI MSI is reported here to accomplish quantitative analysis of peptides in solution via image analysis. The patterned hydrophilic chip is a hydrophilic-hydrophobic hybrid chip which contains two different areas with the surface of each modified by different materials to achieve hydrophilic or hydrophobic properties [20, 21]. The use of the patterned hydrophilic chip gives a spatial delimitation of samples and insures the reproducibility of sample distribution. The images from MALDI MSI can reflect the distribution of analytes in hydrophilic spots and then quantitation information in solution [22].
The aim of this study was to broaden the application of MALDI MSI from solid to solution samples and develop a direct quantitative analysis of peptides in solution. The label-free and separation-free utilization properties of the patterned hydrophilic chip based MALDI MSI makes it a simple,feasible and potential quantification method.
2. ExperimentalIndium-Tin Oxide (ITO) glass was purchased from Hudson Surface Technology (Old Tappan,NJ). Polydimethylsiloxane (PDMS,Sylgard184) was obtained from Dow Corning (Midland,MI). Four peptides (Bradykinin fragment 1-7,Angiotensin Ⅱ (human),P14R (synthetic peptide),and ACTH fragment 18-39),the peptide standards for MALDI MS,and α-cyano-4-hydroxycinnamic acid (99%,CHCA) were purchased from Sigma-Aldrich (St. Louis,MO). Acetonitrile (HPLC grade) and trifluoroacetic acid (99.5%) were purchased from J&K Chemical (Beijing,China). All aqueous solutions were prepared using deionized water (18.2 MΩ cm resistivity) purified with an A10 Milli-Q water purification system (Merck Millipore,Billerica,MA).
In order to obtain a hydrophilic-hydrophobic hybrid chip,screen-printing method was applied here using ITO as hydrophilic material and PDMS as hydrophobic material. The screen-printing model was designed by Computer Aided Design (CAD),then PDMS was screen-printed on ITO glass as a hydrophobic surround [23]. A TORCH T3244 manual screen-printing machine (Beijing Torch Co.,Ltd.,China) was used to fabricate the patterned hydrophilic chip. The mesh number of the white area was 200 to make the hydrophobic polymer pass through.
Samples of 1.5 μL containing the same concentrations of four peptides were applied into hydrophilic spots on the chip by the dried-droplet method and allowed to dry under ambient conditions before spectral acquisition. The matrix used was 10 mg/mL CHCA in 50% acetonitrile and 0.1% trifluoroacetic acid.
MALDI MS imaging was carried out on an AB Sciex 4800 plus MALDI-TOF/TOF MS equipped with a Nd:YAG laser (emitting at 355 nm,operated at 200 Hz). The images were recorded in reflectron positive ion mode and externally calibrated with ‘‘TOF/TOF calibration’’ standard solution (AB Sciex,Framingham,MA). Both 4000 series Explorer (AB Sciex,Framingham,MA) and 4000 imaging softwares were used for data acquisition and processing. The laser energy and the raster step size were set at 18 μJ and 100 μm,respectively. Each mass spectrum per pixel was collected by averaging the signals of 200 individual laser shots at fixed position.
Biomap software (Novartis,Basel,Switzerland) was used for image analysis. The obtained spectral data of each scan were transformed to image data using Biomap software in which the mass range,bin size and layout were fixed for all the samples. Then a desired mass was extracted in the spectral profile to plot the image of this species. After transformation,the data were saved as 8-bit grayscale images and analyzed using MATLAB software (version 4.0,The MathWorks,Inc.,Natick,MA) for the sum of grayscale of region of interest (ROI) in each image [24]. ROIs designed in MATLAB analysis were the same rectangles including the hydrophilic spots in the chip. For 8-bit images,the pixel values ranged from 0 to 255. The external standard method was used to quantify peptides in solution. The relationship between the sum of grayscale for each extracted image and the sample concentration was plotted with best-fit regression analysis.
3. Results and discussionThe patterned hydrophilic chip (Scheme 1) used in this study was a hybrid hydrophilic-hydrophobic glass plate containing a collection of hydrophilic ITO spots surrounded by hydrophobic polymer material. To obtain more reliable results,the sampling areas were restricted using the hydrophilic spots in the chip which eliminated heterogeneity of sample preparation,and therefore the ionization effect. The patterned hydrophilic chip based MALDI MSI quantification analysis procedure was illustrated in Scheme 1. Considering the shape of the droplet,the hydrophilic spots were designed to be circles. Then the hydrophilic-hydrophobic hybrid chip was prepared as described in Experimental section,fixed on a MALDI plate and submitted to MALDI TOF MS. Both absolute and relative quantitative analyses can be achieved using the patterned hydrophilic chip based MALDI MSI quantification analysis.

|
Download:
|
| Scheme 1. Schematic illustration of the patterned hydrophilic chip based MALDI MS imaging procedure | |
A patterned hydrophilic chip can be prepared by many different methods,such as screen-printing,spin-coating,and ink-jet printing. The hydrophilic or hydrophobic polymer materials were deposited onto the substrate to form desired structures. Screenprinting was simpler and cheaper than other methods and selected in this work. In screen-printing,a design was imposed on a fine mesh screen,with blank areas coated with an impermeable substance. Since the MALDI ionization process is enhanced by the presence of a conductive surface (ITO coated glass slides,stainless steel plates,gold-plated stainless steel plates,etc.) under the sample and the surface of ITO glass is hydrophilic due to metallic oxide and hydroxyl and carbonyl group content,ITO glass was selected as the hydrophilic surface of our hybrid chip. The screenprinting model contained an array of impermeable spots that would result in exposed ITO hydrophilic spots on the chip. PDMS was a hydrophobic polymer that was commonly used for making microfluidic chips and in the present study,it was chosen as the hydrophobic material for the areas surrounding the spots. The PDMS prepolymer and curing agent (Sylgard 184,Dow Corning) were mixed in a 10:1 ratio (w/w). Then,air bubbles were removed by applying a vacuum. After screen-printing PDMS on ITO glass,the patterned hydrophilic chip was cured at 60℃ for 2 h. Fig. S1 in Supporting information shows a comparison of wetting states and contact angles of water droplets on the PDMS surface and ITO glass surface.
The size of the spots in the pattern depended on the shape of the water droplets. The effect of spot radius in the chip on the MSI images and laser consumption was evaluated. Coμmercial mass spectrometers utilize laser spot sizes between 20 μm and 100 μm,depending on the manufacturer. The MALDI MS used in this study had a laser spot size of 50 μm,and spots with radii of 400 μm,500 μm,800 μm,1000 μm,and 1200 μm in the chip were evaluated. Because PDMS and ITO glass were transparent,the spots were evaluated using fluorescent images (Fig. S2 (A-E) in Supporting information),which were captured by laser confocal scanning microscopy after applying a layer of CHCA. Spots with radii less than 1000 μmwere somewhat irregular. This was mainly attributed to the limitations of the screen-printing machine used. When the analysis area was too small,not enough quantitative pixel information was obtained and would increase the measurement error. When the spot radius was larger than 1000 μm,the results were approximately satisfactory. However,the laser consumption and imaging time increased. Meanwhile,a 1.5 mL sample volume was selected as an estimated spot radius of about 1000 μmin free space was observed. Finally,we selected 1000 μm as the spot radius for the quantitative analysis. Furthermore,a raster size of 100 μm was used related to our laser spot of 50 μm. Considering the sampling number of each sample was almost the same,the sum of pixel of each image on the uniform surface was used for final analysis and the influence of under sampling was negligible. Also,the laser was very expensive consumable for the MALDI instrument and numerous laser shots were needed for a single MALDI imaging process,and therefore,we reduced the sampling number in order to achieve an acceptable result.
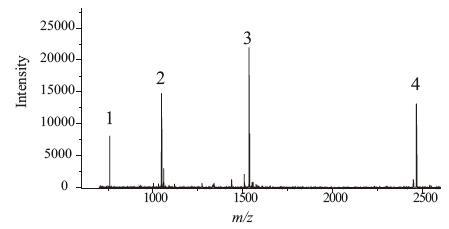
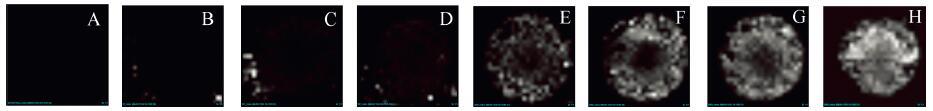
Simultaneous quantitative analysis of multiple peptides was tested by the MSI method. Samples were applied on the patterned hydrophilic chip in spots with the same radius (1000 μm) so that the sampling and analysis areas were constant. Mixtures containing different concentrations (ranging from 5 fmol/mL to 1000 fmol/mL) of four peptides (Bradykinin fragment 1-7,Angiotensin Ⅱ (human),P14R (synthetic peptide) and ACTH fragment 18-39) were prepared. Fig. 1 showed the mass spectra of the four peptides. Aliquots (1.5 mL) of these mixtures were dropped onto the 1000 μm hydrophilic spots. After drying,the surface of the hydrophilic spot was coated with 1.5 mL CHCA solution (10 mg/mL). MALDI imaging was carried out in a 2.5 μm × 2.5 μm area with a pixel size of 100 μm. The imaging process took several minutes for each spot. Four components could be analyzed simultaneously with one experimental run. After extracting the mass spectra using Biomap,a distribution image for each specific analyte was prepared. Fig. 2 presents the mass images of one peptide (P14R (synthetic peptide),M + H = 1533.8582),at eight concentrations in grayscale. This image shows an increasing trend of grayscale with increasing concentration. The MALDI images of the other three peptides are shown in Figs. S3-S5 in Supporting information.

|
Download:
|
| Figure 1. MALDI TOF MS spectra of four peptides: 1. Bradykinin fragment 1–7, M + H = 757.3997; 2. Angiotensin Ⅱ (human),M + H = 1046.5423; 3. P14R (Synthetic peptide), M + H = 1533.8582; and 4. ACTH fragment 18–39, M + H = 2465.1989. (Concentration = 500 fmol/μL). | |

|
Download:
|
| Figure 2. MALDI MS images of P14R (M + H = 1533.8582) at several concentrations. The concentrations of A through H were 5, 10, 20, 50, 200, 400, 600, and 800 fmol/μL, respectively. (pixel size = 100 mm.) | |
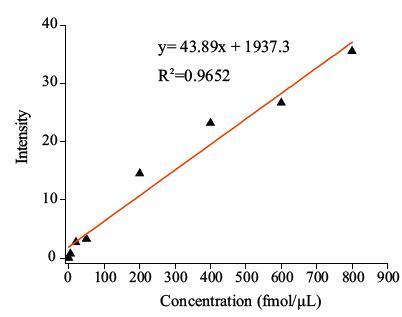
After interpretation of the images to pixel data by Matlab,the quantitative relationship between grayscale and concentration for P14R is obtained (Fig. 3). The linear relationships for all four peptides are summarized in Table 1. Good linear correlations in the range of 5-800 fmol/mL were obtained for all four peptides. Precision was evaluated using the calculated relative standard deviation (RSD),where RSD = standard deviation/average × 100%. Seven identical samples containing 100 fmol/mL of each peptide were applied onto the patterned hydrophilic chip spots and analyzed by MALDI MSI. The RSDs of Bradykinin fragment 1-7,Angiotensin Ⅱ,P14R and ACTH fragment 18-39 were 11.72%,6.65%,7.50%,and 9.48%,respectively.

|
Download:
|
| Figure 3. Relationship between concentration and grayscale in MALDI image for P14R (synthetic peptide) | |
|
|
Table 1 Quantitative results for four peptides |

4. Conclusion
Patterned hydrophilic chip based MALDI MS imaging was successfully applied for quantitative analysis of peptides in solution. MALDI MS imaging can be used for peptide quantitative analysis in solution besides profiling in tissue. This quantitative method needs no labeling agent,and requires no separation step for multiple analytes. Good linear correlations were observed between four peptides and their MALDI MSI grayscales,and the coefficients of determination (R2) were obtained from the mass images. Low-femtomole sensitivity was achieved for all four peptides. This method possessed very good sensitivity,repeatability,and simplicity. Relative quantitation between different concentrations can be easily realized through MALDI MSI. It will be further applied to more complicated analytes (proteins,small molecules,and sugars in physiological fluids).
Appendix A. Supplementary data
Supplementary data associated with this article can be found,in the online version,at http://dx.doi.org/10.1016/j.cclet.2016.02.020.
| [1] | B. Cillero-Pastor, R.M.A. Heeren. Matrix-assisted laser desorption ionization mass spectrometry imaging for peptide and protein analyses: a critical review of ontissue digestion. J. Proteome Res. 13 (2014) 325–335. |
| [2] | R.M. Caprioli, T.B. Farmer, J. Gile. Molecular imaging of biological samples: localization of peptides and proteins using MALDI-TOF MS. Anal. Chem. 69 (1997) 4751–4760. |
| [3] | D.S. Cornett, M.L. Reyzer, P. Chaurand, R.M. Caprioli. MALDI imaging mass spectrometry: molecular snapshots of biochemical systems. Nat. Methods 4 (2007) 828–833. |
| [4] | I.D. Grishin. MALDI TOF mass spectrometry for the investigation of the structure of ruthenium carborane complexes. J. Anal. Chem 68 (2013) 1123–1129. |
| [5] | R.Q. Wang, K. Druckenmüller, G. Elbers, K. Guenther, J.-P. Croué. Analysis of aquatic-phase natural organic matter by optimized LDI-MS method. J. Mass Spectrom. 49 (2014) 154–160. |
| [6] | P.J. Todd, T.G. Schaaff, P. Chaurand, R.M. Caprioli. Organic ion imaging of biological tissue with secondary ion mass spectrometry and matrix-assisted laser desorption/ionization. J. Mass Spectrom. 36 (2001) 355–369. |
| [7] | F. Tang, Y. Chen, T.G. Li, et al. A quick and effective multivariate statistical strategy for imaging mass spectrometry. Chin. Chem. Lett. 25 (2014) 1331–1335. |
| [8] | M.L. Reyzer, Y.S. Hsieh, K. Ng, W.A. Korfmacher, R .M. Caprioli. Direct analysis of drug candidates in tissue by matrix-assisted laser desorption/ionization mass spectrometry. J. Mass Spectrom. 38 (2003) 1081–1092. |
| [9] | L.A. McDonnell, R.M.A. Heeren. Imaging mass spectrometry. Mass Spectrom. Rev. 26 (2007) 606–643. |
| [10] | M.R. Groseclose, M. Andersson, W.M. Hardesty, R.M. Caprioli. Identification of proteins directly from tissue: in situ tryptic digestions coupled with imaging mass spectrometry. J. Mass Spectrom. 42 (2007) 254–262. |
| [11] | M. Stoeckli, D. Staab, M. Staufenbiel, K.-H. Wiederhold, L. Signor. Molecular imaging of amyloid b peptides in mouse brain sections using mass spectrometry. Anal. Biochem. 311 (2002) 33–39. |
| [12] | K. Krueger, C. Terne, C. Werner, et al. Characterization of polymer membranes by MALDI mass-spectrometric imaging techniques. Anal. Chem. 85 (2013) 4998–5004. |
| [13] | R. Ait-Belkacem, C. Berenguer, C. Villard, et al. Monitoring therapeutic monoclonal antibodies in brain tumor. MAbs 6 (2014) 1385–1393. |
| [14] | R. Longuespée, C. Boyon, A. Desmons, et al. Spectroimmunohistochemistry: a novel form of MALDI mass spectrometry imaging coupled to immunohistochemistry for tracking antibodies. OMICS-A J. Integr. Biol 18 (2014) 132–141. |
| [15] | V. Mainini, G. Bovo, C. Chinello, et al. Detection of high molecular weight proteins by MALDI imaging mass spectrometry. Mol. Biosyst. 9 (2013) 1101–1107. |
| [16] | K. Kristjansdottir, S.J. Kron. Stable-isotope labeling for protein quantitation by mass spectrometry. Curr. Proteomics 7 (2010) 144–155. |
| [17] | W.W. Wu, G.H. Wang, S.J. Baek, R.F. Shen. Comparative study of three proteomic quantitative methods, DIGE, cICAT, and iTRAQ, using, 2D gel-or LC-ALDI TOF/TOF. J. Proteome Res. 5 (2006) 651–658. |
| [18] | P.J. Boersema, R. Raijmakers, S. Lemeer, S. Mohammed, A.J.R. Heck. Multiplex peptide stable isotope dimethyl labeling for quantitative proteomics. Nat. Protoc. 4 (2009) 484–494. |
| [19] | M. Bantscheff, M. Schirle, G. Sweetman, J. Rick, B. Kuster. Quantitative mass spectrometry in proteomics: a critical review. Anal. Bioanal. Chem. 389 (2007) 1017–1031. |
| [20] | Y.D. Kim, C.B. Park, D.S. Clark. Stable sol-gel microstructured and microfluidic networks for protein patterning. Biotechnol. Bioeng. 73 (2001) 331–337. |
| [21] | M. Lee, K.H. Kim, J.G. Park, et al. Fabrication of a hydrophobic/hydrophilic hybridpatterned microarray chip and its application to a cancer marker immunoassay. BioChip J. 6 (2012) 10–16. |
| [22] | L.A. McDonnell, A. Römpp, B. Balluff, et al. Discussion point: reporting guidelines for mass spectrometry imaging. Anal. Bioanal. Chem. 407 (2015) 2035–2045. |
| [23] | S.H. Zuo, Y.J. Teng, H.H. Yuan, M.B. Lan. Direct electrochemistry of glucose oxidase on screen-printed electrodes through one-step enzyme immobilization process with silica sol-gel/polyvinyl alcohol hybrid film, Sens. Actuators. B: Chem. 133 (2008) 555–560. |
| [24] | N. Takai, Y. Tanaka, K. Inazawa, H. Saji. Quantitative analysis of pharmaceutical drug distribution in multiple organs by imaging mass spectrometry. Rapid Commun. Mass Spectrom. 26 (2012) 1549–1556. |