 2016, Vol. 27


Cloud point extraction (CPE) has been utilized to design efficient extraction methods for the separation,preconcentration and purification of compounds in food samples [1, 2, 3],environmental samples [4, 5, 6, 7],biological/clinical samples [7, 8, 9, 10, 11],dyes [12, 13, 14, 15],biomaterials [16],pharmaceutical [17, 18],metal chelates [19, 20],for the removal of pollutants from aqueous industrial streams and wastewaters [21, 22] and toxic elements [23]. The use of preconcentration steps based on phase separation by CPE offers a convenient alternative to the more conventional extraction systems. The small volume of the surfactant-rich phase obtained with this method permits the design of extraction schemes that are simpler,cheaper and of lower toxicity than extractions that use organic solvents [24] and also provides results similar to those obtained through other separation techniques [20, 25]. In the conventional CPE,non-ionic surfactants (e.g.,Triton X-114 and Triton X-100) are widely used because of their suitable critical micellar concentration and cloud point [26].
CPE has been shown to be an effective method for analyte extraction,preconcentration and purification for improving sensitivity,selectivity,detection limit and other analytical characteristics prior to HPLC [27],GC [28],CE [20, 29],spectroscopy [30, 31],inductively coupled plasma (ICP) [32],atomic absorption spectrometry [33, 34],flow injection [35],paptode [15] and solution scanometry [36]. In our previous work [15],to overcome some of the disadvantages of the abovemethodswe introduce a newmethod called CPE-Paptode. While this method enjoys some advantages such as; simplicity (handheld scanner and PC),high scanning speed,affordability,portability and easily immobilizing of reactants,no need for finding the λmax,intensing archive of experienments,short response time,limiting the interferences,capability for various simultaneous tests and using of non-transparent and investigation of the reflective properties of the surface,there are disadvantages as well such as the lack of uniformity in the membrane that causes serious effects on the relative standard deviation percentage and precision of analysis. In addition,the repeatability is relatively low. The mentioned disadvantages are modified in a goodmanner in the scanometry method.
The scanometry technique was introduced recently by Abbaspour et al. [37]. They used commercially available flatbed-scanners for the purpose of obtaining the images of color solutions. The obtained images have been transferred to computer for analyzing and determining the intensity of color solutions. The method is based on the reaction in solution phase in Plexiglas® cells. The solution was scanned and finally the RGB (red,green and blue) color model was used in a color monitor [15, 38, 39]. This method has many advantages such as novelty,facility,high speed,sensitivity,low cost and safety of GC and LC techniques. The use of cosmetic colorants is a traditional practice that lends esthetic appeal to cosmetic products. Especially,the use of synthetic dyes has been regarded as the most reliable and economical method for providing color to cosmetic products. However,most of the colorants have adverse effects on the human body. In recent years,the coloring agents in cosmetics have been linked to a sharp rise in skin diseases [40]. Due to the expansion of the use of cosmetics colors,releasing them in nature especially in water samples can be an environmental risk. Also the relative safety of these colors may be popular as a tracer [41] to investigate subsurface water movement. Therefore,the measurement of trace amount of these colors in different samples including water is a necessity.
Violet Covasol (Fig. 1) is an anthraquinone color that functions as a colorant in cosmetic formulations. Violet Covasol and Ext. D & C Violet No. 2 are also known as Cl 60730,2-[(9,10-dihydro-4- hydroxy-9,10 dioxo-1-anthracenyl)amino]-5-methylbenzenesulfonic acid monosodium salt; benzenesulfonic acid,2-[(9,10- dihydro-4-hydroxy-9,10-dioxo-1-anthracenyl)amino]-5-methyl-,monosodium salt [42],sodium 4-[(9,10-dihydro-4-hydroxy-9,10- dioxo-1-anthryl)amino]toluene-3-sulfonate [43],monosodium salt of 1,5-bis(o-sulfo-p-toluino)anthraquinone [44],monosodium salt of 1-hydroxy-4-(sulfo-p-toluino)anthraquinone [45, 46, 47],1(2- sulfo-p-toluidino)4-hydroxyanthraquinone [48],11362 Violet,acid violet 43,acid alizarine violet r,acid violet anthraquinone, ahcoquinone blue ir,Alizarin violanol r,Alizarine brilliant violet r,Alizarin eirisol r, alizarin eirisol rd [49].

|
Download:
|
| Fig. 1. Molecular structure of Violet Covasol. | |
Various analytical methods such as the spectrofluorimetric method [50, 51, 52, 53] and thin layer chromatography (TLC) [54, 55],FI-fluorimetric,FIA spectrophotometric [51],high-pressure liquid chromatography (HPLC) [56],spectrophotometric methods [52],gel permeation chromatography (GPC)-LC-ESI-MS/MS [57] and capillary electrophoresis (CE) [58] have been developed for the analysis of dyes in cosmetics. The most popular method involves liquid chromatography (LC) separation followed by spectrophotometric detection [59, 60, 61, 62, 63, 64, 65, 66, 67]. There is only several reports about the determination of Violet Covasol [56, 62]. Therefore,the development of a simple,sensitive and accurate method for the analysis of Violet Covasol is important. CPE-Scanometry is a new option for this propose.
However,the main goal of this study is the preconcentration and determination of trace amount of Violet Covasol dye in water samples.
2. Experimental 2.1. ApparatusThe cells (with 1000 μL volume for each) were built using a sheet of Plexiglas® . A Canoscan LiDE 200 flatbed scanner was used to scan the Plexiglas® sheet. The resolution of the scanner was regulated at 300 dpi. The VB based special software [35] was used to convert the recorded pictures of color of cells to RGB data. Biohit prolinepipettors 0.5-10,10-100 and 100-1000 μL was used for injecting samples into the cells. A Metrohm (Herisau,Switzerland) digital pH meter Model 827 with a combined glass electrode was used to measure pH values. An F.A.G thermostat bath (Iran) maintained at the desired temperature was used for the cloud point temperature experiments. Absorbance measurements were made using a Perkin Elmer Lambda 25 model (USA),UV-vis spectrophotometer equipped with 1 cm quartz cells. Centrifuge,RHB model (Germany) was used for the cloud point methodology.
2.2. MaterialsAll chemicals used in this work were of analytical grade. In addition,double distilled water was used throughout. A 1% (w/v) Triton X-114 (Fluka,Buchs,Switzerland) solution was prepared by dissolving 1 g of Triton X-114 in 100-mL volumetric flask. Violet Covasol (sodium 2-(4-hydroxy-9,10-dioxo-9,10-dihydroanthracen- 1-ylamino)-5-methylbenzenesulfonate),Tartrazine and Quinoline Yellow were purchased from Neelikon (Maharashtra,India). A stock solution of 100 mg L-1 of Violet Covasol was prepared and the more diluted solutions were prepared from it. Nitrate salts of cadmium,cobalt,nickel,copper,zinc,magnesium,chromium,cerium,calcium,potassium and other salts from Merck were of the highest purity available and used without any further purification. Other chemicals used were from Merck. The pH adjustment was done by the addition of dilute hydrochloric acid or sodium hydroxide to prepare solutions with desired pH values. The surfactant rich phase was diluted with ethanol.
2.3. Spectrophotometric studyThe acidity constant of Violet Covasol was easily obtained in a pH range of 1.0-13.0 at 25±0.5 °C. After each pH adjustment by hydrochloric acid or sodium hydroxide for a 5×10⁻³ mol L-1 dye solution,the proper amount of solution was transferred into the quartz cell and the absorption spectra were recorded. In all experiments,the ionic strength of the solutions was kept constant at 0.1 mol L-1 using potassium nitrate as the supporting electrolyte. The obtained absorbance-pH data was used for the calculation of the protonation constant and molar absorbance spectra by the HypSpec program,a newer version of the pHab program [68, 69].
2.4. Principles of the RGB color system and preparation of cells arrayThe RGB color model is an additive color model in which red,green and blue light are added together in various ways to reproduce a broad array of colors. In computing,the color values are often stored as integer numbers in the range of 0-255,the range that a single 8-bit byte can offer (by encoding 256 distinct values). In the RGB system,any color is represented in the form of (R,G,B),in which the (0,0,0) and (255,255,255) refer to black and white,respectively. Therefore,by increasing the intensity of colors,the color values are decreased. In this system,16,777,216 colors can be made. Any color can be described by the parameter V (Value) with the following formula:
| $V{\rm{ = }}R{\rm{ + 256}}G{\rm{ + 2562}}B$ | (1) |
where,R,G and B are red,green and blue values of the main color. For black and white,V is equal to 0 and 16,777,216,respectively.
In fact,V is the basis of the RGB system and is defined this way to identify a specific number for each color. The main use of the equation in color analysis programming is that the value of V for each color pixel is calculated by a function called "point" in visual basic and then according to the above mentioned equation through which V is calculated,R,G,and B parameters can be extracted by the following simple algorithm:
| $R{\rm{ = }}V{\rm{Mod256}}$ | (2) |
| $G{\rm{ = }}\left( {\left( {V - R} \right){\rm{Mod}}\left( {2562} \right)} \right){\rm{/256}}$ | (3) |
| $B{\rm{ = }}\left( {V - R - G \times 256} \right){\rm{/2562}}$ | (4) |
"Mod" is a numeric function which returns the remainder when dividing two numbers.
The individual cylindrical cavities in the sheet of Plexiglas serve as reaction chambers. These cylindrical cavities (id 1.5 cm) in the sheet of Plexiglas® (thickness 0.5 cm) are fabricated with a laser beam. In order to close the bottom of the holes and make the cells,this holed sheet was stuck to another sheet of Plexiglas® (thickness of 0.1 cm).
In our design the cells were aligned to 3 columns and 7 rows,giving a total of 21 cells in the Plexiglas® sheet.
2.5. ProcedureA typical cloud point experiment was carried out using the following procedure. An aliquot of 15 mL of an aqueous solution containing 3 μgmL-1 of Violet Covasol,0.13% (w/v) of Triton X-114 at pH = 2 was prepared. Then,the mixture was heated for 7 min in a thermostatic bath at 40 °C. The separation of the two formed phases was carried out by centrifuging for 7 min. The surfactant-rich phase became viscous and was retained at the bottom of the tubes while the bulk aqueous phase can be decanted easily. The surfactant rich phase was diluted with ethanol to 500 μL,and 480 μL of this solution was injected into the one cell on Plexiglas® sheet,and in a similar manner to other cells. After shaking,the color cells were scanned with the scanner and the obtained images of the color solutions were analyzed to evaluate R,G and B values by the developed software. The values of the RGB colors varied between 87 and 167 relative to the Violet Covasol concentration. In the scanometry,contrary to spectrophotometry the reflection of color solutions is studied; therefore one of the R,G and B values of color solutions that has the same color as the solution is usually useless,because this value is often higher than 167,and does not significantly change during the experiment. In this study,because of violet colorful solutions of Violet Covasol,the blue did not change significantly (and was almost greater than 167),but the intensity of the red and green values was considerable. The highest intensity is assigned to green and therefore it was chosen as an essential signal. Any effective intensity in the color values (R,G and B) between sample solutions and blanks were plotted vs. the considerable parameter.
| ${\rm{Effective intensit}}{{\rm{y}}_{\rm{R}}}{\rm{ = - log}}\left( {{R_{{\rm{sample}}}}{\rm{/}}{R_{{\rm{blank}}}}} \right)$ | (5) |
| ${\rm{Effective intensit}}{{\rm{y}}_{\rm{G}}}{\rm{ = - log}}\left( {{G_{{\rm{sample}}}}{\rm{/}}{G_{{\rm{blank}}}}} \right)$ | (6) |
| ${\rm{Effective intensit}}{{\rm{y}}_{\rm{B}}}{\rm{ = - log}}\left( {{B_{{\rm{sample}}}}{\rm{/}}{B_{{\rm{blank}}}}} \right)$ | (7) |
Real samples including tap water (Fig. 2a),waste water of cinere manufactory (in Yasouj city) (Fig. 2b),water movement (after using the Violet Covasol as tracer) (Fig. 2c),were used without any preliminary preparation. Two to eight milliliters of the samples were taken and measured according to the method mentioned in this section. The corresponding images were shown in Fig. 2.

|
Download:
|
| Fig. 2. Scanning images of real samples: (a) tap water, (b) waste water of cinere manufactory (in Yasouj city) and (c) water movement (after using the Violet Covasol as tracer). | |
3. Results and discussion
Preliminary acidity constants of Violet Covasol were determined by Spectrophotometric methods using the HypSpec program. The trace amount of Violet Covasol as a cosmetic dye was determined by the CPE-Scanometry method. The RGB parameters of dye were recorded after CPE with Triton X-114. The G parameter for 3 μgmL-1 of Violet Covasol was found to be the most sensitive signal without and with cloud point extraction (0.0029 and 0.1262 respectively) thus this technique can be used as a sensitive method. Various experimental parameters,such as pH of the medium,Triton X-114 concentration,the temperature,the time in the bath and the centrifuge time were studied to identify an optimized system. These parameters were optimized by the oneat- a-time evaluation method.
3.1. Determination of protonation constant of Violet Covasol by spectrophotometric methodSpectrophotometric method is,in general,powerful,highly sensitive and suitable for studying chemical equilibria in solutions. These methods are attractive for pKa determination in very dilute aqueous solutions.
Subsequently,UV-vis spectrophotometry was used to obtain spectral data (Fig. 3a and b) and then commercially available HypSpec software was used that allowed us to perform spectral subtraction followed by spectral analysis to determine the acidity constant. Acidity constant and molar absorbance spectra (Fig. 3c) of dyes were evaluated by the HypSpec program using absorbancepH data. The obtained results show pKa1 = 0.98 and pKa2 = 10.5,which probably corresponded to the deprotonation of -NH2+- and deprotonation of phenolic OH groups respectively. Also the corresponding distribution diagrams (Fig. 3d) were depicted by Hyss2009,as a new version of the older [70].

|
Download:
|
| Fig. 3. (a and b) Absorption spectra of Violet Covasol at different pH values; (c) Molar absorbance spectra and (d) the corresponding distribution diagram. | |
3.2. Effect of pH
The pH plays a unique role in improving the resolution of dyes especially for closely related compounds,because it affects the charge of the dye. When ionizable species exist in solution in the uncharged form,maximum extraction efficiency can be achieved [71]. So the influence of pH on the CPE was evaluated (Fig. 4). It can be seen in Fig. 4 that the optimum pH was 2.0.

|
Download:
|
| Fig. 4. Effect of pH of the test solution on the CPE of Violet Covasol (conditions: Violet Covasol, 3 mg L-1; Triton X-114, 0.13% (w/v)). | |
The effect of pH on the CPE of 3 mg L-1 of Violet Covasol was studied in the range of 1-7 by the addition of hydrochloric acid or sodium hydroxide. Fig. 4 shows that at pH 2,the maximum color intensity can be obtained. In the very low pHs the anionic groups -SO3- change to the uncharged groups -SO3H,therefore the neutral form of Violet Covasol transfers to the surfactant phase and the extraction efficiency increases. In the lower pH and extremely acidic medium,neutral dye molecules will probably become cationic by accepting H+ ions,and therefore recovery will be reduced. At higher pH and especially in alkaline solutions,the anionic form is mostly present and this causes a reduction in the extraction efficiency.
3.3. Effect of Triton X-114 concentrationThe concentration of Triton X-114 not only affected the extraction efficiency but also the volume of surfactant-rich phase. The optimization of surfactant concentration is an important parameter because its amount should be sufficient for the quantitative extraction of the targeted analytes.
The effect of Triton X-114 concentration on the extraction of dye,was studied in the range of 0.02%-0.33% (w/v). The highest signal was obtained at 0.13% (w/v) of surfactant (Fig. 5). At low concentrations of surfactant,extraction is incomplete. While in higher concentrations there were no significant changes in recovery. In fact,a slight decrease occurred in the extraction efficiency,which is due to presence of small quantities of Triton X-114 and analyte in the aqueous solution. This phase can compete with the surfactant-rich phase to draw a small amount of analyte into itself. Also,at a high concentration of surfactant,the viscosity of the enrichment phase was increased and the signal was decreased. Therefore,a 0.13% (w/v) solution of Triton X-114 concentration was selected for further studies.

|
Download:
|
| Fig. 5. Effect of Triton X-114 concentration on the CPE of Violet Covasol (conditions: Violet Covasol, 3 mg L-1; Triton X-114, 0.13% (w/v); pH 2). | |
3.4. Effects of equilibration temperature and time
It was desirable to employ the shortest equilibration time and the lowest possible equilibration temperature,as a compromise between completion of extraction and efficient separation of phases.
Optimal equilibrium temperature and the time needed to reach easy phase separation and efficient preconcentration were investigated. At lower temperature and shorter time the two phases cannot be formed,however,higher temperature and longer time cause the dissociation of surfactant-dye assembly while much higher temperatures may lead to decomposition of the analyte. The effect of equilibrium temperature and time in the range of 30- 60 °C and 2-30 min was studied respectively. The results are shown in Fig. 6. It was found that the extraction efficiency reaches to its maximum at 40 °C (Fig. 6a). Therefore,an equilibration temperature of 40 °C was chosen for the analysis. Maximum extraction efficiency was observed at 7 min. Accordingly,an incubation time of 7 min was chosen to be used in the next experiments in the respective methods (Fig. 6b).

|
Download:
|
| Fig. 6. Effect of equilibration temperature (a) and time (b) on the CPE of Violet Covasol (conditions: Violet Covasol, 3 mg L-1; Triton X-114, 0.13% (w/v); pH 2; temperature of bath, 40 °C; time of bath, 7 min). | |
3.5. Effect of centrifuge time
The centrifugation time hardly affects the micelle formation,so centrifugation can accelerate equilibration and reduce the equilibration and separation time. The effect of centrifugation time on phase separation was studied in the range of 2-30 min. The separation of cloud phase is incomplete,if time is too short or too long. Fig. 7 revealed that 7 min was enough to get a complete phase separation,and no considerable improvement was obtained at 10 min and for longer periods of time,due to cooling of the CPE system or partial back extraction to aqueous phase,a decrease in signal was observed. Therefore,a centrifugation time of 7 min was selected as the optimum.

|
Download:
|
| Fig. 7. Effect of centrifuge time on the CPE of Violet Covasol (conditions: Violet Covasol, 3 mg L-1; Triton X-114, 0.13% (w/v); pH, 2; temperature of bath, 40 °C; time of bath, 7 min; time of centrifuge, 7 min). | |
3.6. Effect of salt concentration
The CPE of the micellar solutions can be controlled by the addition of salt,alcohol,non-ionic surfactant and some organic compounds (salting-out effect). It had been reported [9, 27] that the addition of salt to the solution may influence the extraction process. In order to study the effect of salt addition on the micellar solutions of Violet Covasol,a KCl solution was tested in 0.003- 0.100 mol L-1 range. It was observed that addition of KCl in this interval had no significant effect on the CPE efficiency.
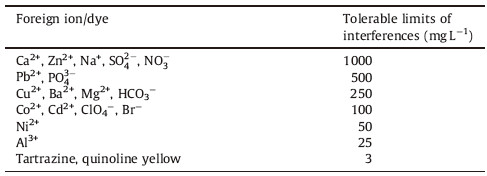
3.7. Effect of foreign speciesDue to the importance of the effects of matrix ions on the preconcentration mechanism [37, 38, 39, 40, 41],selectivity and utility of the method; they were further examined in the presence of various species. An error of ±5% in recovery was considered to be tolerable. The interfering capacity of water matrix constituents such as calcium,magnesium,sodium,sulfate and some other ions and non-ion species on recoveries were also studied.
The influences of some diverse cations,anions and dyes on the determination of Violet Covasol were studied. Various amount of other species were added to a solution containing 3 mg L-1 of Violet Covasol,and the recommended procedure under optimum conditions was applied (Table 1).
|
|
Table 1 Effect of interfering species in the determination of 3mg L-1 Violet Covasol dye in the optimum conditions. |
3.8. Analytical figures of merit
Under optimum conditions,a linear range of 0.166- 6.666 mg L-1 of Violet Covasol was obtained. The equations of the regression line with and without the preconcentration were Y = 0.0441C - 0.0061 and Y = 0.0017C - 0.0022,respectively,where,C is the concentration of Violet Covasol in milligrams per liter.
The detection limit based on five times the standard deviation of the blank (3Sb) for each RGB factor was found to be 0.026 (n = 5). The relative standard deviation (RSD) for 3 mg L-1 of Violet Covasol was 0.71% for G (n = 5). As the R and B values do not vary considerably by changing the concentration of the dyes,the RSD values were calculated only for G value. The enrichment factor,defined as the ratio of the slopes of calibration curves with and without the preconcentration was 25.94 for the proposed method. The preconcentration factor based on the ratio of the initial volume in the centrifuge tube to the final volume of the dissolving solvent is 30.
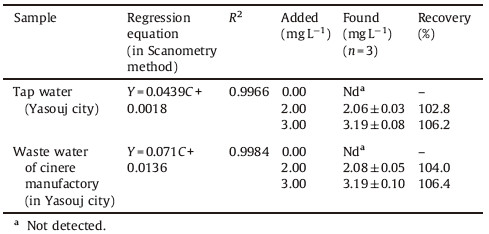
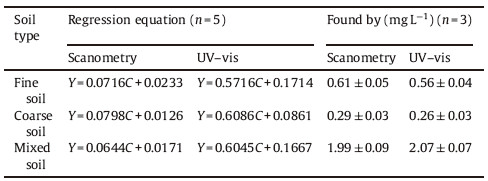
3.9. Application to real samplesThe proposed method was validated for the analysis of Violet Covasol in water samples. The concentration of this dye in the cited real samples was calculated from the standard addition calibration curves. For the other water samples,the developed methodology was validated by recovery studies.Good recoveries (102.8%-106.4%) were achieved for all analyzed samples. The results for this study are presented in Tables 2 and 3.
|
|
Table 2 Characteristics of the standard addition graphs and recovery percentage, for the determination of Violet Covasol dye in water samples. |
|
|
Table 3 Characteristics of the standard addition graphs and the results of the determination of Violet Covasol dye in water sample containing the dye as tracer, passed through column beds including various soils. |
4. Conclusion
Violet Covasol,as a cosmetic dye and with good potential for its employment as a tracer [41] to investigate subsurface water movement was determined in trace amount by CPE-Scanometry as a novel,easy,high speed,sensitive,low cost and safe method. The analytical results showed that the method developed could successfully be adopted for the separation and determination of the dye with high sensitivity and selectivity. The linear range of the proposed method is relatively wide. It can be applied for the preconcentration and determination of Violet Covasol in various water samples.
| [1] | L.G. Chen, Q. Zhao, H.Y. Jin, et al. Determination of xanthohumol in beer based on cloud point extraction coupled with high performance liquid chromatography. Talanta 81 (2010) 692–699 |
| [2] | N. Pourreza, S. Rastegarzadeh, A. Larki. Determination of Allura red in food samples after cloud point extraction using mixed micelles. Food Chem. 126 (2011) 1465–1469 |
| [3] | W.J. Zhang, C.M. Duan, M.L. Wang. Analysis of seven sulphonamides in milk by cloud point extraction and high performance liquid chromatography. Food Chem. 126 (2011) 779–785 |
| [4] | A.R. Fontana, M.F. Silva, L.D. Martínez, R.G. Wuilloud, J.C. Altamirano. Determination of polybrominated diphenyl ethers in water and soil samples by cloud point extraction-ultrasound-assisted back-extraction-gas chromatography-mass spectrometry. J. Chromatogr. A 1216 (2009) 4339–4346 |
| [5] | A. Shokrollahi, M. Ghaedi, S. Gharaghani, M.R. Mohammad, M. Soylak. Cloud point extraction for the determination of copper in environmental samples by flame atomic absorption spectrometry. Quím. Nova 31 (2008) 70–74 |
| [6] | A. Shokrollahi, S. Eslami, A.H. Kianfar. Flame atomic absorption determination of Ni2+, Cu2+ and Co2+ ions in some water and food samples after cloud point extraction using a Thio Schiff-base as a new complexing agent. Chem. Sci. Trans. 1 (2012) 217–225 |
| [7] | M. Ghaedi, A. Shokrollahi, R. Mehrnoosh, O. Hossaini, M. Soylak. Combination of cloud point extraction and flame atomic absorption spectrometry for preconcentration and determination of trace iron in environmental and biological samples. Cent. Eur. J. Chem. 6 (2008) 488–496 |
| [8] | M. Sun, Q.H. Wu. Determination of trace bismuth in human serum by cloud point extraction coupled flow injection inductively coupled plasma optical emission spectrometry. J. Hazard. Mater. 192 (2011) 935–939 |
| [9] | R. Carabias-Martínez, E. Rodríguez-Gonzalo, B. Moreno-Cordero, et al. Surfactant cloud point extraction and preconcentration of organic compounds prior to chromatography and capillary electrophoresis. J. Chromatogr. A 902 (2000) 251–265 |
| [10] | X.S. Zhu, X.H. Zhu, Y.Y. Hu, S.H. Yu, B.S. Wang. Cloud point extraction of serum albumin and its spectrophotometric determination in serum samples. Anal. Lett. 39 (2006) 1853–1864 |
| [11] | M.S. Arain, T.G. Kazi, H.I. Afriidi, et al. Preconcentration and determination of manganese in biological samples by dual-cloud point extraction and coupled with flame atomic absorption spectrometry. J. Anal. At. Spectrom. 29 (2014) 2349–2355 |
| [12] | W. Liu, W.J. Zhao, J.B. Chen, M.M. Yang. A cloud point extraction approach using Triton X-100 for the separation and preconcentration of Sudan dyes in chilli powder. Anal. Chim. Acta 605 (2007) 41–45 |
| [13] | M.S. Alam. Kabir-ud-Din, Investigation of the role of electrolytes and non-electrolytes on the cloud point and dye solubilization in antidepressant drug imipramine hydrochloride solutions. Colloids Surf. B Biointerfaces 65 (2008) 74–79 |
| [14] | M.K. Purkait, S. Banerjee, S. Mewara, S. DasGupta, S. De. Cloud point extraction of toxic eosin dye using Triton X-100 as nonionic surfactant. Water Res. 39 (2005) 3885–3890 |
| [15] | A. Shokrollahi, A. Abbaspour, Z. Azami Ardekani, Z. Malekhosseinia, A. Alizadeh. CPE-Paptode as a new technique for determination of dyes:application for determination of acid red 151. Anal. Methods 4 (2012) 502–507 |
| [16] | A.S. Lopes, J.S. Garcia, R.R. Catharino, et al. Cloud point extraction applied to casein proteins of cow milk and their identification by mass spectrometry. Anal. Chim. Acta 590 (2007) 166–172 |
| [17] | K. Madej. Microwave-assisted and cloud-point extraction in determination of drugs and other bioactive compounds. TrAC Trends Anal. Chem. 28 (2009) 436–446 |
| [18] | M.D. Rukhadze, S.K. Tsagareli, N.S. Sidamonidze, V.R. Meyer. Cloud-point extraction for the determination of the free fraction of antiepileptic drugs in blood plasma and saliva. Anal. Biochem. 287 (2000) 279–283 |
| [19] | A.N. Tang, D.Q. Jiang, X.P. Yan. Cloud point extraction preconcentration for capillary electrophoresis of metal ions. Anal. Chim. Acta 507 (2004) 199–204 |
| [20] | M.O. Luconi, R.A. Olsina, L.P. Fernández, M.F. Silva. Determination of lead in human saliva by combined cloud point extraction-capillary zone electrophoresis with indirect UV detection. J. Hazard. Mater. 128 (2006) 240–246 |
| [21] | K. Materna, I. Milosz, I. Miesiac, G. Cote, J. Szymanowski. Removal of phenols from aqueous streams by the cloud point extraction technique with oxyethylated methyl dodecanoates as surfactants. Environ. Sci. Technol. 35 (2001) 2341–2346 |
| [22] | G. Komáromy-Hiller, R. von Wandruszka. Decontamination of oil-polluted soil by cloud point extraction. Talanta 42 (1995) 83–88 |
| [23] | S.S. Arain, T.G. Kazi, J.B. Arain, et al. Preconcentration of toxic elements in artificial saliva extract of different smokeless tobacco products by dual-cloud point extraction. Microchem. J. 112 (2014) 42–49 |
| [24] | F.H. Quina, W.L. Hinze. Surfactant-mediated cloud point extractions:an environmentally benign alternative separation approach. Ind. Eng. Chem. Res. 38 (1999) 4150–4168 |
| [25] | R. Carabias-Martínez, E. Rodríguez-Gonzalo, J. Domínguez-Alvarez, J. Hernández-Méndez. Cloud point extraction as a preconcentration step prior to capillary electrophoresis. Anal. Chem. 71 (1999) 2468–2474 |
| [26] | C.B. Ojeda, F.S. Rojas. Separation and preconcentration by a cloud point extraction procedure for determination of metals:an overview. Anal. Bioanal. Chem. 394 (2009) 759–782 |
| [27] | L. Wang, Y.Q. Cai, B. He, et al. Determination of estrogens in water by HPLC-UV using cloud point extraction. Talanta 70 (2006) 47–51 |
| [28] | T.I. Sikalos, E.K. Paleologos. Cloud point extraction coupled with microwave or ultrasonic assisted back extraction as a preconcentration step prior to gas chromatography. Anal. Chem. 77 (2005) 2544–2549 |
| [29] | S. Cerutti, M.F. Silva, J.A. Gásquez, R.A. Olsina, L.D. Martínez. Cloud point preconcentration prior to capillary zone electrophoresis:simultaneous determination of platinum and palladium at trace levels. Electrophoresis 26 (2005) 3500–3506 |
| [30] | B.J. Yao, L. Yang, Q. Hu, A. Shigendo. Cloud point extraction of polycyclic aromatic hydrocarbons in aqueous solution with silicone surfactants. Chin. J. Chem. Eng. 15 (2007) 468–473 |
| [31] | X.D. Wen, P. Wu, L. Chen, X.D. Hou. Determination of cadmium in rice and water by tungsten coil electrothermal vaporization-atomic fluorescence spectrometry and tungsten coil electrothermal atomic absorption spectrometry after cloud point extraction. Anal. Chim. Acta 650 (2009) 33–38 |
| [32] | Y.J. Li, B. Hu. Sequential cloud point extraction for the speciation of mercury in seafood by inductively coupled plasma optical emission spectrometry. Spectrochim. Acta Part B At. Spectrosc. 62 (2007) 1153–1160 |
| [33] | A. Shokrollahi, M. Ghaedi, O. Hossaini, N. Khanjari, M. Soylak. Cloud point extraction and flame atomic absorption spectrometry combination for copper (Ⅱ) ion in environmental and biological samples. J. Hazard. Mater. 160 (2008) 435–440 |
| [34] | X.M. Jiang, S.P. Wen, G.Q. Xiang. Cloud point extraction combined with electrothermal atomic absorption spectrometry for the speciation of antimony (Ⅲ) and antimony (V) in food packaging materials. J. Hazard. Mater. 175 (2010) 146–150 |
| [35] | R.A. Gil, J.A. Salonia, J.A. Gásquez, et al. Flow injection system for the on-line preconcentration of Pb by cloud point extraction coupled to USN-ICP OES. Microchem. J. 95 (2010) 306–310 |
| [36] | A. Shokrollahi, T. Roozestan. CPE-Scanometry as a new technique for the determination of dyes:application for the determination of fast green FCF dye and comparison with spectrophotometric results. Anal. Methods 5 (2013) 4824–4831 |
| [37] | A. Abbaspour, A. Khajehzadeha, A. Ghaffarinejad. A simple and cost-effective method, as an appropriate alternative for visible spectrophotometry:development of a dopamine biosensor. Analyst 134 (2009) 1692–1698 |
| [38] | A. Abbaspour, H. Valizadeha, A. Khajehzadeh. A simple, fast and cost effective method for detection and determination of dopamine in bovine serum. Anal. Methods 3 (2011) 1405–1409 |
| [39] | A. Abbaspour, E. TalebanpourBayat, E. Mirahmadi. A reliable and budget-friendly, solution-based analysis of multiple analytes of boiler water based on reflection scanometry. Anal. Methods 4 (2012) 1968–1975 |
| [40] | L.H. Ahlström, C.S. Eskilsson, E. Bjö rklund. Determination of banned azo dyes in 310 consumer goods. TrAC Trends Anal. Chem. 24 (2005) 49–56 |
| [41] | M. Sedghi-Asl, Optimization of Seepage Control Measures under Coastal Dikes Using Numerical and Laboratory Models, University of Tehran, Karaj, 2005. |
| [42] | J.A. Wenninger, R.C. Canterbery, G.N. McEwen, International Cosmetic Ingredient Dictionary and Handbook, 8th ed., Cosmetic Toiletry & Fragrance Association, Washington, 2000. |
| [43] | <http://chem.sis.nlm.nih.gov/chemidplus/rn/4430-18-6>. |
| [44] | Hazleton Laboratories, Inc., Petition to FDA dated July 1 to list Ext. D & C Violet No.2 as suitable and safe for use in externally applied cosmetics, Unpublished data contained in CTFA's FDA Master le, 1968. |
| [45] | American Cyanamid Company, Report on Ext. D & C Violet No. 2-Three-month repeated applications to intact rabbit skin. Report 65-48 dated May 11. Unpublished data contained in the Cosmetic, Toiletry, and Fragrance Association's (CTFA's) FDA Master le, 1965. |
| [46] | American Cyanamid Company, Report on Ext. D & C Violet No. 2-Three-week repeated applications to abraded guinea pig skin. Report 66-50 dated July 5. Unpublished data contained in CTFA's FDA Master le, 1966. |
| [47] | American Cyanamid Company, Report on Ext. D & C Violet No. 2-Lifetime skin painting on female mice. Report 67-65 dated Apr 18. Unpublished data contained in CTFA's FDA Master le, 1967. |
| [48] | J.P. Brown, R.J. Brown. Mutagenesis by 9, 10-anthraquinone derivatives and related compounds in Salmonella typhimurium. Mutat. Res. 40 (1976) 203–224 |
| [49] | <http://www.chemexper.com/search/cas/4430186.html>. |
| [50] | C.C. Wang, A.N. Masi, L. Fernández. On-line micellar-enhanced spectrofluorimetric determination of rhodamine dye in cosmetics. Talanta 75 (2008) 135–140 |
| [51] | L.F. Capitán-Vallvey, N.N. Iglesias, I. de Orbe Payá, R.A. Castañeda. Simultaneous determination of quinoline yellow and brilliant blue FCF in cosmetics by solidphase spectrophotometry. Talanta 43 (1996) 1457–1463 |
| [52] | L.F. Capitán-Vallvey, M.C. Valencia, E.A. Nicolás. Flow injection analysis with online solid phase extraction for spectrophotometric determination of ponceau 4R and its subsidiary unsulfonated dye in sweets and cosmetic products. Microchim. Acta 138 (2002) 69–76 |
| [53] | J.J.B. Nevado, J.R. Flores, M.J.V. Llerena. Simultaneous determination of tartrazine and sunset yellow by derivative spectrophotometry and ratio spectra derivative. Talanta 40 (1993) 1391–1396 |
| [54] | T. Ohno, E. Mikami, H. Matsumoto. Identification of oil-soluble coal tar dyes in cosmetics using reversed-phase TLC/scanning densitometry. J. Health Sci. 49 (2003) 401–404 |
| [55] | A.M. Sjöberg, C. Olkkonen. Determination of synthetic organic colours in lipsticks by thin-layer and high-performance liquid chromatography. J. Chromatogr. A 318 (1985) 149–154 |
| [56] | J.W. Wegener, J.C. Klamer, H. Govers, U.A.Th. Brinkman. Determination of organic colorants in cosmetic products by high-performance liquid chromatography. Chromatographia 24 (1987) 865–875 |
| [57] | H.W. Sun, F.C. Wang, L.F. Ai. Determination of banned 10 azo-dyes in hot chili products by gel permeation chromatography-liquid chromatography-electrospray ionization-tandem mass spectrometry. J. Chromatogr. A 1164 (2007) 120–128 |
| [58] | L. Katata, V. Nagaraju, A.M. Crouch. Determination of ethylenediaminetetraacetic acid, ethylenediaminedisuccinic acidand iminodisuccinic acid incosmetic products by capillary electrophoresis and high performance liquid chromatography. Anal. Chim. Acta 579 (2006) 177–184 |
| [59] | R. Noguerol-Cal, J.M. López-Vilariño, G. Fernández Martínez, L. Barral-Losada, M.V. González-Rodríguez. High-performance liquid chromatographyanalysis of tendyes for control of safety of commercial articles. J. Chromatogr. A 1179 (2008) 152–160 |
| [60] | M. Chen, D. Moir, F.M. Benoit, C. Kubwabo. Purification and identification of several sulphonated azo dyes using reversed-phase preparative high-performance liquid chromatography. J. Chromatogr. A 825 (1998) 37–44 |
| [61] | S.C. Rastogi, V.J. Barwick, S.V. Carter. Identification of organic colourants in cosmetics by HPLC-diode array detection. Chromatographia 45 (1997) 215–228 |
| [62] | L. Gagliardi, G. Cavazzutti, A. Amato, A. Basili, D. Tonelli. Identification of cosmetic dyes by ion-pair reversed-phase high-performance liquid chromatography. J. Chromatogr. A 394 (1987) 345–352 |
| [63] | K.S. Wu, A.B. Wu, M.C. Huang, C.Y. Chen. Identification of illegal coal tar dyes constituents in mucous cosmetics by HPLC method. J. Food Drug Anal. 7 (1999) 95–102 |
| [64] | J.W.M. Wegener, H.J.M. Grünbauer, R.J. Fordham, W. Karcher. A combined HPLCVIS spectrophotometric method for the identification of cosmetic dyes. J. Liquid Chromatogr. 7 (1984) 809–821 |
| [65] | L. Gagliardi, D. De Orsi, G. Cavazzutti, G. Multari, D. Tonelli. HPLC determination of rhodamine B (C.I. 45170) in cosmetic products. Chromatographia 43 (1996) 76–78 |
| [66] | X.Y. Sun, Y. Li, L. Liu, et al. Simultaneous determination of 9 water-soluble colorants in cosmetics by high performance liquid chromatography. Chin. J. Chromatogr. 27 (2009) 852–855 |
| [67] | R.D. Voyksner, R. Straub, J.T. Keever, H.S. Freeman, W.N. Hsu. Determination of aromatic amines originating from azo dyes by chemical reduction combined with liquid chromatography/mass spectrometry. Environ. Sci. Technol. 27 (1993) 1665–1672 |
| [68] | P. Gans, A. Sabatini, A. Vacca. Investigation of equilibria in solution. determination of equilibrium constants with the HYPERQUAD suite of programs. Talanta 43 (1996) 1739–1753 |
| [69] | P. Gans, A. Sabatini, A. Vacca. Determination of equilibrium constants from spectrophotometric data obtained from solutions of known pH:the program pHab. Ann. Chim. 89 (1999) 45–49 |
| [70] | L. Alderighi, P. Gans, A. Ienco, et al. Hyperquad simulation and speciation (HySS):a utility program for the investigation of equilibria involving soluble and partially soluble species. Coord. Chem. Rev. 184 (1999) 311–318 |
| [71] | R. Rial-Otero, R.M. González-Rodríguez, B. Cancho-Grande, J. SimalGándara. Parameters affecting extraction of selected fungicides from vineyard soils. J. Agric. Food Chem. 52 (2004) 7227–7234 |