 2016, Vol.27


b Hefei National Laboratory for Physical Sciences at the Microscale, University of Science and Technology of China, Hefei 230026, China;
c School of Physics and Optoelectronic Engineering, Xidian University, Xi'an 710071, China
The salt effects on the interfacial properties of the polar liquids are of vital importance for many biological, environmental and industrial processes [1, 2, 3]. In the past decade, tremendous experimental and theoretical efforts have suggested the possible enrichment of the larger and more polarizable anions at aqueous surfaces, therefore challenging the traditional belief of inorganic ions being depleted from the air/water interface [2, 3, 4, 5, 6]. More recently, there has been a growing interest to extend these efforts to investigate the role of the simple inorganic ions at the air/liquid interfaces of polar nonaqueous solvents [3, 7, 8, 9, 10, 11, 12]. Methanol is one of the simplest and widely used polar organic solvents. It contains both a hydrophobic methyl group and a hydrophilic hydroxyl group, exhibiting the surfactant-like characteristics and weaker hydrogen bonding strength compared with water. Naturally it is interesting to examine whether the salt ions influence the molecular structures at the air/methanol interface in a different way compared with the air/water interface. In this context, several molecular dynamics (MD) simulations have been carried out and predicted that the segregation of the large polarizable iodide anions at the air/liquid methanol interface is much less than that at the air/aqueous interface [7, 10, 11]. In a relevant experimental work, the amorphous solid methanol surface exposed to the CsI vapor was studied by the metastable impact electron spectroscopy [8]. But other than that, the experimental investigations of the ion effects on air/liquid methanol interface are still scarce.
Interfacial molecular orientations reflect the anisotropic nature of the intermolecular interactions in the surface region. It is closely related to other important interfacial properties such as the surface tension, viscosity and surface reactivity [13, 14]. Here, we investigated the influence of the sodium iodide on the molecular orientations at the air/liquid methanol interface via sum frequency generation vibrational spectroscopy (SFG-VS). As a surface-selective optical probe [15], SFG-VS has already been shown to be able to measure the molecular orientations at various liquid surfaces, including the air/pure methanol interface [13, 16, 17, 18, 19, 20, 21, 22, 23]. In the current work, we aim to use SFG-VS to obtain the direct experimental evidences for the salt effects on the surface structures of the liquid methanol by observing the change of the orientations of the interfacial methanol molecules upon the addition of salt ions. It is also shown in this work that although only slightly different from those of the pure liquid methanol, accurately measuring the refractive indices and Raman depolarization ratios of the salty methanol solution is the key for the precise determination of the interfacial tilting angels in the SFG-VS studies. This latter observation provides important protocols for future studies of surface orientations of other aqueous or nonaqueous electrolyte solutions.
2. ExperimentalA picosecond SFG-VS spectrometer (EKSPLA) was used in the current study. The detailed description of this setup can be found elsewhere [20, 21, 23]. Briefly, the spectrometer is based on a modelocked Nd:YAG laser operated at a 10-Hz repetition rate with a pulse width of 23 ps. A tunable mid-infrared beam (with the photon energy of ωIR) and a visible beam with its wavelength fixed at 532 nm (ωVIS) were arranged in a co-propagating configuration. The incident angles for the visible and IR beams were 458 and 588 against the surface normal, respectively. The SFG signals (ωSFG =ωIR+ωVIS) were collected in a reflective geometry. Each spectrum was normalized by the SFG signals from a Z-cut α-quartz. All the measurements were carried out at the controlled room temperature.
The refractive indices of the neat methanol and the 3 mol/L NaI-methanol solution were measured using an OPTILAB Rex refractometer (Wyatt Technology). The uncertainty in the refractive index measurements was within -0.0001 units.
To measure the Raman depolarization ratios, a confocal microscope (Witec) was employed. A cw laser (532 nm, 50 mW) was employed to irradiate the liquids. The emitted light was diffracted by an optical grating (600 g/mm) and recorded by an EMCCD. Using the polarized optics, we obtained the polarized and depolarized Raman spectra, in which the polarization of the Raman signal is parallel (IP) or perpendicular (IV) to that of laser. The intensity ratio IV/IP equals the depolarization ratio (ρ).
The methanol (+99.8%) was purchased from Alfa Aesar and used as received. The sodium iodide (NaI, 99.9%) was purchased from Alfa Aesar and baked at 210 ℃ for at least 10 h in a muffle furnace. The purpose of baking NaI was to remove the trace amount of the organic contaminations in the salts.
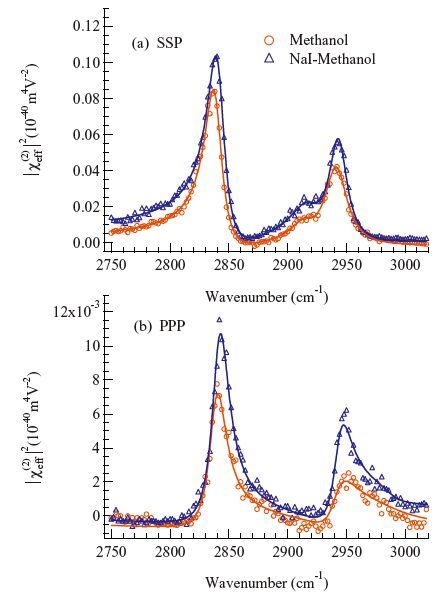
3. Results and discussionUp to date, there have been no previous SFG-VS reports on the air/salty methanol interface. In the current work, the molecular orientations at the air/salty methanol interface were obtained by comparing the SFG-VS intensities recorded at different polarization combinations. Fig. 1 shows the SFG-VS spectra at the air/liquid methanol interface taken with the SSP and PPP polarizations before and after adding the NaI salts. Here the indices of SSP and PPP are defined by the polarizations in the order of the SFG, visible and IR beams. The SSP and PPP spectra for the same interface were globally fitted by the Lorentzian lineshapes [13, 15, 22]:


|
Download:
|
| Fig. 1.(a) SSP and (b) PPP spectra of the air/methanol interface before and after adding 3 mol/L NaI salts. Solid lines represent the global fitting results with Lorentzian lineshapes. | |
The SFG-VS peaks after the addition of 3 mol/L NaI showed a ~2 cm-1 blue shift compared with those from the pure methanol. But the most obvious change after adding NaI was the increase of the spectral intensity as shown in Fig. 1. Several important factors may potentially contribute to the increase of the SFG-VS intensity [13, 15, 22], including the alternation of the tilting angles and the orientational distributions, the variation of the surface number density per unit area (Ns), and the change of the microscopic Infrared and Raman polarizabilities of the interfacial molecules. In this short letter, we will mainly analyze the salt effects on the methanol orientation at the air/liquid interface. The latter factors such as the surface density and microscopic molecular polarizability are more complicated and will be discussed in detail in a followup full article.
Before the investigation of the effects of NaI salts on the interfacial methanol orientations, we first reexamined the molecular tilting angles at the pure methanol interface without the addition of NaI salts. The interfacial molecular orientations are possible to be determined in an SFG-VS experiment because the measured χeff(2) are related to 〈Rii'Rjj'Rkk'〉, the ensemble average over all of the possible molecular orientations in the Euler transformation from the molecular frame to the laboratory frame, by [13, 15, 22]:


In this work, we used the χppp(2)=χssp(2) ratio to evaluate the methanol orientation at the air/liquid interface. To record a well resolved CH3 s.s. peak with a reasonable spectral intensity in the PPP polarization, the visible and IR incident angles were chosen to be 458 and 588, respectively (see details in Figs. S3 and S4 in Supporting information) [21, 22]. A χppp(2)=χssp(2) value of -0.346 with the good signal-to-noise ratio was therefore obtained for the CH3 s.s. mode on the pure methanol surface. By comparing this experimental χppp(2)=χssp(2) ratio with the theoretically simulated ratios as a function of θ (the red curve in Fig. 2), we obtained θ= 30° × 5° for the methyl group of the interfacial methanol molecules before adding NaI. Here a δ-function of the tilting angles was assumed because the recent PNAmeasurements have suggested a strong polar ordering for the air/methanol interface. The error bars were obtained by the uncertainty propagation of the spectral fitting results. The resulting θ= 30° × 5° is in fact in good agreement with Wolfrum et al.’s estimation θ < 40° [1] as well as Wang and coworkers’ initial PNA results [18]. In additions, the χppp(2)=χssp(2) value obtained at the visible incident angle of 378 byWang and coworkers would yield a similar θ value [21]. The average tilting angle of θ= 30° × 5° we obtained in this work is also consistent with an early MD simulation predicting θ~23° for the same air/pure methanol interface [26]. The above agreements between the majorities of the SFG-VS studies further imply the robustness of the SFG-VS in surface orientational analysis.

|
Download:
|
| Fig. 2.The simulated χssp(2)=χppp(2) ratio vs. tilt angle (θ) for the s.s. mode with the C3v symmetry. The red curve is for the air/pure methanol interface and the blue curve is for the air/3 NaI–methanol interface. The following parameters were used in the simulation: ωIR = 2840 cm-1, βIR = 58°; ωvis= 532nm, βvis= 45°. | |
Upon the addition of 3 mol/L NaI salts into the bulk liquid, the SSP and PPP spectral intensities simultaneously increased (Fig. 1), yielding the almost same χppp(2)=χssp(2) ratio as for the pure methanol. But this does not necessarily mean that the 3 mol/L NaI has a negligible effect on the methanol orientations at the air/liquid interface. We have recently shown that the refractive indices of the liquid phase (n2) increase with the salt concentration. Even a slight change of n2 could cause noticeable responses in the Fresnel factors in the SFG-VS studies [27]. It is therefore necessary to take the influence of n2 into account during the orientational analysis. Our refractive index measurements showed that n2 for the pure methanol was 1.326 at 658 nm. After adding 3 mol/L NaI, n2 became 1.398 with a 5.2% enhancement. This small change of the n2 value can in fact result in a 12%~13% drop for χssp(2) when θ = 30-40°, while χppp(2) keeps almost unchanged (the green curves in Fig. 3). Consequently the simulated χppp(2)=χssp(2) ratio as a function of θ also changes as shown by the green curve in Fig. 2. Here we neglect the n2 dispersions in the visible region by assuming the similar enhancement of n2 at the exact SFG (462 nm) and visible (532 nm) wavelengths as at the 658 nm used in our refractometer. The n2 for the IR wavelength is not important in this context because the χzxx and χxzx terms in the PPP spectra for CH3 s.s. mode can almost be canceled out with each other due to the similar amplitudes and opposite signs [22]. As a result, the major PPP contributions are from χxxz and χzzz. These two terms and the χxxz term in SSP all have the same LZZ(IR) factors for the IR beam. When we calculated the χppp(2)=χssp(2) ratio, the LZZ(IR) factors in the numerator and denominator are canceled out, leaving the χppp(2)=χssp(2) ratio independent of the n2(IR) value.

|
Download:
|
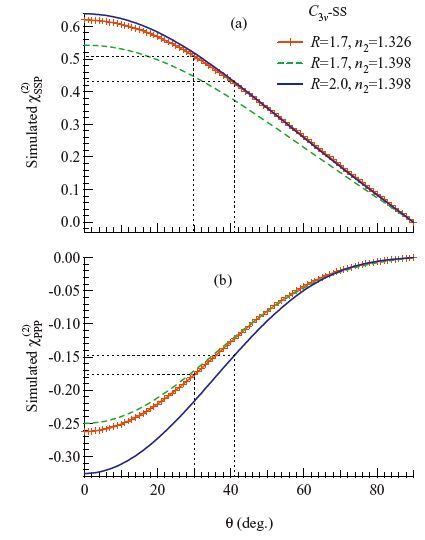
| Fig. 3.Simulated (a) χssp(2) and (b) χppp(2) vs. θ with different n2 and R values. The red curves are for the air/pure methanol interface and the blue curves are for the air/ 3 mol/L NaI–methanol interface. The following parameters were used in the simulation: ωIR = 2840 cm-1, βIR = 58°; ωvis = 532nm, βvis = 45°. | |
The n2 value is not the only parameter that we have to consider. For the methyl group with a typical C3v symmetry, there are three nonzero molecular hyperpolarizability tensors βaac(2)= βbbc(2) and βccc(2) for the s.s. mode [13, 22]. To simulate the relative SSP and PPP intensities at a certain θ as shown in Figs.2 and 3, the knowledge of the hyperpolarization ratio R =βaac(2)=βccc(2) = βbbx(2)=βccc(2) is required. Different R values will lead to different results in the SFG orientational analysis, sometimes even the different polarization selection rules [13, 22]. Consequently it is crucial to obtain the correct R values for the quantitative interpretation of the SFG-VS data.
The R value can be calculated from the Raman depolarization ratios (ρ) using the known procedures in literature [22]. Our Raman spectroscopic measurements found that ρ = 0.014, R = 1.7 for the pure methanol and ρ = 0.024, R = 2.0 for the 3 mol/L NaI-methanol solution, showing that ρ and R values also change when adding NaI salts into methanol. This small alternation in the R values at different salt concentrations, together with the change in n2, directly affects the simulated χssp(2) and χppp(2) curves in Fig. 3. It can be seen that for the air/3 mol/L NaI-methanol interface with R = 2.0 and n2 = 1.398, the χssp(2) curve (blue line in Fig. 3a) is very close to that of the air/pure methanol interface with R = 1.7 and n2 = 1.326 (red line in Fig. 3a), but the χppp(2) curves obviously shifts to the more negative side (Fig. 3b). These curves are very different from those by only considering the change of n2 (green lines in Fig. 3), clearly indicating the equal importance of the R values in the SFG-VS data analysis compared with n2. Accordingly the simulated χppp(2)=χssp(2) ratios for the air/NaI-methanol interface also shifts away (the blue line in Fig. 2) from that those for the air/ pure methanol interface.
After considering the salts effects on both n2 and R, a new tilting angle of θ = 418 × 38 can finally be obtained for the methyl group at the air/NaI-methanol interface based on the corrected χppp(2)=χssp(2) ratio vs. θ curve (the blue line in Fig. 2). Compared with θ = 30° × 5° at the air/pure methanol interface, we can conclude that the addition of 3 mol/L NaI salt caused the interfacial methanol to tilt further away from the surface normal. This observation is in coincidence with a recent SFG-VS experiment reporting the reorientation of the free OH group at the air/aqueous interface from θ = 36.6° × 0.5° to θ = 44.1° × 0.6° when adding 0.94 mol/L sodium fluoride (NaF) salts [23]. The small and less polarizable fluoride anions are believed to be depleted from the air/ aqueous interface [6], but can still reorientate the topmost-layer water molecules. Similarly in this work the NaI salts showed the ability to affect the surface orientation of methanol, although iodide anions are predicted to only slightly segregate and sodium cations are supposed be depleted at the air/liquid methanol interface [11]. Both the 0.94 mol/L NaF in water and 3 mol/L NaI in methanol are close to the saturated concentrations. Therefore the NaI salts used here are pretty concentrated. At the concentration of 3 mol/L, each Na+-I-pair are only surrounded by about 8 methanol molecules on average. Therefore it is reasonable to speculate that the hydrogen bonds and other intermolecular interactions in methanol are strongly disturbed by such highly concentrated NaI salts, although the exact mechanism of the surface reorientation observed here is still due to further investigations.
When θ changes from 30° × 5° at the air/pure methanol interface (R = 1.7 and n2 = 1.326) to 41° × 3° at the air/NaI-methanol interface (R = 2.0 and n2 = 1.398), the amplitudes of both the simulated χssp(2) and χppp(2) are supposed to decrease (Fig. 3) with the assumption of the constant Ns. Therefore the reorientation of interfacial methanol does not explain the observed enhancement of the SSP and PPP intensities when the NaI salts were added into the liquid methanol as shown in Fig. 1. The underlying reasons for the increasing spectral intensities have to be the changing surface density Ns or the thickness of the interfacial layers that contributes to the SFG-VS signals. In additions, the observation of the changes of the O-H stretching modes upon the addition of NaI salts can provide more insights into the salt effects on the interfacial molecular structures, although there is no obvious "free" OH at the air/methanol surface. The details of the above discussions are beyond the scale of this short letter and will be addressed in a follow-up article.
4. ConclusionIn summary, we presented the first SFG-VS study on the air/NaI-methanol interface. The polarization dependence of the SFG-VS output from the CH3 s.s. peak was used to measure the averaged tilting angle formethyl groups of the interfacialmethanolmolecules. It was found that the salt effects on the bulk refractive index n2 and hyperpolarization ratio R shall not be neglected during the SFG-VS orientational analysis. After adding 3 mol/L NaI into the liquid methanol, n2 increases from 1.326 for the pure methanol to 1.398 while R changes from 1.7 to 2.0, the tilting angle of the interfacialmethyl group changes from30° × 5° of the puremethanol interface to 41° × 3° for the salty methanol interface. In addition, the reorientation of surface methanol molecules upon the addition of salts does not agree with the increase of the SFG-VS intensities. Therefore other thanthe interfacialmolecular orientations, thenumber of orderly arranged methanol molecules in the vicinity of the air/liquid interface also changes with the salt concentrations. These observations provide direct spectroscopic evidences to the salt effects on the surface structures of the air/polar organic solvent interfaces, although no strong ion segregations were predicted at such interfaces. Future experiments exploring the surface orientional angles of methanol and other organic solvents at a series of salt concentrationswillbehelpful to revealmore details of the salt effects on the interfacial properties of the organic liquids. Furthermore, the data analysis procedure presented here demonstrates that in order to quantitatively understand the SFGVS data, it is crucial to preciselymeasure the bulk refractive index and Raman depolarization ratio even for the same molecular species under different chemical environments. With these parameters accurately determined and the experimental configuration carefully selected, we have shown in this report that the SFG-VS can yield reliable orientational analysis results, assuring the unique capability of this technology in elucidating the detailed molecular structures at liquid interfaces.
AcknowledgmentsThis work was financially supported by the National Natural Science Foundation of China (Nos. 21227802, 21303216 and 21473217).
Appendix A. Supplementary dataSupplementary data associated with this article can be found, in the online version, at http://dx.doi.org/10.1016/j.cclet.2016.01.004.
| [1] | E.M. Knipping, M.J. Lakin, K.L. Foster, et al., Experiments and simulations of ionenhanced interfacial chemistry on aqueous NaCl aerosols, Science 288(2000) 301-306. |
| [2] | B.C. Garrett, Ions at the air/water interface, Science 303(2004) 1146-1147. |
| [3] | P. Jungwirth, B. Winter, Ions at aqueous interfaces:from water surface to hydrated proteins, Ann. Rev. Phys. Chem. 59(2008) 343-366. |
| [4] | T.M. Chang, L.X. Dang, Recent advances in molecular simulations of ion solvation at liquid interfaces, Chem. Rev. 106(2006) 1305-1322. |
| [5] | S. Gopalakrishnan, D.F. Liu, H.C. Allen, M. Kuo, M.J. Shultz, Vibrational spectroscopic studies of aqueous interfaces:salts, acids, bases, and nanodrops, Chem. Rev. 106(2006) 1155-1175. |
| [6] | P. Jungwirth, D.J. Tobias, Specific ion effects at the air/water interface, Chem. Rev. 106(2006) 1259-1281. |
| [7] | L.X. Dang, Ions at the liquid/vapor interface of methanol, J. Phys. Chem. A 108(2004) 9014-9017. |
| [8] | O. Hö fft, A. Borodin, U. Kahnert, et al., Surface segregation of dissolved salt ions, J. Phys. Chem. B 110(2006) 11971-11976. |
| [9] | G. Andersson, H. Morgner, L. Cwiklik, P. Jungwirth, Anions of alkali halide salts at surfaces of formamide solutions:concentration depth profiles and surface topography, J. Phys. Chem. C 111(2007) 4379-4387. |
| [10] | L. Cwiklik, G. Andersson, L.X. Dang, P. Jungwirth, Segregation of inorganic ions at surfaces of polar nonaqueous liquids, ChemPhysChem 8(2007) 1457-1463. |
| [11] | X.Q. Sun, C.D. Wick, L.X. Dang, Computational study of ion distributions at the air/liquid methanol interface, J. Phys. Chem. A 115(2011) 5767-5773. |
| [12] | Z.S. Huang, W. Hua, D. Verreault, H.C. Allen, Salty glycerol versus salty water surface organization:bromide and iodide surface propensities, J. Phys. Chem. A 117(2013) 6346-6353. |
| [13] | X. Zhuang, P.B. Miranda, D. Kim, Y.R. Shen, Mapping molecular orientation and conformation at interfaces by surface nonlinear optics, Phys. Rev. B:Condens. Matter 59(1999) 12632-12640. |
| [14] | Y. Rao, S.Y. Hong, N.J. Turro, K.B. Eisenthal, Molecular orientational distribution at interfaces using second harmonic generation, J. Phys. Chem. C 115(2011) 11678-11683. |
| [15] | Y.R. Shen, Surface spectroscopy by nonlinear optics, in:T.W. Hansch, M. Inguscio (Eds.), Frontiers in Laser Spectroscopy, Elsevier Science Publ. B. V., Amsterdam, 1994, pp. 139-165. |
| [16] | K. Wolfrum, H. Graener, A. Laubereau, Sum-frequency vibrational spectroscopy at the liquid-air interface of methnaol. Water solutions, Chem. Phys. Lett. 213(1993) 41-46. |
| [17] | C.D. Stanners, Q. Du, R.P. Chin, et al., Polar ordering at the liquid-vapor interface of n-alcohols (C1-C8), Chem. Phys. Lett. 232(1995) 407-413. |
| [18] | R. Lü, W. Gan, H.F. Wang, Novel method for accurate determination of the orientational angle of interfacial chemical groups, Chin. Sci. Bull. 48(2003) 2183-2187. |
| [19] | R. Lü, W. Gan, H.F. Wang, Letter to CSB, Chin. Sci. Bull. 49(2004) 899. |
| [20] | H. Chen, W. Gan, R. Lu, Y. Guo, H.F. Wang, Determination of structure and energetics for gibbs surface adsorption layers of binary liquid mixture 2. Methanol+water, J. Phys. Chem. B 109(2005) 8064-8075. |
| [21] | W. Gan, B.H. Wu, H. Chen, Y. Guo, H.F. Wang, Accuracy and sensitivity of determining molecular orientation at interfaces using sum frequency generation vibrational spectroscopy, Chem. Phys. Lett. 406(2005) 467-473. |
| [22] | H.F. Wang, W. Gan, R. Lu, Y. Rao, B.H. Wu, Quantitative spectral and orientational analysis in surface sum frequency generation vibrational spectroscopy (SFG-VS), Int. Rev. Phys. Chem. 24(2005) 191-256. |
| [23] | R.R. Feng, Y. Guo, H.F. Wang, Reorientation of the "free OH" group in the topmost layer of air/water interface of sodium fluoride aqueous solution probed with sum-frequency generation vibrational spectroscopy, J. Chem. Phys. 141(2014) 18C507. |
| [24] | G. Ma, H.C. Allen, Surface studies of aqueous methanol solutions by vibrational broad bandwidth sum frequency generation spectroscopy, J. Phys. Chem. B 107(2003) 6343-6349. |
| [25] | R. Superfine, J.Y. Huang, Y.R. Shen, Nonlinear optical studies of the pure liquid/vapor interface:vibrational spectra and polar ordering, Phys. Rev. Lett. 66(1991) 1066-1069. |
| [26] | M. Matsumoto, Y. Kataoka, Molecular orientation near liquid-vapor interface of methanol:simulational study, J. Chem. Phys. 90(1989) 2398-2407. |
| [27] | X. Li, R.J. Feng, J.J. Wang, et al., Role of refractive index in sum frequency generation intensity of salt solution interfaces, Chin. Chem. Lett. 26(2015) 1542-1546. |