 2016, Vol.27


b School of Environmental and Chemical Engineering, Yanshan University, Qinhuangdao 066004, China;
c Institute of Advanced Materials(IAM), Nanjing Technology University, Nanjing 210046, China
With rapid economy-society development, the environmental problems become more and more serious especially in populous nations where the cumulative impact of steady growth in consumption is tremendous although individual use of resources remains low. Progress has been achieved in breaking through coal-dependent energy production improving energy efficiency and reduction of carbon dioxide emissions, however, air pollution displays unprecedented boom in several countries such as China. Itwas found that ash hazeweather appearswhen the air pollution degree intensifies, leading to badly enlarged proportion of PM2.5 concentration values. PM2.5, typically existing as atmospheric aerosol [1, 2], has attracted significant research interest due to the known impact on climate, air quality and human health [3, 4, 5].Many studies have been conducted to evaluate the diameter of air particles and the chemical compositions of forming aerosols [6, 7, 8]. In particular, in recent years there are uprising research interest regarding to OAs for which the anthropogenic sources mainly cover motor vehicle exhaust such as benzene series, phenol and diene etc. As another important branch, there are also biological sources of the active OAs primarily containing terpene compounds releasing from plants [9, 10, 11, 12], such as α-pinene, β-pinene and isoprene which often initiate the PM2.5 formation and growth [13, 14, 15, 16, 17]. As OAs in the air are mainly in the form of secondary organic aerosols (SOAs), the moisture absorption, increase and extinction genesis perplex the identification of accurate element and composition [18].
Traditional analytical methods involving mass spectrometry (MS), gas chromatography (GS), UV spectroscopy and nuclear magnetic resonance (NMR) spectroscopy etc. have been used to trace and analyze OAs and PM2.5 [19]. Among them, MS especially aerosol time-of-flight mass spectrometry (ATOFMS/AMS) [20, 21] has been largely applied to judge the ingredient-related information. Through these approaches, it has been ascertained that volatile organic compounds (VOCs) released by plants play an important role in forming OAs [22, 23, 24]. Among others, there has been a few previously published papers addressing the UV and IR spectroscopic studies of secondary organic materials which are generated by the oxidation of anthropogenic VOCs [25], including toluene and m-xylene [25], polycyclic aromatic naphthalene [26] and momocyclic toluene [27, 28, 29, 30, 31]. It is expected to have more detailed information primely reflecting the structure and composition of all known ingredients in OA/SOA air pollution, and hence the forming mechanism of PM2.5 can be better understood leading to comprehensive precautionary measures within an effective prescription.
FT-IR and Raman are known as complementary spectroscopies providing fingerprints by which molecules can be identified. However, vibrational spectroscopic fingerprints determined by molecule structure and lattice vibrations could involve perturbation due to the ambient environment and molecular stacking interactions. Vibrational spectroscpic finterprints need to clear these variations for chemical identification especially of unknown complex mixtures such as SOAs. In view of this, here we report such an experimental and theoretical study on terpenoids, mainly including isoprene, α-pinene and β-pinene. Fingerprint spectra of these chemicals are provided enabling identification of them from unknown mixtures. Regarding such a joint experimental and theoretical study on FT-IR, FT-Raman and Micro-Raman of isoprene, α-pinene, β-pinene and their mixture, it is concluded that the experimental spectra are predictable via first-principles calculations, allowing for minor fluctuations due to molecular stacking interactions and local environment which affects the degree of freedom of molecules(including translational, rotational, and vibrational).
2. ExperimentalThree terpenoid compounds used in this study include isoprene (Alfa Aesar, 99%), α-pinene (Acros Organic, 97%) and β-pinene (J&K). Raman spectra were collected at room temperature with an excitation at 1064 nm (FT-Raman) and 514.5 nm (Micro-Raman), respectively. The micro-Raman spectra were recorded with a Raman microprobe system (RENISHAW H13325), using the excitation line at 514.5 nm from an Ar ion laser, and the laser microprobe spot at 1 mm diameter. Also used is a Brucker Model VERTEX 70 FT-Raman spectrophotometer with a 1064 nm Nd:YAG laser, combined with a FT-IR system. The FT-Raman spectra and Micro-Raman spectra of isoprene, α-pinene, β-pinene take on rare differences, because both the 1064-nm and 514.5-nm excitations are not enough to induce them to excited states (details is shown in Fig.S1 in Supporting information).
First-principles calculations were performed with Gaussian 09 program package. The models were configured with Gauss View 5.0 software with optimized geometry. All calculations were carried out using density functional theory (DFT) at B3LYP level with 6-311G++(d, p) as basis set [32, 33], with diffuse functions and polarization for all atoms included. A scaling factor (0.97, 0.98, 0.98 for isoprene, α-pinene and β-pinene, respectively) was used to correct the frequency calculation results [34]. Modeling of dimer structures is determined by considering normal molecular distances on a basis of molecule stacks from the CCDC database.
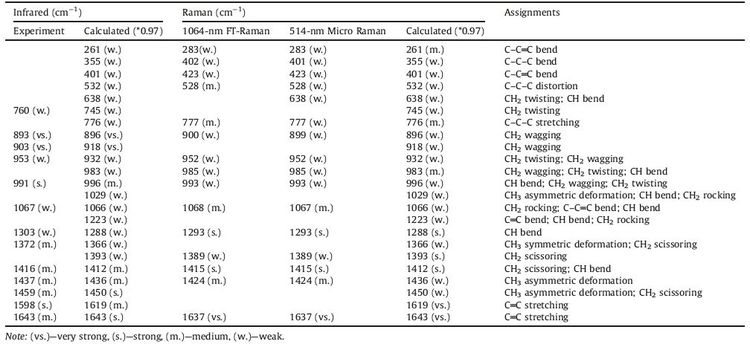
3. Results and discussionFig. 1A shows the optimized structure of isoprene, while the calculated and experimental infrared spectra of isoprene liquid are given in Fig. 1B-a and b. More details of calculations relating to single molecular and bimolecular IR spectra are given in Fig. S2 in Supporting information. Regarding the infrared activity of isoprene, there are three groups of representative peaks. First, a dominant peak is observed at-893 cm-1 which bears a shoulder at 903 cm-1 (both ascribed to CH2 wagging), in well accordance with the two brother peaks (896 and 918 cm-1) of the calculated IR activity (Fig. 1B-b). Some other characteristic peaks of isoprene belong to the series appearing at 1372 cm-1, 1416 cm-1, 1437 cm-1 and 1459 cm-1 which display one-to-one accordance with the calculated IR activity, assigned to CH2 scissoring and CH3 asymmetric deformation. Third, there is a medium-intense peak at 991 cm-1 which is attributable to a combination of CH bend, CH2 wagging and C-C=C bend. Among others, there are also a few weak peaks, such as the 1067 cm-1 mode (CH2 rocking, CH2 rocking; C-C=C bend; CH bend), 760 cm-1 (CH2 twisting), and also 1643 cm-1 (C=C stretching). Besides, it is notable of 1598 cm-1 mode which is attributed to C=C stretching but displays red-shift comparing to the calculated 1619 cm-1 mode, and also a few peaks disappeared as well as the presence of additional peaks, which are ascribed to the molecular stacking and intermolecular interactions.

|
Download:
|
| Fig. 1.(A) The optimized structure of isoprene; (B) experimental FT-IR spectrum (a) of isoprene liquid comparing with the calculated IR activity (b); (C) experimental Raman spectra excited at 514.5 nm (a) and 1064 nm (b) comparing with the calculated Raman a single molecule (c). | |
The experimental Raman spectra of isoprene, excited by 514.5 nm and 1064 nm lasers, are given in Fig. 1C, compared with a calculated Raman spectrum (Fig. S3 in Supporting information). More experimental Raman spectra under the radiation of different laser power are provided in Figs. S4 and S5 in Supporting information. The Raman spectra also display several groups of intrinsic modes to identify isoprene, such as the peak appearing at 528 cm-1, 777 cm-1 and 1293 cm-1, which are well coincident with modes of the calculated Raman-active models at 532 cm-1, 776 cm-1 and 1288 cm-1 assigned to C-C-C distortion, C-C-C stretching and CH bend, respectively. Also characteristic peaks of isoprene observed at 900 cm-1 (broad peak), 952 cm-1 and 985 cm-1 are attributed to CH2 wagging, CH2 twisting and CH2 wagging, CH2 wagging and CH2 twisting and CH bend. In addition, there is a strong peak observed at 1637 cm-1 which appears at 1619 cm-1 in calculated spectrum with a foot peak at 1643 cm-1, both assigned to C=C stretching. It is worth mentioning that there are a few sharp peaks present in the calculated Raman spectrum, such as 896 cm-1 (CH2 wagging), 918 cm-1 (CH2 wagging), 932 cm-1 (CH2 twisting, CH2 twisting), 983 cm-1 (CH2 wagging, CH2 twisting, CH bend), and 996 cm-1 (CH bend, CH2 wagging, CH2 twisting), as well as a series of peaks at the region of 1360-1450 cm-1, 3= cm-1, 638 cm-1, 745 cm-1, 1029 cm-1 and 1223 cm-1. The absence of certain Raman peaks and/or enlarged halfwidths indicate that the experimental Raman may be resulted from multiple molecules where molecule interactions bring in influences [35, 36, 37]. Detailed assignments for the calculated and experimentally observed modes of isoprene are shown in Table 1.
|
|
Table 1 A list showing the vibrational modes of isoprene. |
The optimized structure of α-pinene is presented in Fig. 2A. Calculated IR activity of a single molecule and experimental FT-IR spectra of α-pinene liquid are shown in Fig. 2B-a and b, respectively, displaying well coincidence with each other. Table 2 presents a list showing the vibrational modes of α-pinene including both experimental and theoretical, IR & Raman activities. More details of the calculated IR and Raman spectra of the α-pinene are provided in Figs. S6 and S7 in Supporting information. By looking into the fingerprint spectrum of this molecule, there is a very strong peak at 788 cm-1 (CH bend) which bears a shoulder at 770 cm-1 (ring deformation), showing accordance with the calculated 789 cm-1 mode, and a foot peak at 761 cm-1. Besides, a few relatively strong peaks (e.g., 883 cm-1, 953 cm-1, 1013 cm-1, 1124 cm-1, 1218 cm-1, 1265 cm-1, 1331 cm-1) can also be regarded as representative IR-active modes in identifying α-pinene. The appearance of a few couples of tooth peaks (1085/1100 cm-1, 1204 cm-1, 1443 cm-1, 1469 cm-1 etc.) with broadening halfwidth and minor red shifts, assuming using the calculated single molecule IR activity as reference [38], are ascribe to the molecular stacking and intermolecular interactions. In addition, a series of peaks appearing at the region of 1040-1124 cm-1 displays one-to-one accordance with the calculated IR spectrum, assigned to CH2 twisting and CH bend. Similarly well accordance is found in the low-frequency region, such as 400-770 cm-1 (assigned to ring deformation), and 840-960 cm-1 (C skeleton deformation), as listed in Table 2.

|
Download:
|
| Fig. 2.(A) The optimized structure of α-pinene; (B) experimental FT-IR spectrum (a) of a-pinene liquid comparing with the calculated IR activity (b); (C) experimental Raman spectra excited at 514.5 nm (a) and 1064 nm (b) comparing with the calculated Raman a single molecule (c). | |
|
|
Table 2 A list showing the vibrational modes of α-pinene. |

The experimental Raman spectra of α-pinene excited by 514.5 nm and 1064 nm lasers, along with a calculated Raman spectrum, are provided in Fig. 2C. Details of the experimental results via both 514.5 nm and 1064 nm excitation are provided in Figs. S8 and S9 in Supporting information. It is noted that the FTRaman, Micro Raman and calculated Raman display basically the same spectrum with only minor shifts in the low-frequency and high-frequency region, respectively. The very strong peak at 668 cm-1 is assigned to ring deformation. Also noted is the adjacent medium-intense peaks in the low-frequency region (e.g., 464 cm-1, 481 cm-1, 564 cm-1, 620 cm-1 and 772 cm-1), which display one-to-one accordance and are also attributed to similar ring deformation vibrations. Another interesting finding from the Raman of α-pinene is that there are equally spaced peaks, such as 906/929/954 cm-1 (C skeleton deformation), 1437/1448/ 1470 cm-1 (CH2 scissoring and CH3 asymmetric deformation), 1043/1085/1126 cm-1 (CH2 twisting and CH bend) [38], indicating the same vibrational energy-level difference due to vibration coupling effect caused by two or more isomer groups (-CH3) linking with one atom (skeleton -C-) [35, 36].
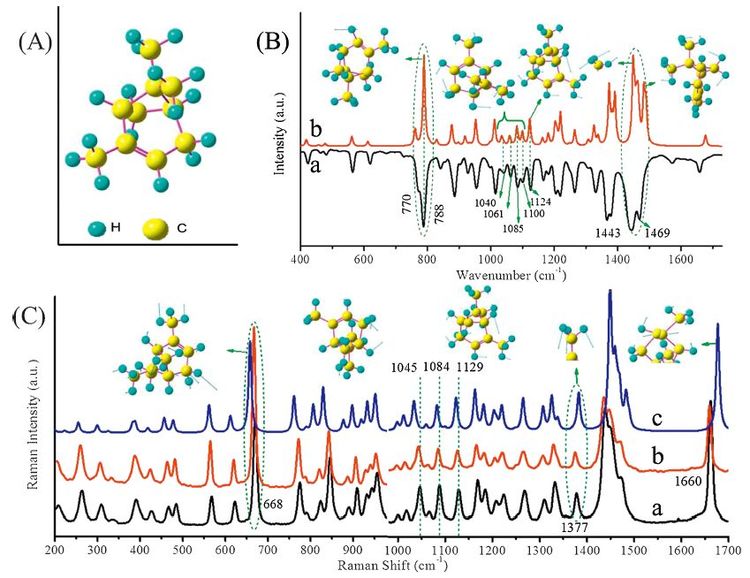
Similarly Fig. 3 gives the optimized structure and IR & Raman activities of β-pinene. β-Pinene and α-pinene are isomerides and bothVOCs generatedby the plants such as larch, white bark pine and Chinese pine etc. In contrast to the experimental IR spectrum of the liquid samples, however, it was found that the calculated IR and Raman spectra of a single β-pinene molecule differ from experimental results (Figs. S10 and S11 in Supporting information). Instead, simplyemploying themodels of dimerβ-pinenemolecules, both the calculated IR and Raman spectra well reproduced the experimental observation (details listed in Table 3), indicating unneglectable intermolecular interactions existing in the liquid sample of β-pinene. Regarding the IR activity of β-pinene, there are several groups of typical peaks distinguishing itself from others including its isomer α-pinene. The first fingerprint belongs to the strong intense peaks observed at 874 cm-1 (CH2 wagging) having a shoulder at 8= cm-1 (C skeleton deformation).Among others, there are two brother peaks appearing at 1370 cm-1 and 1385 cm-1, assigned to CH3 symmetric deformation; also at the low-frequency region two weak peaks at 523 cm-1 and 602 cm-1 attributed to C skeleton deformation; also a few medium-tense peaks at 1105, 1143 and 1257 cm-1 mainly belonging to CH bend; and the 1457 cm-1mode (CH3 asymmetric deformation and CH2 scissoring) with two shoulder peaks at both sides (1438 cm-1 of CH2 scissoring and 1469 cm-1 of CH3 asymmetric deformation and CH2 scissoring) is also a unique character ofβ-pinene. In addition, a very strong peak 1643 cm-1, assigned to C=C stretching, also displays obvious relative intensity comparing with that of its isomer α-pinene.

|
Download:
|
| Fig. 3.(A) The optimized structure of β-pinene; (B) experimental FT-IR spectrum (a) of β-pinene liquid comparing with the bimolecule calculated IR activity (b); (C) experimental Raman spectra excited at 514.5 nm (a) and 1064 nm (b) comparing with the calculated Raman a single molecule (c) bimolecule (d). | |
|
|
Table 3 A list showing the vibrational modes of β-pinene. |

Raman spectra excited by 514.5 nm and 1064 nm of β-pinene are provided in Fig. 3C. More detailed experimental results via 514.5 nm and 1064 nm excitations are provided in Figs. S12 and S13 in Supporting information. As mentioned above, the calculated Raman spectrum of a single β-pinene molecule (Fig. 3C-c) differs from experimental results (Fig. 3C-a and-b), while the modeling of a dimer β-pinene (Fig. 3C-d) gives rise to better accordance with experimental results, especially by noting the peaks at 352 cm-1, 472 cm-1, 644 cm-1, 716 cm-1, 1644 cm-1, teeth peaks at 1185/1202 cm-1 and the multimodal band at 1413/1438/1458/1478 cm-1. Taking into account of the single-molecule or multimolecule situations, Raman spectral identification for β-pinene could be emphasized at a few unique peaks. First glance could focus on the 644 cm-1 mode (ring breathing) in the experimental Raman spectrum which allows a red-shift of -14 cm-1 (i.e., a peak at 630 cm-1) by comparing the theoretically predicted Raman activity. It is suggested that the series of peaks at 1413 cm-1 (CH2 scissoring), 1439 cm-1 (CH2 scissoring), 1458 cm-1 (CH2 scissoring, CH3 asymmetric deformation) and 1478 cm-1 (CH2 scissoring, CH3 asymmetric deformation) [39] could be regarded as another fingerprint of β-pinene. In addition, attention may need to be paid if judging the strongest peak at 1644 cm-1 (C=C stretching) [39] as it also allows for peakvalue shifts according to the calculation results in this study. It is worth mentioning that the fruitful Raman peaks as a whole could still be a piece of evidence to recognize the presence of β-pinene and even likely its proportion of ingredients.
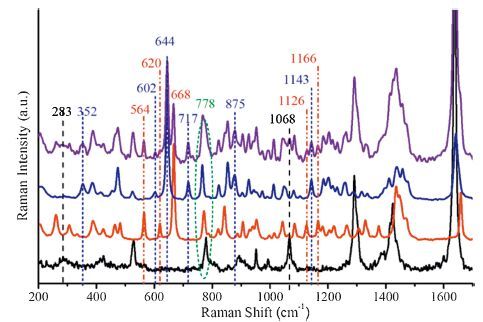
Having clarified the fingerprint spectra of isoprene and pinene isomers, we attempted to provide further insights of spectral analysis by sampling a mixture of the above chemicals. Fig. 4 gives a comparison of the experimental Raman spectra of isoprene, apinene, β-pinene and a mixture of the three compounds with a molecular proportion at 1:1:1. Detailed experimental results via 1064 nm excitation are provided in Fig. S14 in Supporting information. It is notable that there are several characteristic peaks exclusively assigned to one of the three chemicals as highlighted with dot lines of different colors. Among them, the peaks at 283 cm-1 (C-C=C bend), 1068 cm-1 (CH2 rocking; C-C=C bend; CH bend), 1293 cm-1 (CH bend) and 1637 cm-1 (C=C stretching) bands soly belong to fingerprints of isoprene. Similarly, the strong peaks at 564 cm-1, 620 cm-1 and 668 cm-1 are assigned to the intrinsic ring deformation of α-pinene; and 1126 cm-1 (CH bend) and 1166 cm-1(CH bend, C-C=C bend and CH2 twisting) modes are also from α-pinene. In contrast, fingerprints of β-pinene retained in the mixture spectrum aim at 352 cm-1, 602 cm-1, 644 cm-1, 717 cm-1, 875 cm-1 and 1143 cm-1. Other than these distingable fingerprints of the three compounds, the broad peaks at -778 cm-1 and -1450 cm-1 are probably due to superposition of isoprene (777 cm-1, 1424 cm-1), α-pinene (772 cm-1, 1448 cm-1) and β-pinene (766 cm-1, 1458 cm-1), respectively [40].

|
Download:
|
| Fig. 4.The experimental FT-Raman spectra of isoprene (a), α-pinene (b), β-pinene (c), and a mixture (d) of the three with a proportion of 1:1:1, excited at 1064 nm. | |
In summary, we report an indepth investigation endeavoring to identify isoprene, α-pinene, β-pinene via FT-IR and Raman spectroscopic fingerprints. Experimentally well-resolved spectra of the three compounds provide vivid evidences, which find well accordance with the first-principles calculation results. Analysis of the vibrational modes is fully addressed, as well as their red shifts due to intermolecular interactions. Also noted is the appearance of equally-spaced peaks which likely result from vibration coupling effect. Further, by sampling a mixture of isoprene, α-pinene and bpinene, it is verified that vibrational spectroscopic fingerprints are operative to identify them in atmospheric environment.
AcknowledgmentsThis work is supported by Young Professionals Program in Institute of Chemistry, Chinese Academy of Sciences (No. Y3297B1261). Also we thank the national Thousand Youth Talents Program and financial support from CAS project (Nos. Y31M0112C1 and Y5294512C1).
Appendix A. Supplementary dataSupplementary data associated with this article can be found, in the online version, at http://dx.doi.org/10.1016/j.cclet.2016.01.036.
| [1] | M. Hallquist, J.C. Wenger, U. Baltensperger, et al., The formation, properties and impact of secondary organic aerosol:current and emerging issues, Atmos. Chem. Phys. 9(2009) 5155-5236. |
| [2] | M.O. Andreae, A new look at aging aerosols, Science 326(2009) 1493-1494. |
| [3] | D.W. Dockery, C.A. Pope, X.P. Xu, et al., An Association between air pollution and mortality in six U.S. Cities, N. Engl. J. Med. 329(1993) 1753-1759. |
| [4] | J.C. Chow, J.G. Watson, J.L. Mauderly, et al., Health effects of fine particulate air pollution:lines that connect, J. Air Waste Manage. Assoc. 56(2006) 1368-1380. |
| [5] | M. Kanakidou, J.H. Seinfeld, S.N. Pandis, et al., Organic aerosol and global climate modelling:a review, Atmos. Chem. Phys. 5(2005) 1053-1123. |
| [6] | D. Chand, R. Wood, T.L. Anderson, S.K. Satheesh, R.J. Charlson, Satellite-derived direct radiative effect of aerosols dependent on cloud cover, Nat. Geosci. 2(2009) 181-184. |
| [7] | J.C. Fyfe, K. von Salzen, N.P. Gillett, et al., One hundred years of Arctic surface temperature variation due to anthropogenic influence, Sci. Rep. 3(2013) 2645. |
| [8] | J.E. Penner, X.Q. Dong, Y. Chen, Observational evidence of a change in radiative forcing due to the indirect aerosol effect, Nature 427(2004) 231-234. |
| [9] | D.V. Spracklen, B. Bonn, K.S. Carslaw, Boreal forests, aerosols and the impacts on clouds and climate, Philos. Trans. R. Soc. London, Ser. A 366(2008) 4613-4626. |
| [10] | K.S. Carslaw, O. Boucher, D.V. Spracklen, et al., A review of natural aerosol interactions and feedbacks within the Earth system, Atmos. Chem. Phys. 10(2010) 1701-1737. |
| [11] | P. Paasonen, A. Asmi, T. Petäjä, et al., Warming-induced increase in aerosol number concentration likely to moderate climate change, Nat. Geosci. 6(2013) 438-442. |
| [12] | J.R. Odum, T.P.W. Jungkamp, R.J. Griffin, et al., Aromatics, reformulated gasoline, and atmospheric organic aerosol formation, Environ. Sci. Technol. 31(1997) 1890-1897. |
| [13] | C.A. Stroud, P.A. Makar, D.V. Michelangeli, et al., Simulating organic aerosol formation during the photooxidation of toluene/NOx mixtures:Comparing the equilibrium and kinetic assumption, Environ. Sci. Technol. 38(2004) 1471-1479. |
| [14] | A.G. Xia, D.V. Michelangeli, P.A. Makar, Box model studies of the secondary organic aerosol formation under different HC/NOx conditions using the subset of the Master Chemical Mechanism for α-pinene oxidation, J. Geophys. Res. 113(2008) D10301. |
| [15] | M.E. Jenkin, D.E. Shallcross, J.N. Harvey, Development and application of a possible mechanism for the generation of cis-pinic acid from the ozonolysis of α- and β-pinene, Atmos. Environ. 34(2000) 2837-2850. |
| [16] | M.E. Jenkin, Modelling the formation and composition of secondary organic aerosol from α- and β-pinene ozonolysis using MCM v3, Atmos. Chem. Phys. 4(2004) 1741-1757. |
| [17] | M. Capouet, J.F. Müller, K. Ceulemans, et al., Modeling aerosol formation in alphapinene photo-oxidation experiments, J. Geophys. Res. 113(2008) D02308. |
| [18] | I.J. George, J.P.D. Abbatt, Heterogeneous oxidation of atmospheric aerosol particles by gas-phase radicals, Nat. Chem. 2(2010) 713-722. |
| [19] | J.R. Odum, T. Hoffmann, F. Bowman, et al., Gas/particle partitioning and secondary organic aerosol yields, Environ. Sci. Technol. 30(1996) 2580-2585. |
| [20] | T. Jokinen, M. Sipilä, H. Junninen, et al., Atmospheric sulphuric acid and neutral cluster measurements using CI-APi-TOF, Atmos. Chem. Phys. 12(2012) 4117-4125. |
| [21] | M. Ehn, J.A. Thornton, E. Kleist, et al., A large source of low-volatility secondary organic aerosol, Nature 506(2014) 476-479. |
| [22] | A.K.H. Lau, Z.B. Yuan, J.Z. Yu, P.K.K. Louie, Source apportionment of ambient volatile organic compounds in Hong Kong, Sci. Total Environ. 408(2010) 4138-4149. |
| [23] | P.Q. Fu, K. Kawamura, C.M. Pavuluri, T. Swaminathan, J. Chen, Molecular characterization of urban organic aerosol in tropical India:contributions of primary emissions and secondary photooxidation, Atmos. Chem. Phys. 10(2010) 2663-2689. |
| [24] | A. Hodzic, J.L. Jimenez, S. Madronich, et al., Modeling organic aerosols in a megacity:potential contribution of semi-volatile and intermediate volatility primary organic compounds to secondary organic aerosol formation, Atmos. Chem. Phys. 10(2010) 5491-5514. |
| [25] | P.F. Liu, N. Abdelmalki, H.M. Hung, et al., Ultraviolet and visible complex refractive indices of secondary organic material produced by photooxidation of the aromatic compounds toluene and m-xylene, Atmos. Chem. Phys. 15(2015) 1435-1446. |
| [26] | A.T. Lambe, C.D. Cappa, P. Massoli, et al., Relationship between oxidation level and optical properties of secondary organic aerosol, Environ. Sci. Technol. 47(2013) 6349-6357. |
| [27] | M. Zhong, M. Jang, Light absorption coefficient measurement of SOA using a UV-Visible spectrometer connected with an integrating sphere, Atmos. Environ. 45(2011) 4263-4271. |
| [28] | M. Zhong, M. Jang, A. Oliferenko, G.G. Pillai, A.R. Katritzky, The SOA formation model combined with semiempirical quantum chemistry for predicting UV-vis absorption of secondary organic aerosols, Phys. Chem. Chem. Phys. 14(2012) 9058-9066. |
| [29] | T. Nakayama, Y. Matsumi, K. Sato, et al., Laboratory studies on optical properties of secondary organic aerosols generated during the photooxidation of toluene and the ozonolysis of α-pinene, J. Geophys. Res. 115(2010) D24204. |
| [30] | K. Li, W.G. Wang, M.F. Ge, J.J. Li, D. Wang, Optical properties of secondary organic aerosols generated by photooxidation of aromatic hydrocarbons, Sci. Rep. 4(2014) 4922. |
| [31] | T. Nakayama, K. Sato, Y. Matsumi, et al., Wavelength and NOx dependent complex refractive index of SOAs generated from the photooxidation of toluene, Atmos. Chem. Phys. 13(2013) 531-545. |
| [32] | C. Lee, W.T. Yang, R.G. Parr, Development of the Colle-Salvetti correlation-energy formula into a functional of the electron density, Phys. Rev. B37(1988) 785-789. |
| [33] | A.D. Becke, Density-functional exchange-energy approximation with correct asymptotic behavior, Phys. Rev. A:At. Mol. Opt. Phys. 38(1988) 3098-3100. |
| [34] | M.J. Alam, S. Ahmad, FTIR FT-Raman, UV-visible spectra and quantum chemical calculations of allantoin molecule and its hydrogen bonded dimers, Spectrochim. Acta, A:Mol. Biomol. Spectrosc. 136(2015) 961-978. |
| [35] | B. Morzyk-Ociepa, K. Dysz, I. Turowska-Tyrk, D. Michalska, X-ray crystal structure, vibrational spectra and DFT calculations of 3-chloro-7-azaindole:a case of dual N-H...N hydrogen bonds in dimers, Spectrochim. Acta, A:Mol. Biomol. Spectrosc. 136(2015) 405-415. |
| [36] | Ł. Wołoszyn, M.M. Ilczyszyn, V. Kinzhybalo, X-ray diffraction, spectroscopic (IR, Raman) and DSC studies of bis (betainium) p-toluenesulfonate monohydrate crystal, Vib. Spectrosc. 76(2015) 6-21. |
| [37] | S. Alen, D. Sajan, K.J. Sabu, et al., Vibrational spectral analysis, electronic absorption and non-linear optical behavior of (E)-1-(2, 4, 6-trimethoxyphenyl)pent-1-en-3-one, Vib. Spectrosc. 79(2015) 1-10. |
| [38] | H.W. Wilson, The infrared and Raman spectra of α- and β-pinenes, Appl. Spectrosc. 30(1976) 209-212. |
| [39] | S. Qiu, G.N. Li, P. Liu, et al., Chirality transition in the epoxidation of (-)-α-pinene and successive hydrolysis studied by Raman optical activity and DFT, Phys. Chem. Chem. Phys. 12(2010) 3005-3013. |
| [40] | Z.X. Luo, X. Cheng, Y. Luo, et al., Photoassisted magnetization of fullerene C60 with magnetic-field trapped Raman scattering, J. Am. Chem. Soc. 134(2012) 1130-1135. |