 2016, Vol.27


Improvement of highly sensitive, rapid, accurate and economical methods for the determination of hydrogen peroxide (H2O2) is a very significant challenge in analytical chemistry, because H2O2 is not only a byproduct of several highly selective oxidases, but also is a necessary mediator in clinical, industrial, environmental analysis, pharmaceutical and many other fields [1]. H2O2 is also used as an oxidant for liquid-based fuel cells [2, 3] and has emerged as an important byproduct of enzymatic reactions in the field of biosensing [4]. H2O2 determination can be carried out using several analytical techniques such as titrimetry [5], spectrophotometry [6, 7], fluorometry [8, 9], chemiluminescence [10], and chromatography [11, 12]. However, electrochemical methods have emerged as preferable, owing to their relatively low cost, easiness, performance and high sensitivity [13, 14]. Prussian blue and metal phthalocyanine-based electrodes are the most important nonenzymatic electrode modifiers that catalyze the H2O2 formation in low potential. PB can be reversibly oxidized to Prussian yellow or reduced to Prussian white, so it operates as an electron transfer mediator for both production and reduction of H2O2 [15]. Prussian blue has a basic cubic structure consisting of alternating iron (Ⅱ) and iron (Ⅲ) located on a face centered cubic lattice in such a way, that the iron (Ⅲ) ions are surrounded octahedrically by nitrogen atoms, and iron (Ⅱ) ions are surrounded by carbon atoms [16]. Due to many applications of the PB in various fields, a convenient method to immobilize a stable and homogeneous film with controllable morphology on the electrode substrate is usually required. To obtain uniform thin films able to defect free PB, a selfassembly process based on multiple sequential adsorptions of ferric cations and hexacyanoferrate anions on a charged support was reported [17]. Also usually most of the sensors and biosensors implied above are exercised in neutral or weak alkaline media [18]. However, there are samples containing H2O2 show weak acidity like food, fermentation and environmental samples [19]. Hence, the direct H2O2 determination in an acidic medium is actually significant and appropriate.
Conducting polymers are the most common catalyst supporting materials that possess both protonic and electronic conductivity. Among many conducting polymers, poly(o-phenylenediamine) (PoPD) is of great interest because of its potential use in various fields of technology. As opposed to polyaniline or polypyrrole, PoPD shows the conductivity in its reduced state, whereas its oxidized state is insulating. This determines the electrochemical properties of PoPD, since many electrode redox processes have been shown to take place within a relatively narrow potential window, corresponding to the reduced (conducting) form of this polymer [20].
In the present work, Prussian blue nanoparticles were prepared at GC electrodes modified with poly(o-phenylenediamine) film by a simple self-assembly procedure and the modified electrode (PBNPs/PoPD/GCE) used for the electrochemical determination of H2O2 in an acidic medium and the results were discussed in details.
2. ExperimentalHydrogen peroxide (35%) was purchased from Fluka. KNO3, K3[Fe(CN)6], Fe(NO3)3-9H2O, o-phenylenediamine, H2SO4 and other reagents were of analytical grade from Merck and Aldrich. The acetate and phosphate buffer solutions (PBS) were prepared form CH3COOH, CH3COOK, H3PO4, KH2PO4, K2HPO4, HNO3 and KOH. Double-distilled water was used throughout this experiment. Electrochemical measurements were performed using a computer controlled potentiostat/galvanostat (model IVIUM, CompactStat instrument, The Netherlands). A conventional three-electrode system was used with a modified PBNPs/PoPD/GC electrode as a working electrode, a platinum wire as a counter electrode and a saturated calomel electrode (SCE) as a reference electrode. All experiments were performed at room temperature (25 ± 2 ℃). Faradic impedance measurements were performed in the presence of a 1.0 mmol L-1 K3Fe(CN)6/K4Fe(CN)6 (1:1)-mixture as a redox-probe, containing 0.1 mol L-1 KCl, using an alternating current voltage of 5 mV. Impedance measurements were performed at an open circuit voltage (OCV) of 0.21 V. The morphological characterizations of all electrodes have been examined by means of scanning electron microscopy, SEM (TESCAN, VEGA Ⅱ). A digital pH-meter (Ion Analyzer 250, Corning) with precision of ±0.001 was used to read the pH value of the buffered solutions.
3. Results and discussion 3.1. Preparation of PBNPs/PoPD/GCEThe GC electrode (with a geometrical area of 0.0314 cm2) was polished carefully with a 0.3 μm alumina slurry then washed and sonicated in double-distilled water and ethanol, each for several minutes, and dried in air. Then it was immersed in an aqueous solution of 0.3 mol L-1 H2SO4 containing 40 mmol L-1 of o-phenylenediamine, and its surface was coated with poly(o-phenylenediamine) film via an electropolymerization process, which occurred by cycling the electrode potential between -0.4 V and 1.3 V vs. SCE at a scan rate of 50 mV s-1. Then by immersing the glassy carbon electrode modified with poly(o-phenylenediamine) film in a 2 mmol L-1 aqueous solution of K3[Fe(CN)6], Fe(NO3)3-9H2O and 0.5 mol L-1 KNO3 (for 6 min) as a derivatizing reagent, a permanent film of PBNPs formed on the surface of the PoPD/GCE. The modified electrode was washed with double distilled water, and used for electrochemical investigations.
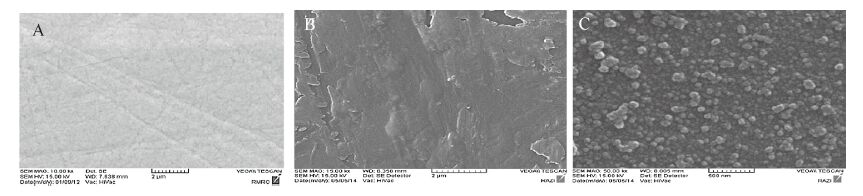
3.2. Characterization of PBNPs/PoPD/GCESEM images of the electrode surface obtained at different stages of the modifying process are shown in Fig. 1. The morphology of the bare GC electrode surface after polishing is displayed in Fig. 1A. As shown in this image, there are some defects on the GC electrode surface that obtained during the surface polishing step. Fig. 1B shows the surface morphology of PoPD/GCE. As can be seen, the PoPD film with a uniform coating formed on the surface of the GC electrode. Fig. 1C shows the morphology of PBNPs/PoPD/GCE. SEM image shows the obtained nanoparticles are well dispersed on the polymeric film. The resulting modified electrode displayed the PB nanoparticles with an average particle size of 70 nm.

|
Download:
|
| Fig. 1.SEM images of the (A) bare GCE, (B) PoPD/GCE and (C) PBNPs/PoPD/GCE. | |
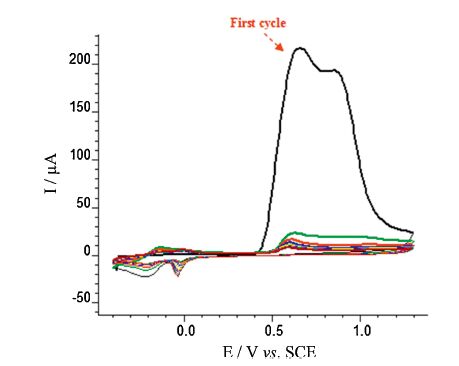
Our experiments showed that o-phenylenediamine (o-PD) can be electropolymerized at the surface of a bare GC electrode. Fig. 2 illustrates the electropolymerization of o-PD at the surface of GCE by cyclic voltammetry. The wave of oxidation emerges irreversibly, and on successive scans, the peak current declined remarkably with each scan until ultimately no current flowed. This manner is suggestive of a PoPD film coating the electrode and blocking the availability of the monomer to the electrode surface. The cyclic voltammogram (not shown) of GCE modified with a PoPD film in 0.3 mol L-1 H2SO4 at a scan rate of 50 mV s-1, exhibits the PoPD film redox activity in the range -0.4 V to 0.15 V, and a broad electrochemical window from 0.15 V to 1.3 V is accessible for electrocatalytic applications. By cycling the PoPD film repeatedly for 100 times at a scan rate of 30 mV s-1, the value of peak current diminishes by about 4%; this shows a favorable stability.

|
Download:
|
| Fig. 2.Cyclic voltammograms (10 cycles) recorded during potentiodynamic growth of PoPD film on GCE in solution containing 40 mmol L-1 o-phenylenediamine and 0.3 mol L-1 H2SO4 at a scan rate of 50 mV s-1. | |
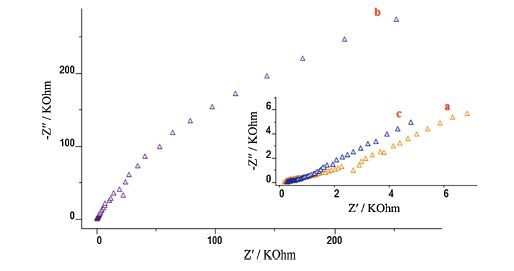
Electrochemical impedance spectra (EIS) were used to monitor the procedure in providing modified electrodes, which could provide important information in the case of the electron transfer kinetics of the electrode surface in the modification process [21]. A typical impedance spectrum includes a semicircle portion corresponding to charge transfer resistance and a linear portion corresponding to the diffusion limited process. The semicircle diameter corresponds to the electron-transfer resistance (Ret). EIS of the bare GCE exhibited an almost straight line, which revealed the characteristic of a diffusion limiting step of the electrochemical process. Ret for bare GCE was 0.7 kΩ (Fig. 3a). After electropolymerization of o-PD at the GCE, a clear interfacial Ret was observed (Ret = 189 kΩ, Fig. 3b), which could be explained by the fact that deposition of PoPD at the surface of GCE yields a barrier layer that causes an electron transfer resistance. However, preparation of PBNPs-modified PoPD/GCE made electron transfer easier (Fig. 3c, Ret = 0.13 kΩ). The small size, large surface-tovolume ratio and the augmented surface of PBNPs, qualify their applications in catalysis.

|
Download:
|
| Fig. 3.Nyquist plots for the faradic impedance measurements of a 1.0 mmol L-1 solution of 1:1 K3[Fe(CN)6]/K4[Fe(CN)6] performed on (a) bare GCE, (b) PoPD/GCE and (c) PBNPs/PoPD/GCE. | |
The voltammetric investigations using PBNPs/PoPD/GCE were performed in 0.1 mol L-1 phosphate buffered solutions in the pH range of 2-12 (figure not shown). With the increasing pH value from 2 to 4, the redox peak currents comparatively increased, then markedly decreased over the range 4-11, and at pH 12 no cyclic voltammetric signal was observed. In pH higher than 6.4, the strong interactions occurred between ferric ions in the film and hydroxyl ions (OH-) in the solution to produce Fe(OH)3 [22]. On the other hand, in the pH range of 2-11 the formal potential of the surface redox couple, E', remains invariable. In this work, pH 4 was chosen as an optimum pH due to the fact that well defined voltammograms were acquired at pH 4.
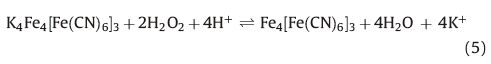
The cyclic voltammograms of the PBNPs-modified PoPD/GCE at different scan rates in a buffered solution of pH 4 are shown in Fig. 4A. Two distinctive redox couples with formal potentials of +0.150 V for the first couple and +0.870 V for the second couple at a scan rate of 50 mV s-1 were observed, which are due to the oxidation and reduction of Prussian blue in which the PB is reduced to Prussian white (PW) and is re-oxidized to PB. The values for peak separation (20 mV and 30 mV for the first couple and second couple, respectively) are very close to the theoretical value demonstrating high conductivity of the film and favorable reversibility of the redox reaction on the electrode surface. PB is known to exist in both soluble and insoluble forms, according to the following reactions:


|
Download:
|
| Fig. 4.(A) Cyclic voltammograms of the PBNPs/PoPD/GCE in 0.5 mol L-1 KNO3 (acetate buffer, pH 4) solution at various scan rates (from inner to outer curve): 10, 20, 30, 40, 50, 60, 70, 80, 90 and 100 mV s-1. (B) Plots of peak current vs. scan rate (10, 20, 30, 40, 50, 60, 70, 80, 90, 100, 130 and 150 mV s-1) for the first set peaks. (C) Plots of peak current vs. square root of scan rate (200, 300, 400, 500, 600, 700 and 800 mV s-1) for the first set peaks. | |
The linear dependence of the anodic and cathodic peak currents (Ip) on the potential scan rate was obtained up to 150 mV s-1 for the first and second set of peaks, as predicted for a system with less diffusion (Fig. 4B). For high scan rates, the plot of Ip vs. υ digresses from the linearity and the peak currents become proportional to the square root of the scan rate, illustrating diffusion controlled processes related to the comparatively slow diffusion of counter ions into a limited reaction layer (Fig. 4C). The ratio of peak currents (Ipa/Ipc) remains nearly equal to unity at various scan rates, as expected for surface-type behavior.
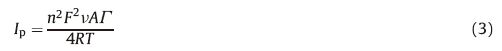
For a reversible surface reaction the peak current is related to the surface concentration of the electroactive mediator (Γ), by the following equation [23]:
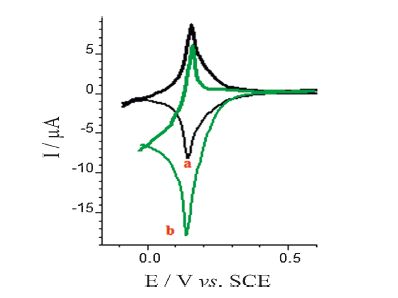
The cyclic voltammograms of the PBNPs/PoPD/GCE in the absence and presence of 1 mmol L-1 H2O2 are shown in Fig. 5. The homolographic redox peaks related to the PBNPs-modified electrode were changed by the H2O2 addition; increasing of cathodic peak current and decreasing of anodic peak current are expressive of the electrocatalytic H2O2 reduction. During the electrocatalytic process, PB, oxidative form of Prussian white, regenerated by a chemical reaction between H2O2 and Prussian white:


|
Download:
|
| Fig. 5. Cyclic voltammograms of the PBNPs/PoPD/GCE in the absence (curve a) and presence (curve b) of 1 mmol L-1 H2O2. Supporting electrolyte was 0.5 mol L-1 KNO3 solution (acetate buffer pH 4); potential scan rate: 20 mV s-1. | |
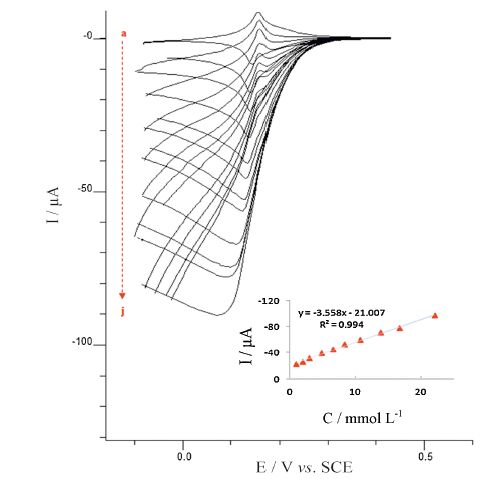
The effect of various concentrations of H2O2 on the voltammetric behaviors of H2O2 reduction at the modified electrode was also shown in Fig. 6. With the increased concentration of H2O2, the reduction peak current increased, which indicates the excellent electrocatalytic behavior of the PBNPs/PoPD/GCE electrode.

|
Download:
|
| Fig. 6.Cyclic voltammograms of the PBNPs/PoPD/GCE in 0.1 mol L-1 acetate buffer (pH 4) containing 0.5 mol L-1 KNO3 at different concentration of H2O2 (a-j): 1, 1.98, 2.94, 4.8, 6.6, 8.33, 10.7, 13.8, 16.7 and 22 mmol L-1, potential scan rate: 20 mV s-1. Inset shows the variation of peak current vs. H2O2 concentration. | |
The effect of the pH of the buffer solution on the response of this modified electrode in the electrocatalytic reduction of H2O2 with various pHs (2-7) was investigated (figure not shown). The results showed that with increasing pH values in the range of 2-4, cathodic current increased then markedly decreased. More reproducible results of the modified electrode were obtained at pH 4. Therefore, it was selected as the optimum pH for the reduction of H2O2.
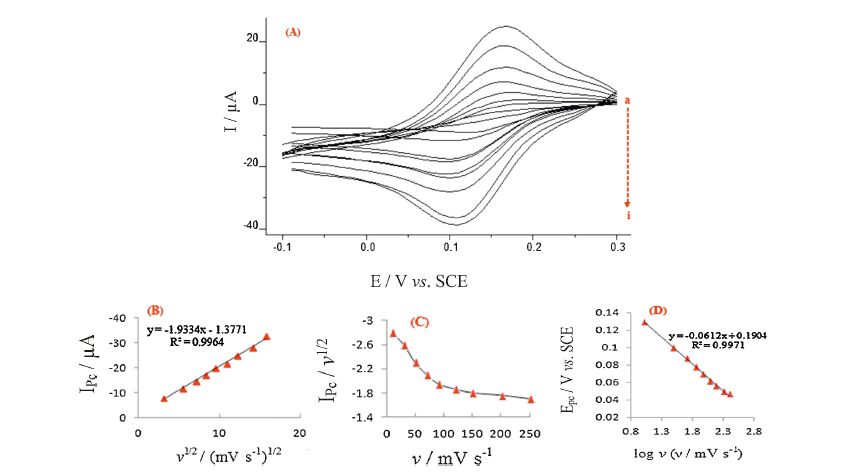
Fig. 7A shows the influence of scan rate increment on cathodic peak current of H2O2 at the PBNPs/PoPD/GCE. The peak currents are linearly proportional to the square root of the scan rate in the range of 10-250 mV s-1 (Fig. 7B). This suggests that the process is diffusion-controlled and is appropriate for quantitative applications. Furthermore, a plot of current function (I/υ1/2) vs. scan rate exhibits an indicative shape typical of an EC' catalytic process as shown in Fig. 7C. The cathodic transfer coefficient (α) was computed by plotting Ep vs. log υ [24] (Fig. 7D), a straight line with a slope equal to 1/2(2.3RT/αnF) obtained in the testing range of υ, so the value of α was calculated as 0.48.

|
Download:
|
| Fig. 7.(A) Cyclic voltammograms of the PBNPs/PoPD/GCE in the presence of 1 mmol L-1 H2O2. Potential scan rates (a-i): 10, 30, 50, 70, 90, 120, 150, 200 and 250 mV s-1. (B) and (C) represent the variations of the cathodic peak current, Ipc vs. υ1/2, and cathodic current function, Ipc/υ1/2 vs. υ, respectively. (D) Plot of the cathodic peak potential as a functional of log υ. Data was extracted from (A). Supporting electrolyte was the same as in Fig. 5. | |
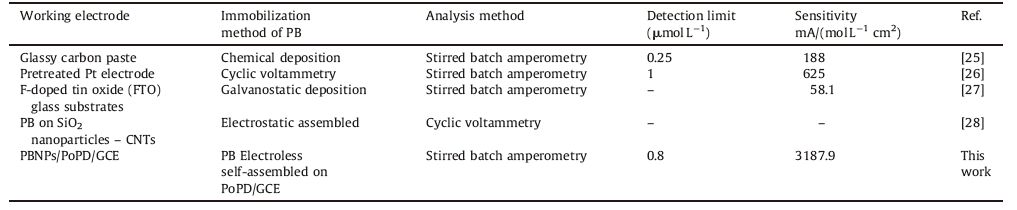
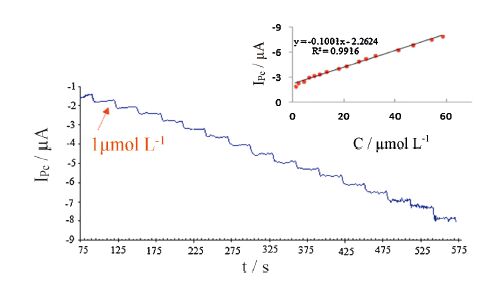
The amperometric current-time curve of the PBNPs/PoPD/GCE in 0.1 mol L-1 acetate buffer (pH 4) recorded at applied potential of -0.1 V vs. SCE and sequential additions of H2O2 under stirring conditions is showed in Fig. 8. As it can be seen, a well-defined response was observed during the stepwise increasing of H2O2 concentration in the range of 1-58.22 μmol L-1. It was observed that the sensor responds so rapidly to the substrate and reached to steady-state current within 2 s. Inset to this figure shows the calibration curve for PBNPs/PoPD/GCE. The sensitivity and detection limit of the proposed electrode were found to be 3187.89 mA (mol L-1)-1 cm-2 and 0.8 μmol L-1 (S/N = 3), respectively. Table 1 exhibits some analytical properties of PBNPs/PoPD/ GCE in comparison with several PB based H2O2 electrochemical sensors.

|
Download:
|
| Fig. 8.Typical amperometric responses of the PBNPs/PoPD/GCE to successive additions of H2O2 at applied potential of -0.1 V vs. SCE in 0.1 mol L-1 acetate buffer (pH 4). The inset shows the calibration curve derived from the current-time profiles. | |
|
|
Table 1 Comparison of several PB based H2O2 electrochemical sensors. |
In order to investigate the selectivity of the proposed sensor, the influence of common electroactive interferences such as ascorbic acid (AA), uric acid (UA) and dopamine (DA) during amperometric sensing of H2O2, was studied at the PBNPs/PoPD/GCE (figure not shown).We observed that these species had no significant effect on the amperometric response of H2O2. These results obviously demonstrate that this sensor has good selectivity, which was due to relatively low applied potential of the sensor. Also, a fouling efficacy related to these compounds was not observed and this electrode kept its activity when it was continuously used for H2O2 electrocatalysis alone or in the presence of some biological molecules.
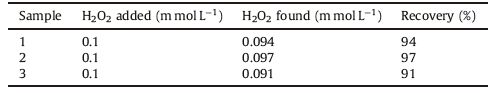
3.6. Real sample analysisOne of the important objectives of sensors is their capability in distinguishing related analytes in real samples. Hence, we appraised the real analytical usefulness of the PBNPs/PoPD/GCE by determination of H2O2 in an acid peroxide cream. The modified electrode was used in three samples of acid peroxide cream with equal concentration, which were diluted with 0.5 mol L-1 KNO3 (acetate buffer, pH 4) solution. Each experiment was done by the standard addition method. The average concentration obtained using this method was found to be 0.094 mmol L-1, which was compared with result obtained using the classical KMnO4 titration method, which was 0.1018 mmol L-1. To appraise the accuracy of this method in H2O2 determination, the percentage recovery values for the samples are shown in Table 2. Also, RSD% for this method was found to be 3.47.
|
|
Table 2 Recovery values for amperometric determination of H2O2 standard solution added to three acid peroxide cream samples using the proposed electrode. |
Reduplicative redox cycling experiments were done to specify the extent of stability relevant to PBNPs/PoPD/GCE in 0.5 mol L-1 KNO3 solution (pH 4, 0.1 mol L-1 acetate buffer). After 100 continuous cycles at 40 mV s-1, the peak height of the cyclic voltammograms did not show remarkable decrease. On the other hand, the PBNPs/PoPD/GCE kept its initial activity for more than 1 month when exposed in air at ambient temperature (a drift in current response was less than 4% at the end of the 30th day).
4. ConclusionA sensor for the simple and sensitive measurement of hydrogen peroxide in acidic media has been developed based on PBNPs/ PoPD/GCE. Prussian blue nanoparticles were synthesized from K3[Fe(CN)6] and Fe(NO3)3-9H2O by a self-assembly procedure. The regularly structured PBNPs increased the detection sensitivity of electrode. Electron transfer direction in solution is from H2O2 to the electrode, and provision of a regularly structured pathway for electron transport enhanced the detection efficiency of the modified electrode. The sensor also demonstrated excellent reproducibility (<5% RSD) in real sample analyses. The interferences of some oxidizable components are eliminated at a low working potential of -0.1 V vs. SCE, which provides more selectivity of the sensor for routine analysis.
AcknowledgmentThe authors wish to thank University of Mazandaran, Babolsar, for their support.
| [1] | H. Notsu, T. Tatsuma, A. Fujishima, Tyrosinase-modified boron-doped diamond electrodes for the determination of phenol derivatives, J. Electroanal. Chem. 523(2002) 86-92. |
| [2] | N.A. Choudhury, R.K. Raman, S. Sampath, A.K. Shukla, An alkaline direct borohydride fuel cellwith hydrogen peroxide as oxidant, J. Power Sources 143(2005) 1-8. |
| [3] | S. Hasegawa, K. Shimotani, K. Kishi, H. Watanabe, Electricity generation from decomposition of hydrogen peroxide, Electrochem. Solid State Lett. 8(2005) A119-A121. |
| [4] | M.D. Gouda, M.A. Kumar, M.S. Thacur, N.G. Karanth, Enhancement of operational stability of an enzyme biosensor for glucose and sucrose using protein based stabilizing agents, Biosens. Bioelectron. 17(2002) 503-507. |
| [5] | N.V. Klassen, D. Marchington, H.C.E. Mcgowan, H2O2 determination by the (Ⅰ)3-method and by KMnO4 titration, Anal. Chem. 66(1994) 2921-2925. |
| [6] | A.M. Almuaibed, A. Townshend, Flow spectrophotometric method for determination of hydrogen peroxide using a cation exchanger for preconcentration, Anal. Chim. Acta 295(1994) 159-163. |
| [7] | P.A. Tanner, A.Y.S. Wong, Spectrophotometric determination of hydrogen peroxide in rainwater, Anal. Chim. Acta 370(1998) 279-287. |
| [8] | (Ⅰ). Mori, T. Takasaki, Y. Fujita, T. Matsuo, Selective and sensitive fluorometric determinations of cobalt(Ⅱ) and hydrogen peroxide with fluorescein-hydrazide, Talanta 47(1998) 631-637. |
| [9] | R. Rapoport, (Ⅰ). Hanukoglu, D. Sklan, A Fluorometric Assay for hydrogen peroxide, suitable for NAD(P)H-dependent superoxide generating redox systems, Anal. Biochem. 218(1994) 309-313. |
| [10] | A.N. Díaz, M.C.R. Peinado, M.C.T. Minguez, Sol-gel horseradish peroxidase biosensor for hydrogen peroxide detection by chemiluminescence, Anal. Chim. Acta 363(1998) 221-227. |
| [11] | S. Effkemann, U. Pinkernell, U. Karst, Peroxide analysis in laundry detergents using liquid chromatography, Anal. Chim. Acta 363(1998) 97-103. |
| [12] | U. Pinkernell, S. Effkemann, U. Karst, Simultaneous HPLC determination of peroxyacetic acid and hydrogen peroxide, Anal. Chem. 69(1997) 3623-3627. |
| [13] | T.A. (Ⅰ)vandini, R. Sato, Y. Makide, A. Fujishima, Y. Einaga, Pt-implanted borondoped diamond electrodes and the application for electrochemical detection of hydrogen peroxide, Diam. Relat. Mater. 14(2005) 2133-2138. |
| [14] | P. Santhosh, K.M. Manesh, A. Gopalan, K.P. Lee, Fabrication of a new polyaniline grafted multi-wall carbon nanotube modified electrode and its application for electrochemical detection of hydrogen peroxide, Anal. Chim. Acta 575(2006) 32-38. |
| [15] | H.J. Buser, D. Schwarzenbach, W. Petter, A. Ludi, The crystal structure of Prussian Blue:Fe4[Fe(CN)6]3·xH2O, (Ⅰ)norg. Chem. 16(1977) 2704-2710. |
| [16] | P. Thornton, Chapter 3:the transition elements. Part Ⅲ. Groups VⅡA, VⅢA, and (Ⅰ)B, Annu. Rep. Prog. Chem. Sect. A:(Ⅰ)norg. Chem. 77(1980) 191-237. |
| [17] | R.C. Millward, C.E. Madden, (Ⅰ). Sutherland, et al., Directed assembly of multilayers-the case of Prussian Blue, Chem. Commun. 19(2001) 1994-1995. |
| [18] | K. Thenmozhi, S. Sriman Narayanan, Amperometric hydrogen peroxide sensor based on a sol-gel-derived ceramic carbon composite electrode with toluidine blue covalently immobilized using 3-aminopropyltrimethoxysilane, Anal. Bioanal. Chem. 387(2007) 1075-1082. |
| [19] | B.Q. Wang, B. Li, Z.X. Wang, et al., Sol-gel thin-film immobilized soybean peroxidase biosensor for the amperometric determination of hydrogen peroxide in acid medium, Anal. Chem. 71(1999) 1935-1939. |
| [20] | S.M. Golabi, A. Nozad, Electrocatalytic oxidation of methanol on electrodes modified by platinum microparticles dispersed into poly (o-phenylenediamine) film, J. Electroanal. Chem. 521(2002) 161-167. |
| [21] | A.B. Kharitonov, L. Alfonta, E. Katz, (Ⅰ). Willner, Probing of bioaffinity interactions at interfaces using impedance spectroscopy and chronopotentiometry, J. Electroanal. Chem. 487(2000) 133-141. |
| [22] | B.J. Feldman, R.W. Murray, Electron diffusion in wet and dry Prussian blue films on interdigitated array electrodes, (Ⅰ)norg. Chem. 26(1987) 1702-1708. |
| [23] | J. Wang, Analytical Electrochemistry, VCH, New York, 1999. |
| [24] | R.S. Nicholson, (Ⅰ). Shain, Theory of stationary electrode polarography. Single scan and cyclic methods applied to reversible, irreversible, and kinetic systems, Anal. Chem. 36(1964) 706-723. |
| [25] | F. Ricci, C. Goncalves, A. Amine, et al., Electroanalytical study of Prussian blue modified glassy carbon paste electrodes, Electroanalysis 15(2003) 1204-1211. |
| [26] | Y. Liu, Z.Y. Chu, W.Q. Jin, A sensitivity-controlled hydrogen peroxide sensor based on self-assembled Prussian Blue modified electrode, Electrochem. Commun. 11(2009) 484-487. |
| [27] | K.S. Tseng, L.C. Chen, K.C. Ho, Amperometric detection of hydrogen peroxide at a Prussian Blue-modified FTO electrode, Sens. Actuators B:Chem. 108(2005) 738-745. |
| [28] | L. Qian, X.R. Yang, Assembly of Prussian blue onto SiO2 nanoparticles and carbon nanotubes by electrostatic interaction, Colloids Surf. A:Physicochem. Eng. Asp. 278(2006) 123-128. |