 2015, Vol.26


bSchool of Nuclear Science and Technology, Lanzhou University, Lanzhou 730000, China
The interfacial chemistry of salt solutions plays important roles in numerous atmospheric,geochemical and biological processes. Simple inorganic ions can enhance the reactions of the gaseous molecules at the outmost layer of the aqueous salt particles [1], alter the electrostatic fields at the mineral surfaces [2, 3],and regulate the secondary structures of the proteins [4]. Among the variety of surface analysis tools,sum frequency generation vibrational spectroscopy (SFG-VS) has drawn particular attentions owing to its intrinsic surface selectivity [3, 5, 6, 7, 8, 9, 10, 11]. By comparing the SFG-VS spectra obtained before and after adding the salts,one can deduce the structures of the interfacial hydrogen bond network, the surface propensities of ions [7, 8, 9, 10, 12, 13],and the nature of the electrical double layers near the charged surfaces [2, 3, 14, 15].
With the growing number of SFG-VS studies on the salt solution interfaces,the quantitative interpretation of the spectra has become increasingly important. In the SFG-VS data analysis,the refractive indices are crucial parameters determining the magnitude of the local electric fields at the interfaces in relation to the incident laser fields [5, 16]. Most previous SFG data treatments used a constant refractive index for different salt concentrations because the refractive indices only vary by a few percentages when salt concentration increases [13]. However,in a recent report comparing the water structures at different solid/aqueous interfaces,it was demonstrated that the local electric field correction can sometimes differ significantly even with a small change of bulk refractive indices [15].
It is therefore necessary to examine the potential influence of refractive indices on the SFG intensity measurements in order to reevaluate the accuracy of the quantitative results. By simulating the local field corrections,we aim to generalize the circumstances under which the small variations of the refractive index can cause the significant impact on SFG-VS intensities. Different experimental scenarios,including the types of bulk media,the laser incident angles and polarizations,were considered. The effect of the IR dispersions has been thoroughly discussed in literature and will not be covered in this work [5, 13, 15, 17]. The influence of refractive indices on the SFG-VS intensities as discussed here can be used as a rule of thumb for any other liquid mixtures of which the refractive index varies with the bulk concentrations.
2. Theoretical backgroundIn a SFG-VS process,an infrared (IR) photon with the frequency
of ωIR is upconverted by a visible photon with the frequency of ωvis,
resulting in the emission of a new photon with the sum frequency
ωSF = ωIR + ωvis. The SFG intensity is proportional to the square of
the effective second order susceptibility  [5, 11, 16],while χeff(2) for an achiral and rotationally isotropic
interface can be expressed by the macroscopic susceptibilities χijk(2)
(i = x,y,z) through [5, 16]:
[5, 11, 16],while χeff(2) for an achiral and rotationally isotropic
interface can be expressed by the macroscopic susceptibilities χijk(2)
(i = x,y,z) through [5, 16]:

For the ease of discussions,we define a coefficient Fijk to represent the product of all the Fresnel factors Lii as well as the sines and cosines in front of the χijk(2) (i,j,k = x,y,z) term (Eq. (1)). The Fijk coefficient carries all the information of the refractive indices,laser incident angles and polarizations. On the other hand, the molecular information is imbedded in the χijk(2) term,which is determined by the microscopic hyperpolarizability tensors and average tilting angles of the interfacial molecules and has nothing to do with the refractive indices [5, 11, 16].
3. Results and discussionAs shown in Eq. (1),the contributions from the refractive indices are all contained in the Fijk coefficients and readily to be separated from the χijk(2) terms. Therefore,to find out whether it is necessary to correct the SFG intensity (ISF) when the refractive indices change with the salt concentrations,one only needs to look into the dependence of Fijk on n2. In this context,we simulated Fijk for both the typical air/liquid and solid/liquid interfaces. We used 5 mol/L NaCl solution as the model system of the salt solutions and compared the simulated Fijk values (represented by Fijk (NaCl)) with those for the pure water (represented by Fijk (H2O)). Since the refractive indices for the 5 mol/L NaCl solution are among the typical values for the concentrated aqueous salt solutions,the results obtained here can generally be used for other similar solutions.
Most of the SFG-VS studies explored the O-H stretching vibrations between 3000 and 3800 cm-1 [2, 3, 6, 7, 8, 9, 10, 12, 13, 14, 15, 18]. Thus during the simulations we first chose the IR wavelength to be 3400 cm-1,which is at the center of this vibrational region and nearby a typical SFG peak often assigned to the ‘‘liquid-like’’ water molecules [2, 7]. The visible wavelength was chosen to be 532 nm,a commonly employed visible wavelength in the SFG experiments.
Since the IR refractive indices contain imaginary parts,Fijk is a complex number. For the ssp,sps and pss polarizations,only one χijk(2) term is involved (Eq. (1)) [5, 16]. Consequently the absolute values |Fyyz| are sufficient enough to evaluate the changes of |χ eff (2)| as a function of n2 in the ssp,sps and pss spectra. For the ppp polarization,the spectral shape is determined by the interference of four χijk(2) terms (Eq. (1)) [5]. Therefore the phase term in each of the four Fijk factors plays a role in the ppp intensity and it is difficult to draw a general conclusion. But as discussed below,we still can obtain some qualitative predictions by simulating the individual |Fijk| for each of the four χijk(2) terms in the ppp polarizations.
We first considered the air/liquid interfaces. Fig. 1a and b illustrate the simulated |Fijk(H2O)| and |Fijk( NaCl)| for the air/liquid interface as a function of the visible incident angle βvis. During the simulation,the IR incident angle βIR was fixed to 588,which is in the range of the commonly used βIR values. The Fyyz and Fyzy in Fig. 1a correspond to the ssp and sps polarizations,respectively, while the Fxxz,Fxzx,Fzxx and Fzzz in Fig. 1b are for the four independent χijk(2) termsinthe ppppolarization.The psspolarization yields similar spectra as sps,therefore will not be discussed.

|
Download:
|
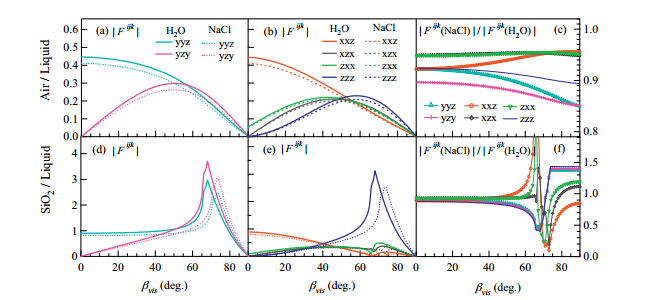
| Fig. 1. The left and middle columns: |Fijk| as a function of βvis at (a) and (b) the air/liquid interface; (d) and (e) the fused silica/liquid interface. The solid lines are for the pure water and the dotted lines are for the 5 mol/L NaCl solutions. The right columns: |Fijk(NaCl)|/|Fijk(H2O)| ratios vs. βvis at (c) the air/liquid and (f) fused silica/liquid interfaces. | |
The change of n2 caused by the increasing salt concentrations indeed plays an important role in the observed ISF. Fig. 1a and b shows that |Fijk(H2O)| is always larger than |Fijk(NaCl)| at the air/liquid interface,indicating that |Fijk| decreases when the salt concentration and n2 increase. To better illustrate this difference between the salty and unsalted solutions,the ratios of |Fijk(NaCl)| =|Fijk(H2O)| were plotted as a function of βvis in Fig. 1c. It can be seen that the influence of the n2 on the ssp and sps intensities is more evident at the larger visible incident angle because |Fijk(NaCl)| =|Fijk(H2O)| decreases with the increasing βvis for these two polarizations. At especially large βvis closes to the grazing angle,the |Fijk(NaCl)|/|Fijk(H2O)| ratios for ssp and sps can be as low as 85%. Most of the SFG-VS spectra at the air/aqueous interfaces were taken in the ssp polarization and with βvis between 358 and 658 [5]. According to Fig. 1c,typically a ~10% drop in |Fsspyyz| is anticipated under these conditions when the liquid changes from the pure water to 5 mol/L NaCl solution. This means that |χeff,ssp(2)| is ~10% smaller if one uses the same n2 of the pure water for the 5 mol/L NaCl solution. In other words,χyyz(2) at the air/liquid interface could be underestimated by ~10%,corresponding to a ~20% drop in ISF because the observed ISF,ssp is proportional to the square of |χeff,ssp(2)| [5, 11]. This difference is not as negligible as previously thought [13]. For sps,the influence of n2 on |Fspsyzy| is more significant than that of ssp. But in general,the |Fijk| factors of ssp and sps have similar responses to the changing n2.
The case of ppp is more complicated. Fig. 1b and c shows that at the air/liquid interface,n2 has a smaller influence on the four ppp|Fijk| values than those of the ssp and sps,because the |Fijk(NaCl)|/|Fijk(H2O)| ratios for the four ppp tensors are larger than those for the yyz and yzy tensors. When βvis increases, |Fijk(NaCl)|/|Fijk(H2O)| decreases for the zzz tensor,increases for the xxz tensor,and only slightly changes for the xzx and zxx tensors. Because the n2-response is different for the four Fijk factors,the interference among the four χijk(2) terms changes with n2,causing the possible variations of the ppp spectral shape. Nevertheless,it is known that the ppp intensity for the hydrogen bonded water molecules at the air/water interface is usually small and people have traditionally paid more attention to the ssp spectra. Thus the influence of n2 on the ppp intensity and spectral shape may be more important on the solid/liquid interfaces as discussed below.
Fig. 1d-1f shows the dependence of the |Fijk(H2O)|,|Fijk(NaCl)| , and the |Fijk(NaCl)|/|Fijk(H2O)| ratios on βvis for the fused silica (SiO2)/aqueous interface. The SiO2/aqueous interface has been extensively used as the model system to investigate the mineralwater interactions [3, 15]. Because n1 is greater than n2 for the solid/aqueous interfaces,most of the Fresnel factors for the solid/ aqueous interfaces are larger than those of the air/aqueous interfaces,especially when βIR and βvis approach the critical angles of the total internal reflections (TIR). This results in a significant enhancement of the recorded ISF. However,York et al. suggested the IR incident angle βIR to be away from the critical angle in order to minimize the IR dispersions [17]. Therefore during the simulations,we fixed the βIR at 588,a few degrees smaller than the critical angle.
A couple of the points shall be noted in Fig. 1d and e. First,the |Fzzz| is much larger than the other three |Fijk| factors in ppp when βvis is close to the critical angles (Fig. 1e),indicating that χzzz (2) is the dominant one among the four pppχijk(2) terms near TIR. Second,|Fijk| curves beyond the critical angle are no longer monotonic. Particularly,|Fyyz|,|Fyzy|,and |Fzzz| all decrease with the increasing βvis when βvis is larger than the critical angle. As a result,although most of the SFG-VS experiments on the solid/liquid interfaces attempted to utilize the signal enhancement at TIR [3, 14, 17],βvis is not recommended to be larger than the critical angle.
As seen from Fig. 1d-f,the change of n2 has much more dramatic effect on the SFG-VS spectra for the solid/liquid interfaces compared with the air/liquid interfaces. In addition,the influence of n2 increases rapidly when βvis approaches the critical angles, indicating the correction of ISF by n2 is more necessary near TIR. In the ssp and sps polarizations,the |Fijk(NaCl)|/|Fijk(H2O)| ratios are always smaller than 1 and can be as low as ~45% when βvis reaches the critical angles (Fig. 1f),showing a strong dependence of Fijk on n2. Because ISF is proportional to the square of |χeff (2)|,a ~45% drop in jFyyzj will cause a ~80% reduction in ISF for the ssp polarization. In the case of the ppp polarization,the Fijk terms at the SiO2/liquid interfaces are also more sensitive to n2 than those at the air/liquid interfaces. The |Fijk(NaCl)|/|Fijk(H2O)| curves for the zzz tensor are almost identical to those of the yyz tensor in the ssp polarization and of the yzy tensor in the sps polarization,also approaching 45% when βvis reaches the critical angles. On the contrary, |Fijk(NaCl)| =|Fijk(H2O)| ratios for the xxz and zxx tensors show completely different n2-dependence. With the small βvis, |Fijk(NaCl)| is slightly smaller than |Fijk(H2O)| for xxz and zxx, similar to the other Fijk factors. But when βvis increases toward the critical angles,|Fijk(NaCl)| factors for xxz and zxx becomes evidently larger than |Fijk(H2O)|.
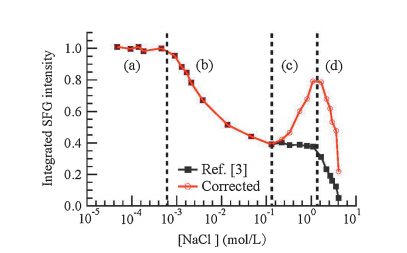
Fig. 1f shows the extremely strong dependence of |Fijk| on n2 at the solid/liquid interfaces. As a result,the correction of ISF is of vital importance at the SiO2/liquid interface,especially when we try to use ISF to quantitatively evaluate the surface charge,the thickness of the interfacial layer,or the surface adsorption isotherm. Hore and coworkers recently showed the response of ISF to the increasing [NaCl] at SiO2/aqueous interface [3]. As shown in Fig. 2,four distinct [NaCl] regions were identified according to the ssp intensity for the O-H stretching vibrations. These four regions were attributed to the combining effects of the surface charges,the screening of the surface DC field by the vicinity counter ions,and the disruption of the hydrogen bond network by the salts. But the influence of the n2 was not taken into account in Hore’s original work,raising the questions about the accuracy of the data. In Fig. 2, we reprocessed Hore’s data and corrected the ISF values by considering the changes of n2 at different ionic strength (open circles in Fig. 2). For the ease of the data treatment,during corrections we used the IR wavelength of 3200 cm-1,nearby the most intense peak at the SiO2/aqueous interface.

|
Download:
|
| Fig. 2. ISF vs. [NaCl] at the SiO2/aqueous interface. The solid squares represent the experimental data from Ref. [3] before the correction by n2. The open circles represent the same data after the correction by n2. | |
It is known that at the charged surface such as the SiO2/salty solution interface,both χ(2) andχ(3) terms contribute to the observed SFG intensities. Therefore the dependence of the χ(3) intensity on n2 has also to be considered. For ssp,x(3) consists of two tensors,yyz and yyx. As illustrated by Fig. S1 in Supporting information,the |Fijk(NaCl)|/|Fijk(H2O)| ratios for yyz and yyx are almost identical near TIR,indicatingχ(3) andχ(2) have the same n2- dependence at the experimental condition used by Ref. [3]. Other factors to be considered for the solid/liquid include the Debye length and coherent length. The former is linearly proportional to n2,therefore only changes by a few percentages compared with the values calculated without considering the variation of n2. The coherent length changes more significantly,but is always ordersof-magnitude larger than the Debye length (a few nanometers) and the interfacial thickness within which the SFG signals actually respond (a few molecular layers) [19]. Consequently,the n2- dependence of coherent length and Debye length do not affect the correction of ISF as discussed here.
The correction of overall ISF in Fig. 2 has thus included the contributions from both χ(2) and χ(3). The daunting difference was observed for the corrected ISF at [NaCl] > 0.1 mol/L. In Hore’s original work,a plateau between 0.1 mol/L and 1 mol/L [NaCl] was assigned to the transition from the Gouy-Chapman model to the Stern model during which the surface potential remained unchanged [3]. But after the correction by n2,the plateau in "region c" no longer exists. Instead,the corrected ISF rises when [NaCl] increases from 0.1 mol/L to 1 mol/L (open circles in Fig. 2), implying a dramatically different mechanism in this region. This increasing ISF in "region c" might be in coincidence with the recent ultrafast dynamics measurement at the same SiO2/water interface in which a faster dynamics at higher [NaCl] was suggested to be related to the larger electrical field and consequently more ordered water structures as [NaCl] increases [19]. With [NaCl] > 1 mol/L ("region d"),the corrected ISF rapidly drops,but is still much higher than the uncorrected values at the same [NaCl]. Thus in the "region d",the interruption of the water hydrogen bond network by the concentrated ions is probable to be less severe as the raw SFG data indicated. With [NaCl] < 0.1 mol/L,the insignificant change of n2 is not enough to cause any observable differences (regions a and b in Fig. 2). In summary,the correction of ISF by n2 is absolutely necessary for the concentrated salt solutions and a new physical model is needed to explain the corrected SFG curves at the SiO2/ aqueous interface.
The ppp intensity as a function of n2 is also more important at the solid/liquid interfaces than the air/liquid interfaces. Although the ppp polarization has not been commonly employed in the SFGVS studies on the solid/aqueous salty solution interfaces,we found in our recent experiments that it is possible for the ppp spectra to have the comparable intensities as the ssp spectra when βvis is close to the critical angles. As a result the ppp spectra can potentially be used together with the ssp spectra to understand the surface water structures at the solid/aqueous interfaces. In this context,it is also worthwhile to evaluate the dependence of the ppp spectral intensity on n2. Though the four |Fijk| terms have different n2-dependences,the change of |Fzzz| at the solid/liquid interfaces might be more dominant near TIR due to the especially large jFzzzj values (Fig. 1e). Thus near TIR geometry that has been commonly employed in the SFG-VS studies on the solid/liquid interfaces,we can qualitatively predict that the dependence of the ppp intensity on n2 is more similar to jFzzzj than other three |Fijk| terms.
As discussed above,the same dependence of |Fijk| on n2 at the air/liquid interface is less obvious than that at the solid/liquid interface. However,it is still sometimes necessary to correct the measured ISF by n2,especially when one plans to use ISF to quantitatively obtain an accurate interfacial adsorption isotherm as a function of the salt concentrations [8]. Accordingly,the Gibbs adsorption free energy,which is usually obtained through the curve fitting of adsorption isotherms,is also possibly subject to the similar corrections.
Last but not the least,the change of n2 can potentially affect the orientational analysis in the SFG studies. The tilting angles of the interfacial molecules are often calculated by comparing the ssp and ppp intensities for the same vibrational mode [5, 18]. Since ISF at different polarizations responds differently to n2,one has to take cautions to compare the interfacial molecular orientations at different salt concentrations. The detailed role of n2 played in the SFG orientational analysis,however,is beyond the scope of this article and will be presented in a separate paper.
4. ConclusionIn summary,the simulation results demonstrate that the ssp and sps intensities for both the solid/liquid and air/liquid interfaces of concentrated salt solutions would be underestimated if one uses the same n2 value for the salt solutions and the pure water. The ppp spectral shapes and intensities are also possible to change accordingly when the salt solution becomes highly concentrated. It was found that ISF at the solid/liquid interface is much more sensitive to n2 than that at the air/liquid interface. In addition,the dependence of ISF on n2 changes with the laser incident angles. At the air/liquid interface,ISF is more sensitive to the n2 variation at the larger visible laser incident angles; while at the solid/liquid interface,the maximum n2 sensitivity of ISF occurs near the critical angles for the total internal reflections. Some important SFG results on the concentrated salt solutions therefore need to be reevaluated. The simulations used here are readily to be extended to other liquid mixtures of which n2 changes with the bulk concentrations. This study also provides an important example showing that we have to be extremely cautious when quantitatively interpreting the SFG-VS data.
AcknowledgmentThis work was financially supported by the National Natural Science Foundation of China (Nos. 21227802,21303216 and 21473217).
Appendix A. Supplementary dataSupplementary data associated with this article can be found,in the online version,at http://dx.doi.org/10.1016/j.cclet.2015.10.020.
| [1] | E.M. Knipping, M.J. Lakin, K.L. Foster, et al., Experiments and simulations of ionenhanced interfacial chemistry on aqueous NaCl aerosols, Science 288 (2000) 301-306. |
| [2] | Q. Du, E. Freysz, Y.R. Shen, Vibrational-spectra of water-molecules at quartz water interfaces, Phys. Rev. Lett. 72 (1994) 238-241. |
| [3] | K.C. Jena, P.A. Covert, D.K. Hore, The effect of salt on the water structure at a charged solid surface: differentiating second- and third-order nonlinear contributions, J. Phys. Chem. Lett. 2 (2011) 1056-1061. |
| [4] | Y. Zhang, P.S. Cremer, Chemistry of Hofmeister anions and osmolytes, Annu. Rev. Phys. Chem. 61 (2010) 63-83. |
| [5] | H.F. Wang, W. Gan, R. Lu, et al., Quantitative spectral and orientational analysis in surface sum frequency generation vibrational spectroscopy (SFG-VS), Int. Rev. Phys. Chem. 24 (2005) 191-256. |
| [6] | Q. Du, E. Freysz, Y.R. Shen, Surface vibrational spectroscopic studies of hydrogenbonding and hydrophobicity, Science 264 (1994) 826-828. |
| [7] | D.F. Liu, G. Ma, L.M. Levering, et al., Vibrational spectroscopy of aqueous sodium halide solutions and air-liquid interfaces: observation of increased interfacial depth, J. Phys. Chem. B 108 (2004) 2252-2260. |
| [8] | X. Chen, T. Yang, S. Kataoka, et al., Specific ion effects on interfacial water structure near macromolecules, J. Am. Chem. Soc. 129 (2007) 12272-12279. |
| [9] | R.R. Feng, H.T. Bian, Y. Guo, et al., Spectroscopic evidence for the specific Na+ and K+ interactions with the hydrogen-bonded water molecules at the electrolyte aqueous solution surfaces, J. Chem. Phys. 130 (2009) 134710. |
| [10] | C.S. Tian, S.J. Byrnes, H.L. Han, et al., Surface propensities of atmospherically relevant ions in salt solutions revealed by phase-sensitive sum frequency vibrational spectroscopy, J. Phys. Chem. Lett. 2 (2011) 1946-1949. |
| [11] | Y.R. Shen, Surface spectroscopy by nonlinear optics, in: T.W. Hansch, M. Inguscio (Eds.), Frontiers in Laser Spectroscopy, Elsevier Science Publ. B. V., Amsterdam, 1994, pp. 139-165. |
| [12] | E.A. Raymond, G.L. Richmond, Probing the molecular structure and bonding of the surface of aqueous salt solutions, J. Phys. Chem. B 108 (2004) 5051-5059. |
| [13] | M. Xu, R. Spinney, H.C. Allen, Water structure at the air-aqueous interface of divalent cation and nitrate solutions, J. Phys. Chem. B 113 (2009) 4102-4110. |
| [14] | K.C. Jena, D.K. Hore, Variation of ionic strength reveals the interfacial water structure at a charged mineral surface, J. Phys. Chem. C 113 (2009) 15364-15372. |
| [15] | P.A. Covert, K.C. Jena, D.K. Hore, Throwing salt into the mix: altering interfacial water structure by electrolyte addition, J. Phys. Chem. Lett. 5 (2014) 143-148. |
| [16] | X. Zhuang, P.B. Miranda, D. Kim, et al., Mapping molecular orientation and conformation at interfaces by surface nonlinear optics, Phys. Rev. B: Condens. Matter 59 (1999) 12632-12640. |
| [17] | R.L. York, Y. Li, G.J. Holinga, et al., Sum frequency generation vibrational spectra: the influence of experimental geometry for an absorptive medium or media, J. Phys. Chem. A 113 (2009) 2768-2774. |
| [18] | R.R. Feng, Y. Guo, H.F. Wang, Reorientation of the “free OH” group in the topmost layer of air/water interface of sodium fluoride aqueous solution probed with sum-frequency generation vibrational spectroscopy, J. Chem. Phys. 141 (2014) 18C507. |
| [19] | A. Eftekhari-Bafrooei, E. Borguet, Effect of electric fields on the ultrafast vibrational relaxation of water at a charged solid-liquid interface as probed by vibrational sum frequency generation, J. Phys. Chem. Lett. 2 (2011) 1353-1358. |