 2015, Vol.26


b Institute of Biological Technology, College of Life and Health Sciences, Northeastern University, Shenyang 110169, China
Metal-organic frameworks (MOFs) are a class of crystallized porous polymeric materials formed by the coordination of metal ions/clusters and organic bridging ligands [1]. Owing to different crystal structures,pore sizes and surface chemistry,MOFs have been applied on molecule storage/separation,catalysis,biological imaging/drug delivery,and electrical sensors/fuel cells [2, 3, 4, 5]. The performance of MOFs on the separation of biomolecules has been evaluated by several groups. The first enrichment of peptides and simultaneous exclusion of proteins with MOF was reported by Yan et al. [6]. Er(III) based MOF,amino-functionalized MOF,core-shell magnetic MOF were subsequently synthesized and used as affinity materials for the selective capture of phosphopeptides,glycopeptides and low-abundance peptides [7, 8, 9]. A zeolitic imidazolate framework-8 coated magnetic nanocomposite exhibits favorable retention for histidine-rich proteins [10]. A graphene oxide- lanthanide MOF composite is demonstrated by the selective adsorption of hemoglobin from human whole blood [11]. In brief, the MOFs show great potential on the separation and enrichment of peptides/proteins from complex biological samples.
However,the fragileness of the ligands in MOFs greatly restricts their development and application. Especially,the MOFs synthesized at low temperature exhibit low thermal or chemical stability [12]. The lanthanide MOFs suffer from similar shortcomings and thus yttrium ions (Y3+) are generally used as matrices to improve the rigidity of the composite [13]. Most reported applications of lanthanide MOFs and their derivatives are focused on fluorescent sensing,while they are rarely applied in the adsorption and separation of proteins.
In the present study,we have studied the interactions between protein species and metal-organic frameworks (MOFs) Y(BTC)(H2O)6. It is demonstrated that Y(BTC)(H2O)6 exhibits favorable selective adsorption behavior for hemoglobin by following Langmuir adsorption model. The MOFs framework is further exploited for the adsorption and isolation of hemoglobin from real biological sample matrix,i.e.,human whole blood.
2. Experimental 2.1. InstrumentationFT-IR spectra are taken using a Nicolet-6700 FT-IR spectrophotometer (Thermo,USA). TGA analysis is conducted under a nitrogen atmosphere using a TGA/DSC 1 Stare System (Mettler- Toledo,Switzerland) thermogravimetric analyzer. The morphologies and structures of the products examined by SEM (SSX-550, Shimadzu,Japan). XRD patterns are recorded on an X0 Pert Pro MPD X-ray diffractometer (PW 3040/60,PANalytical B. V.,Holland) with Cu-Kα irradiation (λ= 1.5406Å ) in the range of 2θ from 5 to 60°. The nitrogen adsorption-desorption isotherms are obtained at -196 °C using a BK132F Instrument (Beijing JWGB Sci.&Tech. Co., Ltd.,China). UV-vis absorption spectra are recorded on a T6 UV-vis spectrophotometer (Purkinje General Instruments,Beijing,China) with a 1.0 cm quartz cuvette at room temperature (293 K). Circular dichroism (CD) spectra are obtained on an MOS-450 (Bio-Logic, France) automatic recording spectropolarimeter at 293 K in a wavelength range of 190-240 nm. The spectra are recorded with nitrogen protection using 1 mm cell length with a scan rate of 200 nm min-1.
2.2. ChemicalsY(NO3)3·6H2O,1,3,5-benzenetricarboxylic acid (H3BTC) are purchased fromSinopharmChemicalReagent Co. (Shenyang,China) and used as received. Hemoglobin (Hb,H7379,pI 6.9) and albumin from human serum (HSA,A9511,pI 4.9) are purchased from Sigma (St. Louis,MO) and used without further purification. Other chemicals employed are at least of analytical reagent grade. Deionized water of 18Ωcm-1 is used throughout the experiments.
2.3. The preparation of Y(BTC)(H2O)6Y(BTC)(H2O)6 was prepared following a previously reported procedure [14]. Briefly,5 mmol of Y(NO3)3·6H2O and 5 mmol of H3BTC were dissolved,respectively,in 30 mL and 20 mL of water- ethanol mixture (v/v = 1:2) with magnetic stirring. The H3BTC solution was added to the Y(NO3)3·6H2O solution at room temperature. The mixture was further vigorously stirred for 30 min. The product was collected by centrifugation,washed for six times with water and ethanol alternately. The product (termed as Y(BTC)(H2O)6) was finally dried in the oven at 50 °C.
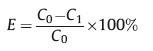
2.4. Protein adsorption and desorptionY(BTC)(H2O)6 (0.4 mg) was used for the extraction of proteins in 1 mL aqueous solution (within a range of 15-100 μgmL-1 ) in a 1.5 mL centrifuge tube. The mixture was shaken vigorously for 15 min to facilitate protein adsorption,followed by phase separation with centrifugation for 5 min at 8000 rpm. The concentration of proteins in the aqueous phase before and after adsorption is obtained by measuring the absorbance at their characteristic absorption wavelengths (408 nm for Hb,280 nm for HSA) with a UV-vis spectrophotometer. The adsorption efficiency (E) is thus calculated according to the following equation,where C0 stands for the original concentration of a protein species in the aqueous solution (μg mL-1),while C1 represents the concentration of the protein after adsorption.
The protein desorption is performed using SDS (0.5%,m/v) as a stripping reagent. The desorption efficiency (E') is calculated by the following equation,with C2 as the protein concentration after desorption.

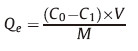
Different initial concentrations of Hb (30-300 μgmL-1) in1mL of disodium hydrogen phosphate-citric acid buffer (pH 6.0) are treated by 0.4 mg of Y(BTC)(H2O)6 for 15 min. Then the adsorption capacity (Qe,mg g-1) of Y(BTC)(H2O)6 is calculated according to the following equation,with V as the sample volume (mL),and M as the mass of the ad sorbent (mg).
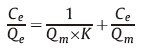
The adsorption behavior of Hb by the Y(BTC)(H2O)6 fits the Langmuir adsorption model,characterized by the following equation,where Ce is the equilibrium concentration of Hb,Qm is the theoretical maximum adsorption capacity,and K is the adsorption equilibrium constant.
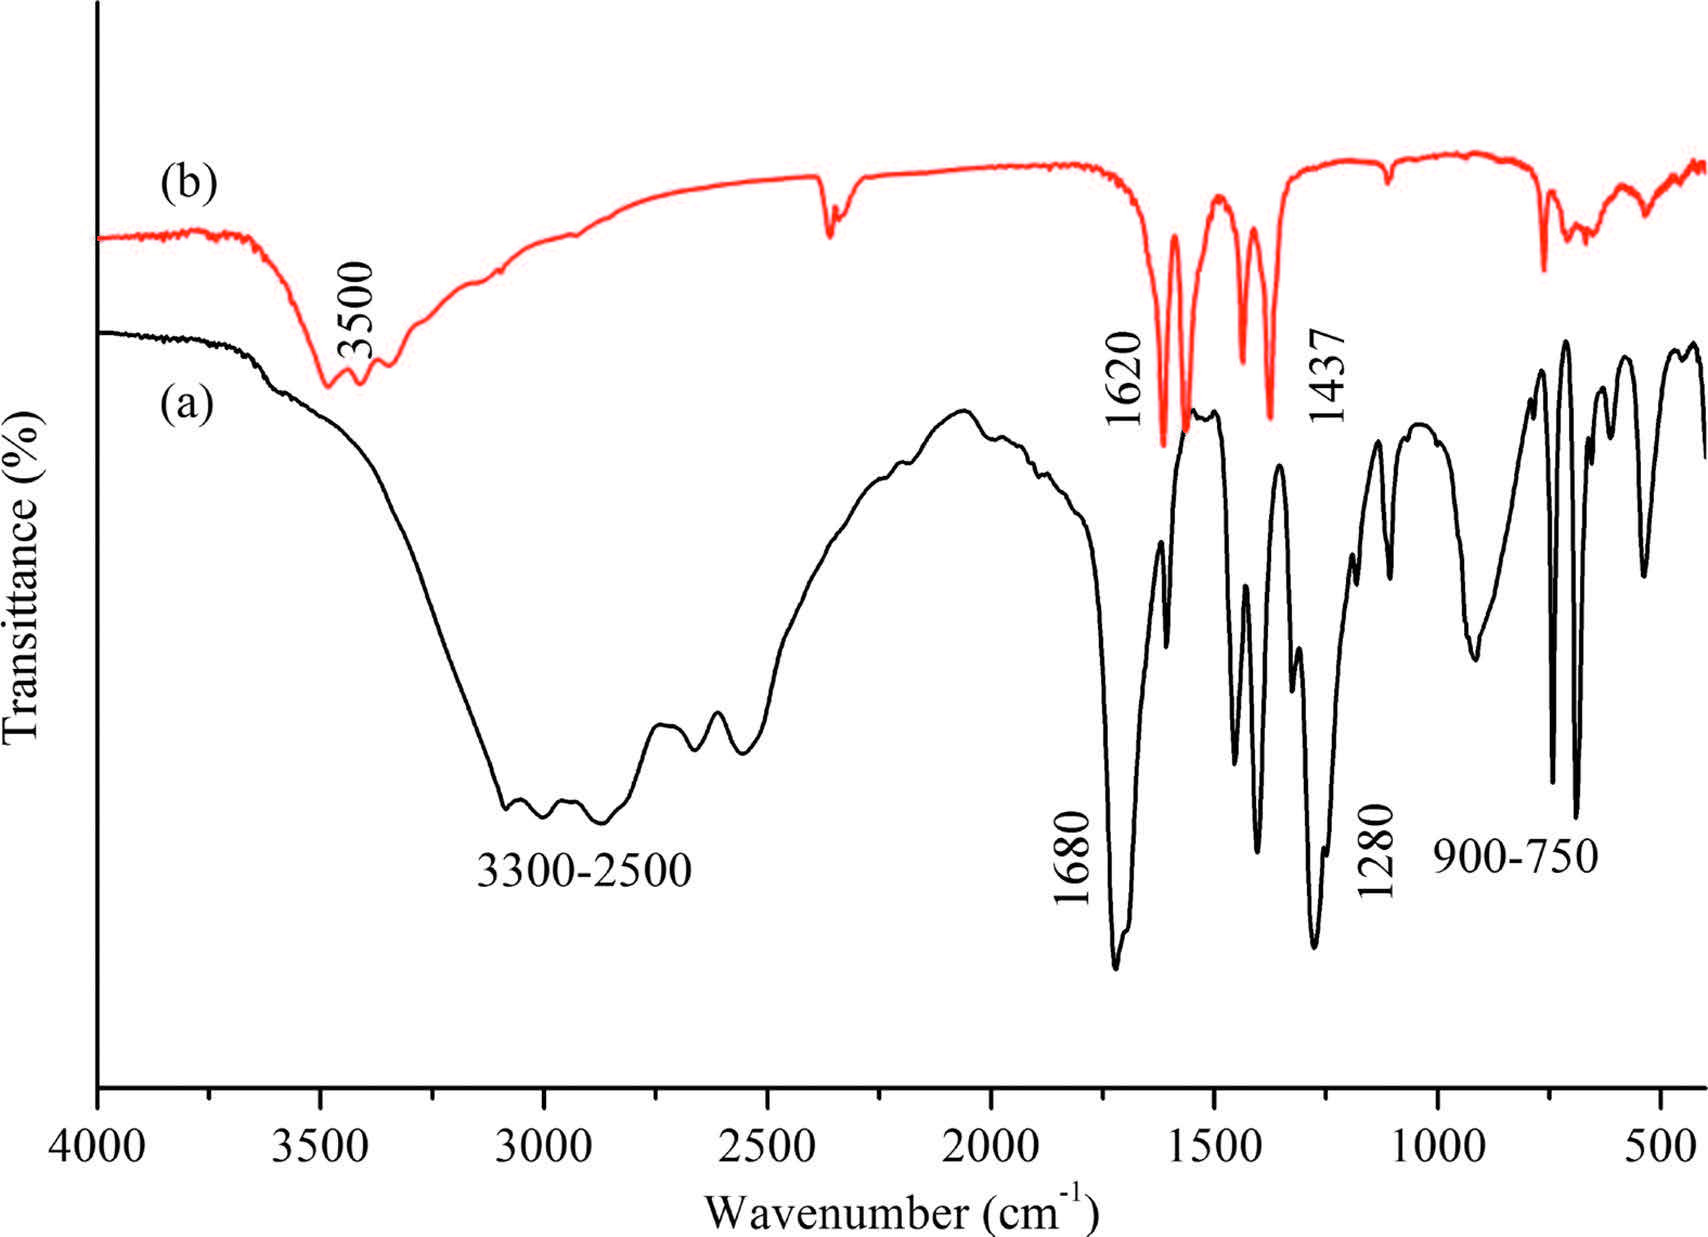
FT-IR spectrum of H3BTC is illustrated in Fig. 1 (curve a),the absorption bands at 1680 cm-1 and 1280 cm-1 are attributed to the stretching vibration of C=O bond of the carboxylate moieties (νO-H). The bands appear at 3300-2500 cm-1 are assigned to the stretching vibrations of O-H bonds (νC-O). The sharp peak at 900- 750 cm-1 attributing to the bending vibration of O-H bond is also observed (σO-H) [15]. FT-IR spectrum of Y(BTC)(H2O)6 illustrated in Fig. 1 (curve b) shows the disappearance of the typical absorption bands of νO-H,νC-O,σO-H for H3BTC. Two bands at 1620 cm-1 and 1437 cm-1 are identified,which are assigned to the asymmetric stretching vibration,symmetric stretching vibration of carboxylate moieties,respectively [14]. The Δ ν= 183 cm-1 < 200 cm-1 indicates that the coordination mode of H3BTC and Y3+ is chelating bidentate or bridging bidentate [16].

|
Download:
|
| Fig. 1.FT-IR spectra of (a) H3BTC and (b) Y(BTC)(H2O)6. | |
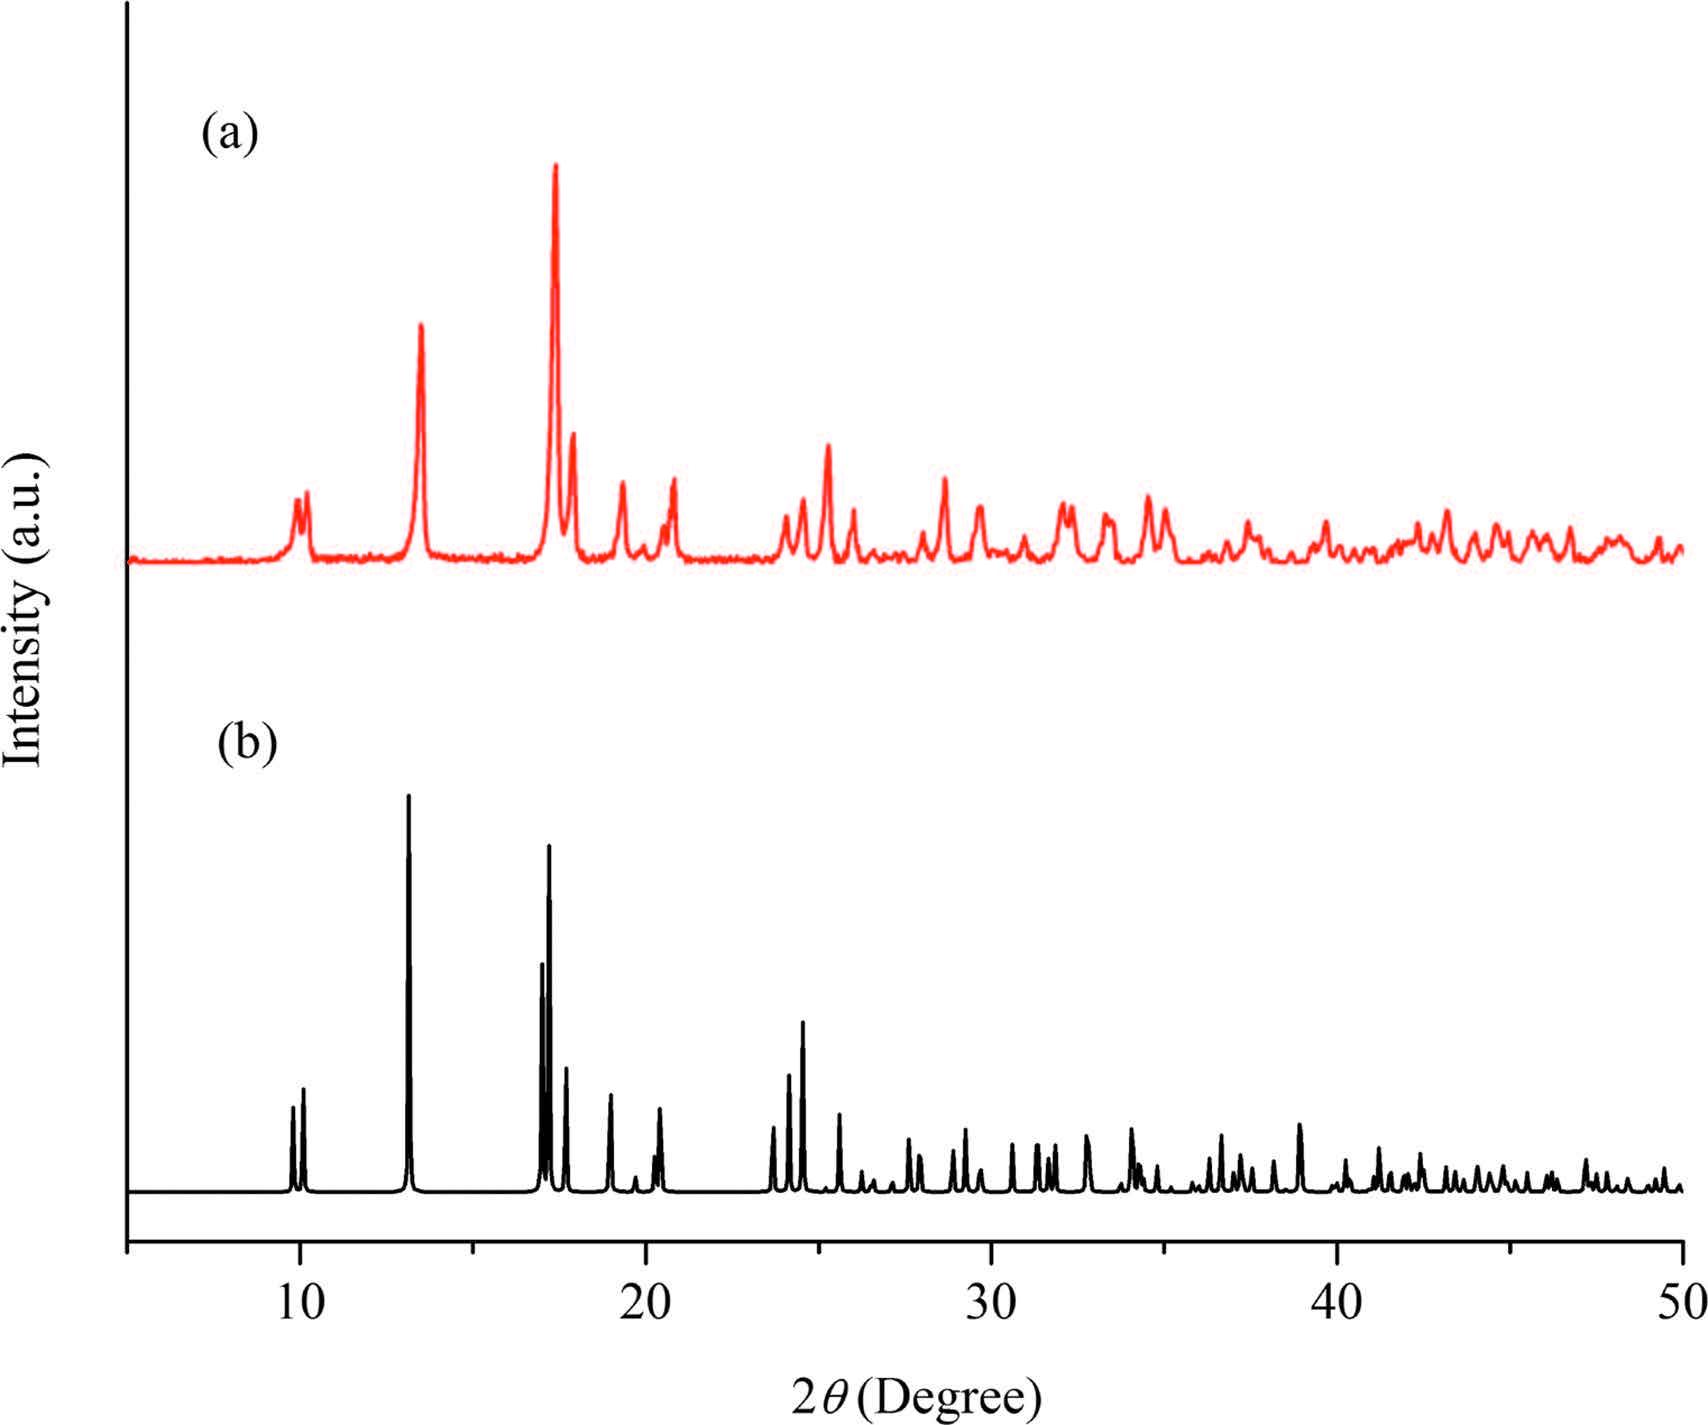
The chemical composition and crystal structure of Y(BTC)(H2O)6 are elucidated by XRD patterns as illustrated in Fig. 2 (curve a). The strong and narrow diffraction peaks indicate that the products are high-quality crystalline MOF samples. The observed XRD patterns in the present case can be indexed to the bulk phase of La(BTC)(H2O)6 (CCDC: 290071) (curve b) [17]. On the other hand,the XRD pattern of Y(BTC)(H2O)6 is similar to those obtained for another lanthanide MOF (Ln(BTC)(H2O)6) prepared with a same method at room temperature [14]. The yttrium-based MOF (Y(BTC)(H2O)·4.3H2O) synthesized by a solvothermal reaction has been reported elsewhere [18]. However,the XRD pattern of Y(BTC)(H2O)6 is different from that of Y(BTC)(H2O)·4.3H2O. The observations herein demonstrate that the reaction conditions have significant effects on the crystal structure of formed lanthanide MOFs.

|
Download:
|
| Fig. 2.XRD patterns of (a) Y(BTC)(H2O)6 and (b) La(BTC)(H2O)6. | |
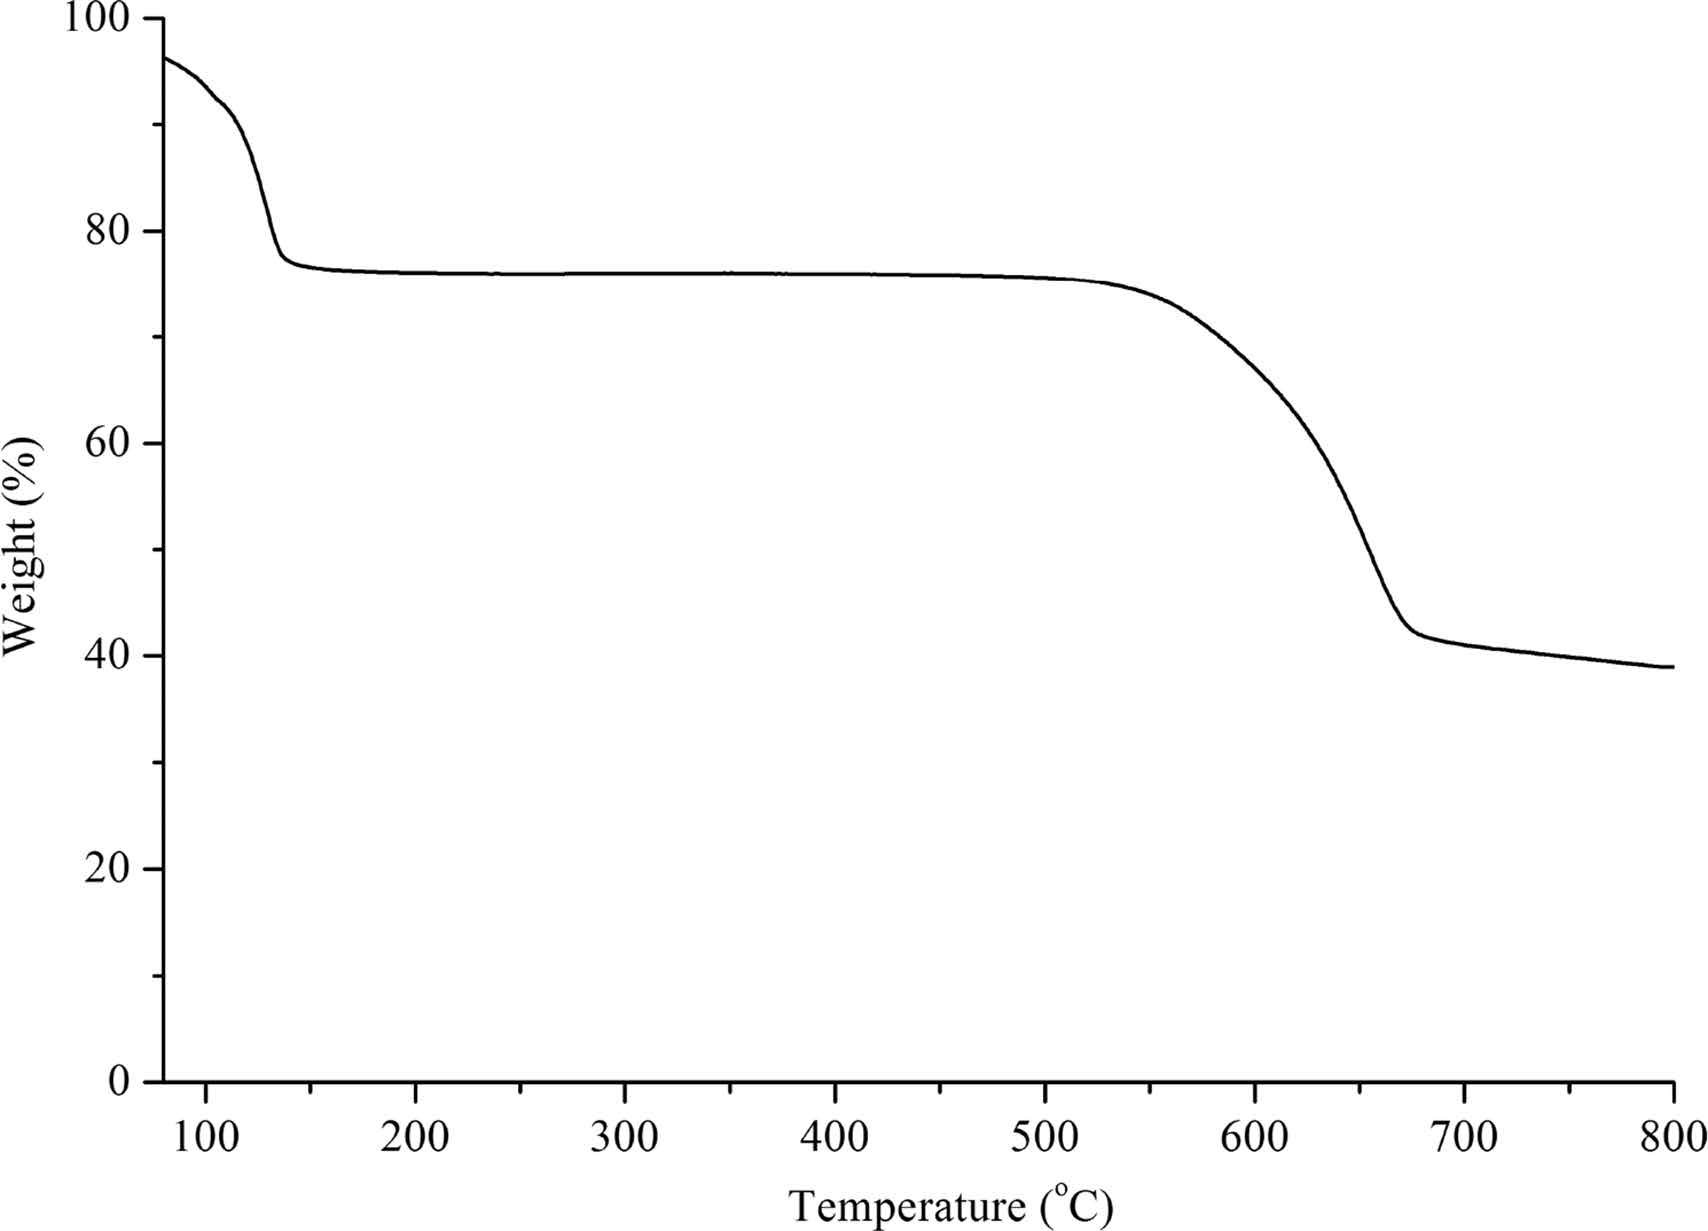
The chemical composition of Y(BTC)(H2O)6 is further confirmed by the TGA analysis (Fig. 3). When heated in a flowing N2 stream,the Y(BTC)(H2O)6 releases six lattice water molecules over 50-150 °C. The weight loss of 24% is in good agreement with the theoretical value of 26%. Upon further heating to 550 °C,the lost of mass of 36% at 600 °C corresponds to the value of 35% calculated for 1.0 mol of BTC3- indicating the decomposition of the ligand. 41% of weight is left at 800 °C attributed to Y2O3 and carbon.

|
Download:
|
| Fig. 3.TGA analysis results for Y(BTC)(H2O)6. | |
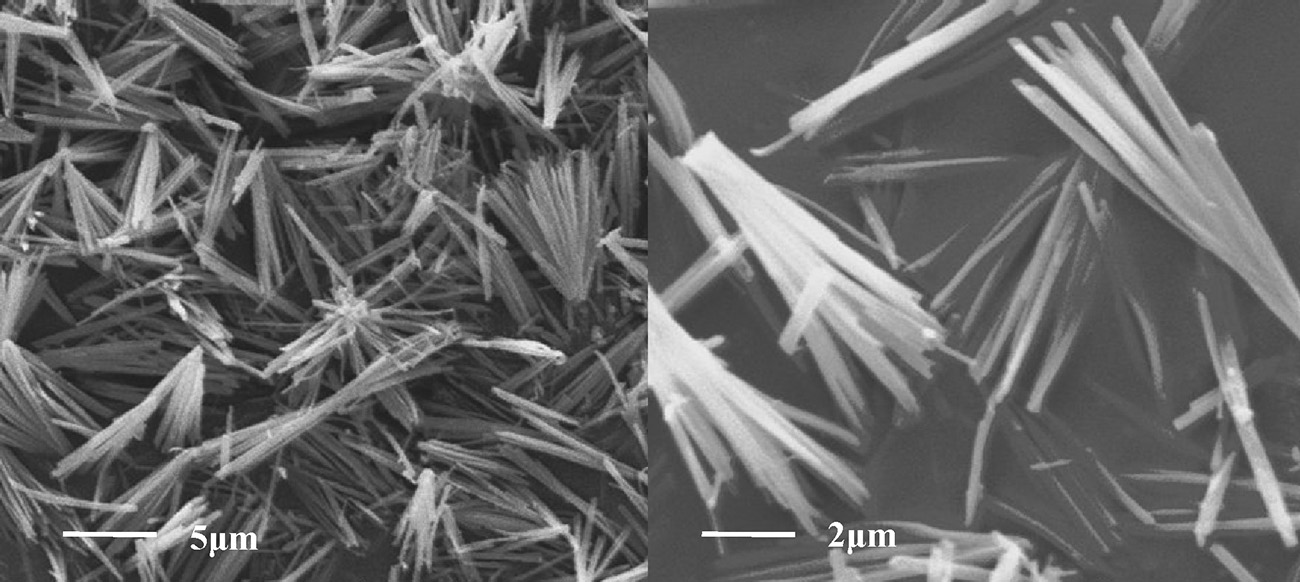
The morphology of the Y(BTC)(H2O)6 crystals is characterized by SEM images as given in Fig. 4. It is obvious that Y(BTC)(H2O)6 consists of relatively uniform rod-like crystals. A magnification of the SEM image indicates that the crystal is a prism with a size of 400 nm × 10 nm × 10 μm.

|
Download:
|
| Fig. 4.SEM images of the Y(BTC)(H2O)6 with different magnifications. | |
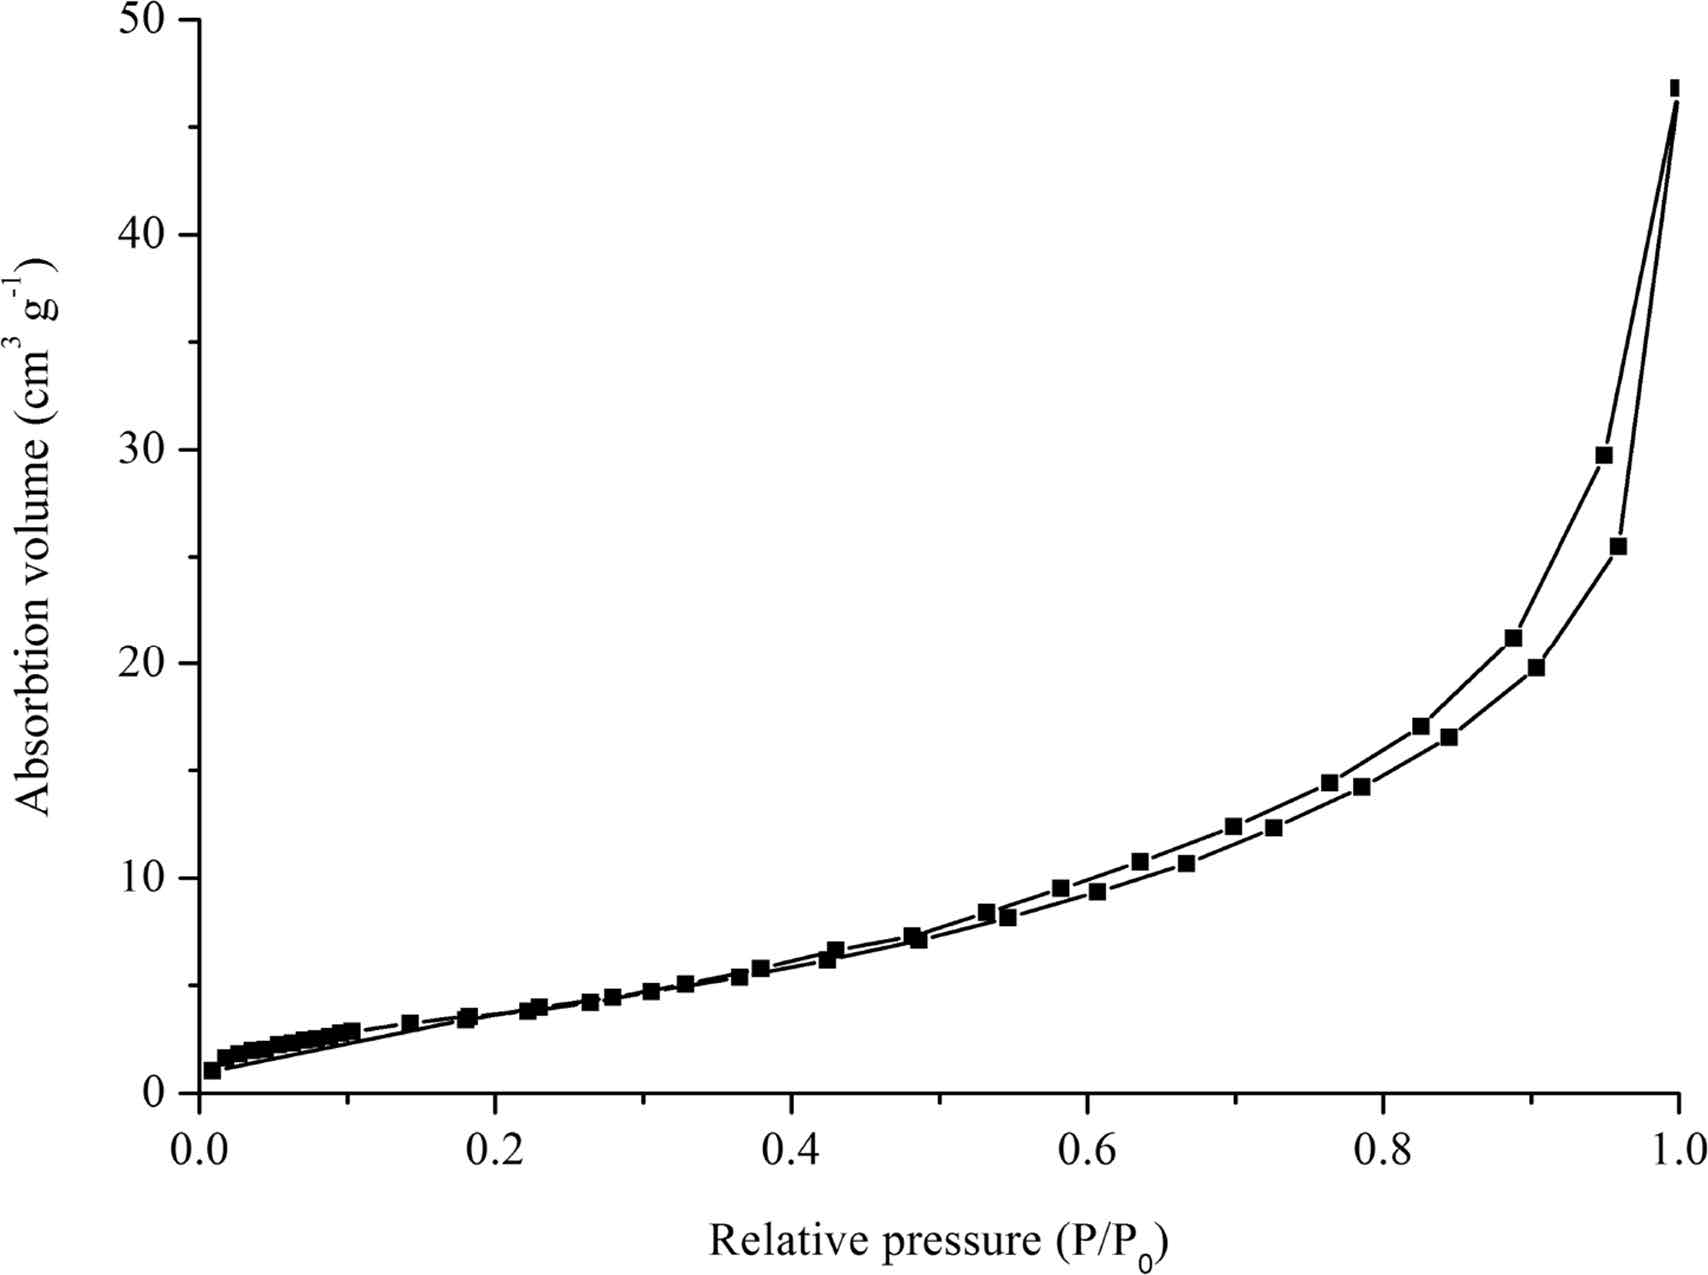
The nitrogen adsorption-desorption isotherms of Y(BTC)(H2O)6 are measured (Fig. 5). The isotherm of Y(BTC)(H2O)6 appears to be a normal Type II adsorption with a Type H3 hysteresis loop at high relative pressure,which is termed pseudo Type II isotherm. The BET surface area for the Y(BTC)(H2O)6 is derived to be 14.73 m2 g-1. The porosity of Y(BTC)(H2O)6 is obtained by the BJH (Barrett-Joyner- Halenda) method of mesopore analysis with adsorption branch. The result shows that the Y(BTC)(H2O)6 MOF has hierarchical pores with a broad distribution of the pore width of 19.66 nm. In practice, the mesopores and macropores are not critically related to the intrinsic properties of the crystal structure. In the present case,the pore width might be derived from the structural defects and voids between the crystals [19].

|
Download:
|
| Fig. 5.Nitrogen adsorption–desorption isotherm of Y(BTC)(H2O)6. | |
The microstructure and the large surface area of Y(BTC)(H2O)6 render itself a suitable medium for the adsorption of proteins. In our study,HSA and Hb are used as model proteins for further investigations. As illustrated in Fig. 6,when 100 mg mL-1 of protein in a 1 mL sample solution (pH 6.0) is treated with 0.40 mg of Y(BTC)(H2O)6,the adsorption efficiency for Hb is found to be greater than 70% with a pH value between 4 and 8. The adsorption efficiency of HSA is less than 10% within the whole pH range,and an even lower efficiency of < 5% at pH 6-8. The difference of adsorption behaviors for Hb and HSA is a promising property for their separation and selective isolation with Y(BTC)(H2O)6 as adsorbent.

|
Download:
|
| Fig. 6.pH dependence of the adsorption efficiencies of Hb and HSA onto the Y(BTC)(H2O)6. The concentration and volume of protein solution, 100 μg mL-1 and 1.0 mL; the amount of the Y(BTC)(H2O)6, 0.4 mg; the adsorption time, 15 min. | |
The isoelectric points (pI) of HSA and Hb are 4.9 and 7.0, respectively. It is known that a protein species is negatively charged at pH higher than its pI value. On the contrary,the protein is positively charged at pH lower than its pI value. The results in Fig. 5 illustrate that the adsorption efficiency of the two proteins show limited variation with pH values. This suggests that electrostatic interaction might be involved in the protein adsorption by Y(BTC)(H2O)6,but it is unlikely to be the main driving force.
Unlike other functional composites,e.g.,silica,carbon materials, there exist coordination interactions in the MOFs structure. For yttrium-based MOF configuration,MOF-76(Y),the central Y is 7- coordinated by six oxygen atoms from the carboxylate groups of the 1,3,5-benzenetricarboxylate ligands to form a tetragonal porous framework [13]. It implies that when proteins approach to the surface of the crystal Y(BTC)(H2O)6,Y3+ cations in Y(BTC)(H2O)6 might coordinate with the nitrogen atoms in the histidine residues exposed outside of the protein structure. Hb is a histidine-rich protein containing 15 surface-exposed histidine residues while HSA possess 3. There are fewer histidine groups in the structure of HSA. Therefore,the coordination interactions are relatively weak for the adsorption of HSA. The zeolitic imidazolate framework-8 and graphene oxide-rare earth MOF composites offered the same selective adsorption of Hb in comparison with HSA [10, 11]. Both the result of the present work and that reported elsewhere demonstrate that the coordination interactions between the metal cations and histidine residues in proteins play an important role in the adsorption of proteins on the MOF composites.
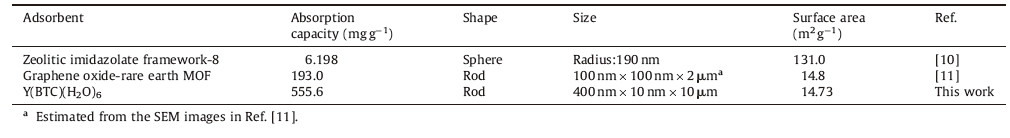
Adsorption of Hb by the Y(BTC)(H2O)6 is performed at different initial concentrations of Hb. The amount of Hb adsorbed on Y(BTC)(H2O)6 increased rapidly as the Hb concentration increased from 30 to 300 μgmL-1. Then a plateau is reached and further increases of Hb concentration results in no improvement on its adsorption. The adsorption behavior fits the Langmuir model,with a regression equation of 1/Qe = 0.0407/Ce + 0.0018 (r2 = 0.9074). The maximum adsorption capacity of Y(BTC)(H2O)6 for Hb is derived to be 555.6 mg g-1. Table 1 summarizes a comparison of the adsorption capacities of hemoglobin by various MOFs reported [10, 11]. It is clearly seen that Y(BTC)(H2O)6 offers a much improved adsorption capacity of Hb ascribing to its loose microstructure as well as the various interactions involved in the adsorption process.
| Table 1 A comparison on the adsorption capacity of Hb by various MOFs. |
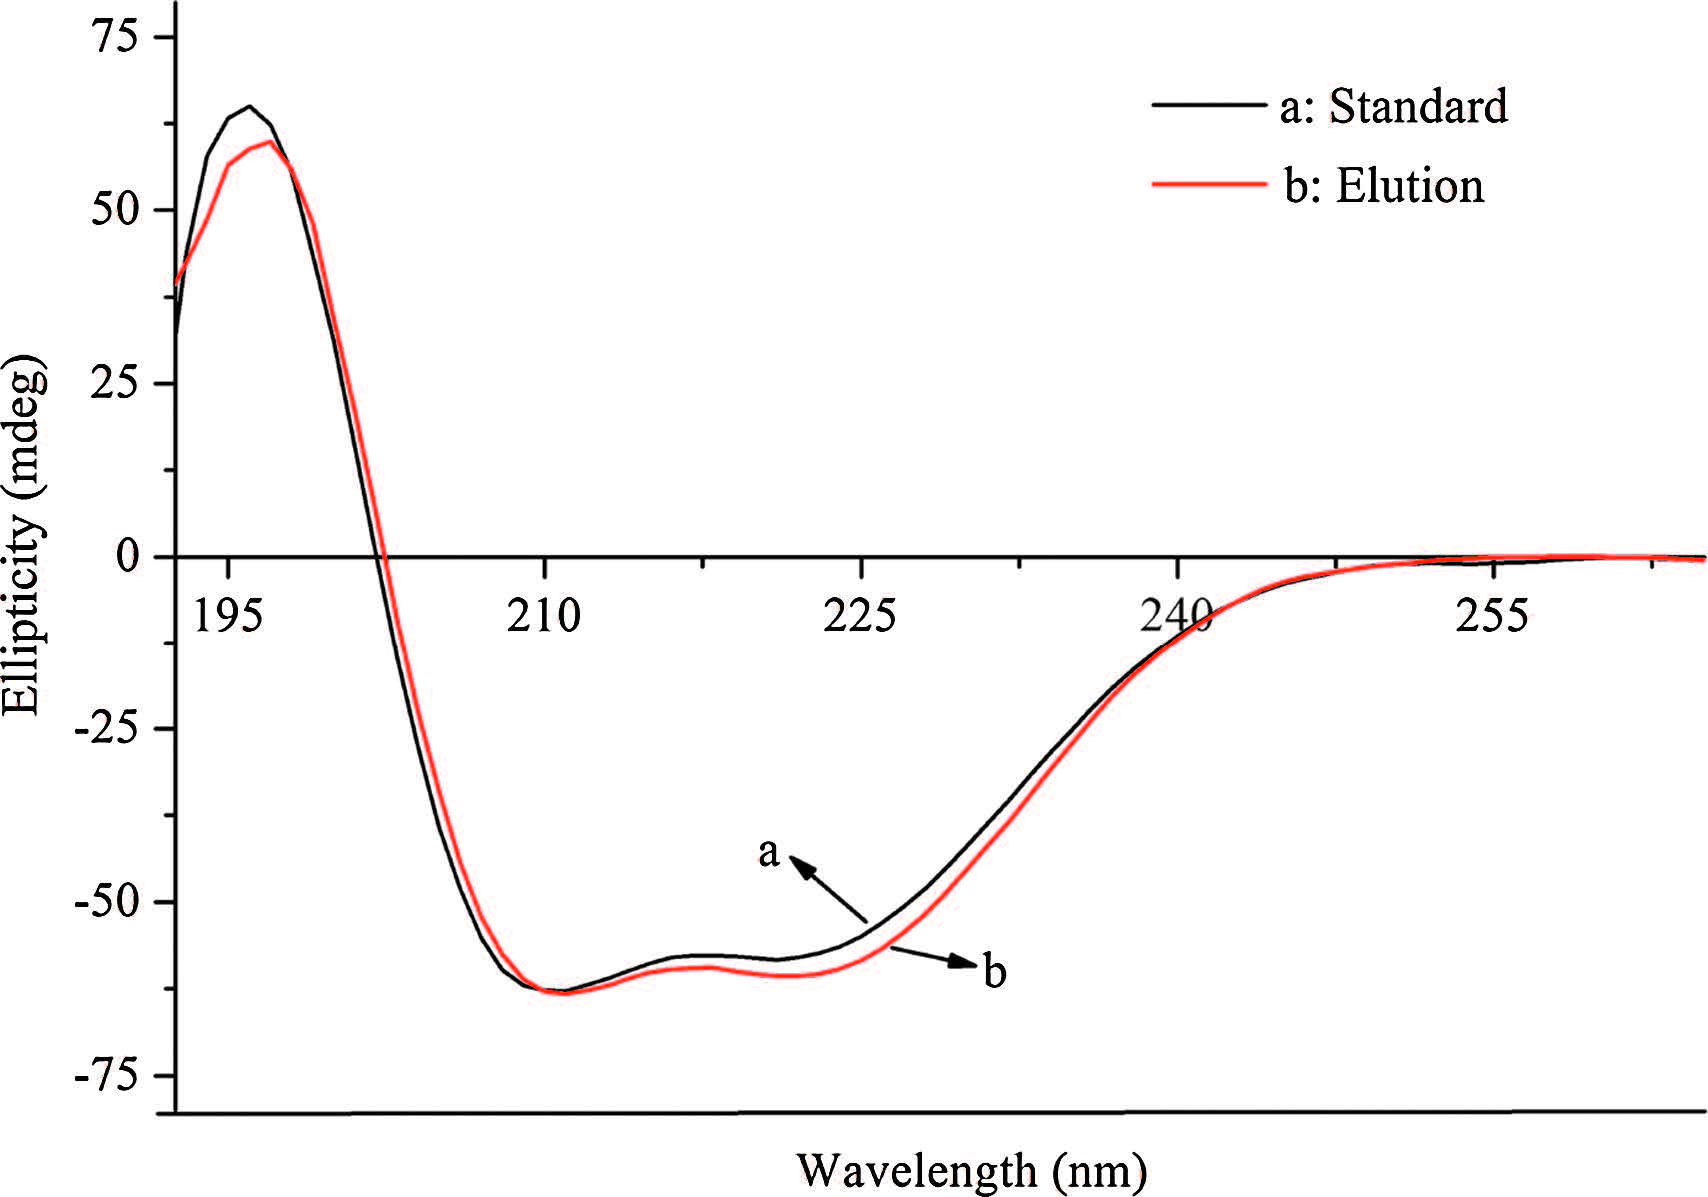
The recovery of the adsorbed Hb on Y(BTC)(H2O)6 is investigated using various stripping reagents,including Tris-HCl,sodium phosphate,sodium dodecyl sulfate (SDS). A 0.5% (m/v) of SDS facilitates a favorable recovery of ca. 77% for the retained Hb. Although the increase of SDS concentration improves Hb recovery, in the meantime it causes a significant reduction of the activity of Hb [20]. In practice,a 0.5% SDS solution is used and at this concentration the activity of Hb is mostly maintained. The secondary structure of Hb recovered from the Y(BTC)(H2O)6 is investigated using far-UV circular dichroism (CD) spectroscopy (Fig. 7). A standard Hb solution of 100 μgmL-1 in 0.5% SDS exhibits two clear negative bands at 210 nm and 218 nm (curve a). These are characteristics of the α-helical structure of proteins,and are attributed to n-π* transition of the α-helix peptide bond. The Hb recovered from Y(BTC)(H2O)6 into a 0.5% SDS solution shows similar peaks in the far-UV CD spectrum (curve b). This observation illustrates that the structure of Hb is maintained after the adsorption/separation procedure,and that Y(BTC)(H2O)6 possesses favorable biocompatibility for the separation of proteins.

|
Download:
|
| Fig. 7.CD spectra of hemoglobin. (a) 100 μgmL-1 [2TD$DIF] of hemoglobin standard solution; (b) hemoglobin in the eluate after desorption from Y(BTC)(H2O)6. | |
XRD pattern of Y(BTC)(H2O)6 before and after adsorption of hemoglobin is the same. This observation indicated that the Y(BTC)(H2O)6 is stable during the separation process of hemoglobin.
Y(BTC)(H2O)6 is further employed as an adsorbent for the selective adsorption and isolation of hemoglobin from human whole blood. In practice,100 mL of the anti-coagulated blood is taken and a 1500-fold dilution is made using deionized water. The erythrocytes are broken in the diluted solution by releasing hemoglobin into the supernatant,while the solid matter is removed by centrifugation. The fluid is then subject to adsorption by the MOF material,and SDS-PAGE assay is performed for the collected hemoglobin. As seen in Fig. 8,there are several clear protein bands for the human whole blood (Lane 2). The bands at 66 kDa and 14 kDa are assigned to HSA and Hb,respectively. After the adsorption by Y(BTC)(H2O)6,the band of HSA is still clearly observed in the effluent and the band of Hb becomes slightly weaker (Lane 3),this indicates that no adsorption occurs for HSA. The stripping by 0.5% SDS solution results in a single band for hemoglobin (Lane 5). The SDS-PAGE results demonstrate that Hb could be selectively isolated from a complex sample matrix using Y(BTC)(H2O)6 as an adsorbent.

|
Download:
|
| Fig. 8.SDS[3TD$DIF]–PAGE assay results. Lane 1: Marker (kDa); Lane 2: 1500-fold diluted human whole blood without pretreatment; Lane 3: 1500-fold diluted human whole blood after adsorption by the Y(BTC)(H2O)6; Lane 4: Hb standard solution of 30 μg mL-1; Lane 5: Hb recovered from the Y(BTC)(H2O)6 materials. | |
The reaction of yttrium nitrate with H3BTC in a water-ethanol phase at room temperature results in the formation of a crystal rod-like metal organic framework. The reaction conditions are found to be highly critical for the formation of the specific crystal structure of the yttrium-based MOF. The Y(BTC)(H2O)6 material is demonstrated to be a suitable and biocompatible medium for the separation of proteins. The coordination interactions between the metal cations and histidine residues in proteins play an important role in the selective adsorption of Hb onto the MOF composites.
AcknowledgmentsThe authors appreciate financial supports from the National Natural Science Foundation of China Nos. 21235001,21375013, 21475017,21575020),and Fundamental Research Funds for the Central Universities (Nos. N140505003,N141008001).
| [1] | Q.L. Zhu, Q. Xu, Metal-organic framework composites, Chem. Soc. Rev. 43 (2014) 5468-5512. |
| [2] | K. Yusuf, A. Aqel, Z. Alothman, Metal-organic frameworks in chromatography, J. Chromatogr. A 1348 (2014) 1-16. |
| [3] | J.P. Lei, R.C. Qian, P.H. Ling, L. Cui, H.X. Ju, Design and sensing applications of metal-organic framework composites, TrAC Trends Anal. Chem. 58 (2014) 71-78. |
| [4] | Z.Y. Gu, J. Park, A. Raiff, Z.W. Wei, H.C. Zhou, Metal-organic frameworks as biomimetic catalysts, ChemCatChem 6 (2014) 67-75. |
| [5] | N.C. Burtch, H. Jasuja, K.S. Walton, Water stability and adsorption in metal- organic frameworks, Chem. Rev. 114 (2014) 10575-10612. |
| [6] | Z.Y. Gu, Y.J. Chen, J.Q. Jiang, X.P. Yan, Metal-organic frameworks for efficient enrichment of peptides with simultaneous exclusion of proteins from complex biological samples, Chem. Commun. 47 (2011) 4787-4789. |
| [7] | C.B. Messner, M.R. Mirza, M. Rainer, et al., Selective enrichment of phosphopeptides by a metal-organic framework, Anal. Methods 5 (2013) 2379-2383. |
| [8] | Y.W. Zhang, Z. Li, Q. Zhao, et al., A facilely synthesized amino-functionalized metal-organic framework for highly specific and efficient enrichment of glycopeptides, Chem. Commun. 50 (2014) 11504-11506. |
| [9] | M. Zhao, C.H. Deng, X.M. Zhang, P.Y. Yang, Facile synthesis of magnetic metal organic frameworks for the enrichment of low-abundance peptides for MALDI- TOF MS analysis, Proteomics 13 (2013) 3387-3392. |
| [10] | J.N. Zheng, Z. Lin, G. Lin, H.H. Yang, L. Zhang, Preparation of magnetic metal- organic framework nanocomposites for highly specific separation of histidinerich proteins, J. Mater. Chem. B 3 (2015) 2185-2191. |
| [11] | J.W. Liu, Y. Zhang, X.W. Chen, J.H. Wang, Graphene oxide-rare earth metal- organic framework composites for the selective isolation of hemoglobin, ACS Appl. Mater. Interfaces 6 (2014) 10196-10204. |
| [12] | S.Z. Li, F.W. Huo, Metal-organic framework composites: from fundamentals to applications, Nanoscale 7 (2015) 7482-7501. |
| [13] | T.W. Duan, B. Yan, Hybrids based on lanthanide ions activated yttrium metal- organic frameworks: functional assembly, polymer film preparation and luminescence tuning, J. Mater. Chem. C 2 (2014) 5098-5104. |
| [14] | F. Wang, K.J. Deng, G.L. Wu, et al., Facile and large-scale syntheses of nanocrystal rare earth metal-organic frameworks at room temperature and their photoluminescence properties, J. Inorg. Organomet. Polym. 22 (2012) 680-685. |
| [15] | Z. Rzaczyń ska, A. Ostasz, S. Pikus, Thermal properties of rare earth elements complexes with 1,3,5-benzenetricarboxylic acid, J. Therm. Anal. Calorim. 82 (2005) 347-351. |
| [16] | K. Nakamoto, Infrared and Raman Spectra of Inorganic Coordination Compounds, John Wiley, New York, NY, 2006. |
| [17] | Y.H. Wen, J.K. Cheng, Y.L. Feng, et al., Synthesis and crystal structure of [La(BTC)(H2O)6]n, Chin. J. Struct. Chem. 24 (2005) 1440-1444. |
| [18] | J.H. Luo, H.W. Xu, Y. Liu, et al., Hydrogen adsorption in a highly stable porous rareearth metal-organic framework: sorption properties and neutron diffraction studies, J. Am. Chem. Soc. 130 (2008) 9626-9627. |
| [19] | J. Rouquerol, F. Rouquerol, K.S.W. Sing, Adsorption by Powders and Porous Solids: Principles, Methodology and Applications, Academic Press, San Diego, CA, 1998. |
| [20] | Y. Shu, X.W. Chen, J.H. Wang, Ionic liquid-polyvinyl chloride ionomer for highly selective isolation of basic proteins, Talanta 81 (2010) 637-642. |