 2015, Vol.26


b Department of Chemistry and The MOE Key Laboratory of Spectrochemical Analysis & Instrumentation, College of Chemistry and Chemical Engineering, Xiamen University, Xiamen 361005, China
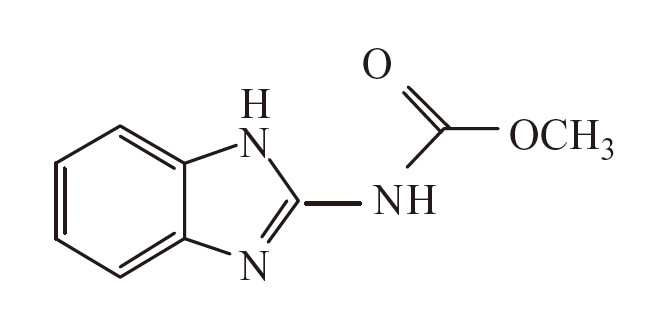
Tea is one of the important cash crops in some area of China. During the tea cultivation,insecticides are inevitably used for the pest and plant disease control. Carbendazim (CBZ) is a kind of benzimidazone fungicide (its chemical structure was shown as Fig. 1),which is often used as foliage spraying,seed dressing and soil treatment [1]. CBZ is of lower toxicity to mammals [2],but its higher dose damages their reproduction and growth. Animal experiments reveal that CBZ increases the sexual hormone activity of male [3]. The National Food Regulatory Agencies sets its maximum residue limits in tea and other foods. In China food safety standards,the tolerance for CBZ residue in tea is 5 mg kg-1 [4].

|
Download:
|
| Fig. 1.Chemical structure of carbendazim. | |
There have been reports focusing on the study of CBZ in tea. Wang [5] reported the transfer rates of pesticide residues from dried tea to brewed tea leaves and found that CBZ was one of the three most frequently found pesticide among 12 pesticide residues. Several analytical methods have been applied in the detection of CBZ including high performance liquid chromatography (HPLC) [6, 7],electrochemical [8, 9] and fluorescence approaches [10]. Generally,these techniques require complex sample preparations and the time-consuming detection process, resulting in the inconvenience for the in-situ detection. It is becoming important to develop rapid analytical methods for the CBZ detection. Surface enhanced Raman scattering (SERS) provides a very interesting option,which has attracted much attention for food monitoring [11, 12],chemical [13] and pesticide analysis such as phosmet residues on navel orange surface [14] tricyclazole and paraquat in food [15],carbarylin apple juice and vegetables [16],as well as pesticide on fruit peel [17, 18]. Although there have been some reports on the determination of CBZ for fruit or vegetable sample using SERS [19, 20],there is still few report on the SERS analysis of CBZ for tea samples.
In this work,we developed a fast method to detect CBZ in tea and on tea leaves without complex sample preparations. The all analytical process could be finished within 30 min. It can be applied in the quantitative analysis of CBZ in tea samples with a low LOD,and will be helpful to control the tea quality.
2. ExperimentalCBZ was purchased from Sigma-Aldrich. Methanol was obtained from TEDLA Co. Ltd. Ultrapure water (18.2 MV cm) was produced from a Simplicity Water Purification System (Millipore,USA) and used in the all experiments throughout. ENVI-Carb solid phase extraction columns (Supleco) were obtained from Sigma-Aldrich,which were activated according to the instruction before use.
The synthesis of Au colloid was performed using chemical reduction of chloroauric acid with a sodium citrate method introduced by Frens [21]. 1.5 mL aliquot of the prepared gold colloid was centrifuged at 6000 rpm for 10 min,and then,the supernatant was removed to keep the volume of concentrated gold colloid at 10 μL before use.
All surface enhanced Raman spectra were collected using an Inspector Raman (Deltanu Inc.) equipped with 785 nm laser excitation source. The laser power was approximately 60 mW. The accumulation time for each spectrum was set as 1 s.
A high performance liquid chromatography (HPLC,Shimadzu, LC-20AT) equipped with a SPD-20A detector and a Syncronis C18 column (4.6 mm × 250 mm,5.0 μm) was used for the experimental verification. In the HPLC experiments,methanol and water (50:50,v/v) was used as the mobile phase,and the flow rate was set as 0.6 mL min-1. The injection volume of samples was 5 μL.
The tea samples from local supermarkets were dried and then ground through 40 mesh. 0.3 g ground tea sample was put into a centrifuge tube. After the addition of 100 μL 0.25 mol L-1 HCl and 3 mL water,the suspension was ultrasonically extracted for 20 min at room temperature (25 °C),and then centrifuged for 3 min at the speed of 5000 rpm. The suspension was filtered through an ENVICarb extraction column. The filtered solution was used for SERS measurements.
In the detection of CBZ in a tea infusion,0.5 g tea sample spiked CBZ 8.0 mg kg-1 was put into a cup and then brewed with 11 mL boiling water. In the tea infusion preparation,the first immersing time for the tea brewing was set as 1 min,2 min for the second brewing,and 5 min for the third (simulating to the tea organoleptic examination procedure). The tea infusion was filtered through the ENVI-Carb extraction column. 200 μL filtrate was added into a sample tube. After the addition of 10 μL condensed Au colloid uniformly,the collected Raman signal could be obtained.
A tea plantation in Wuyi University was selected for the study of CBZ residue on tea leaves. Before spraying,50% CBZ was diluted to 1000 times. The sprayed tea leaf samples were collected in different time interval,which was selected as 1 to 7 day with per day interval. In the detection of CBZ residue on tea leaves,10 mL of condensed gold colloid was dipped onto the leaf surface. In order to mix the analyte well,the Au colloid solution was repeatedly sucked several times using a pipette,and the dipping area should be controlled around 1 cm2. The SERS signals from the picked tea leaves were finally measured and collected.
In the HPLC control experiments,the sample preparation was similar with that of SERS method. In the experiments,the supernate of the tea sample was filtered through an extraction column and a 0.45 μm membrane before the sample injection. All the analysis for both brewed tea and tea leaves were performed in triplicate.
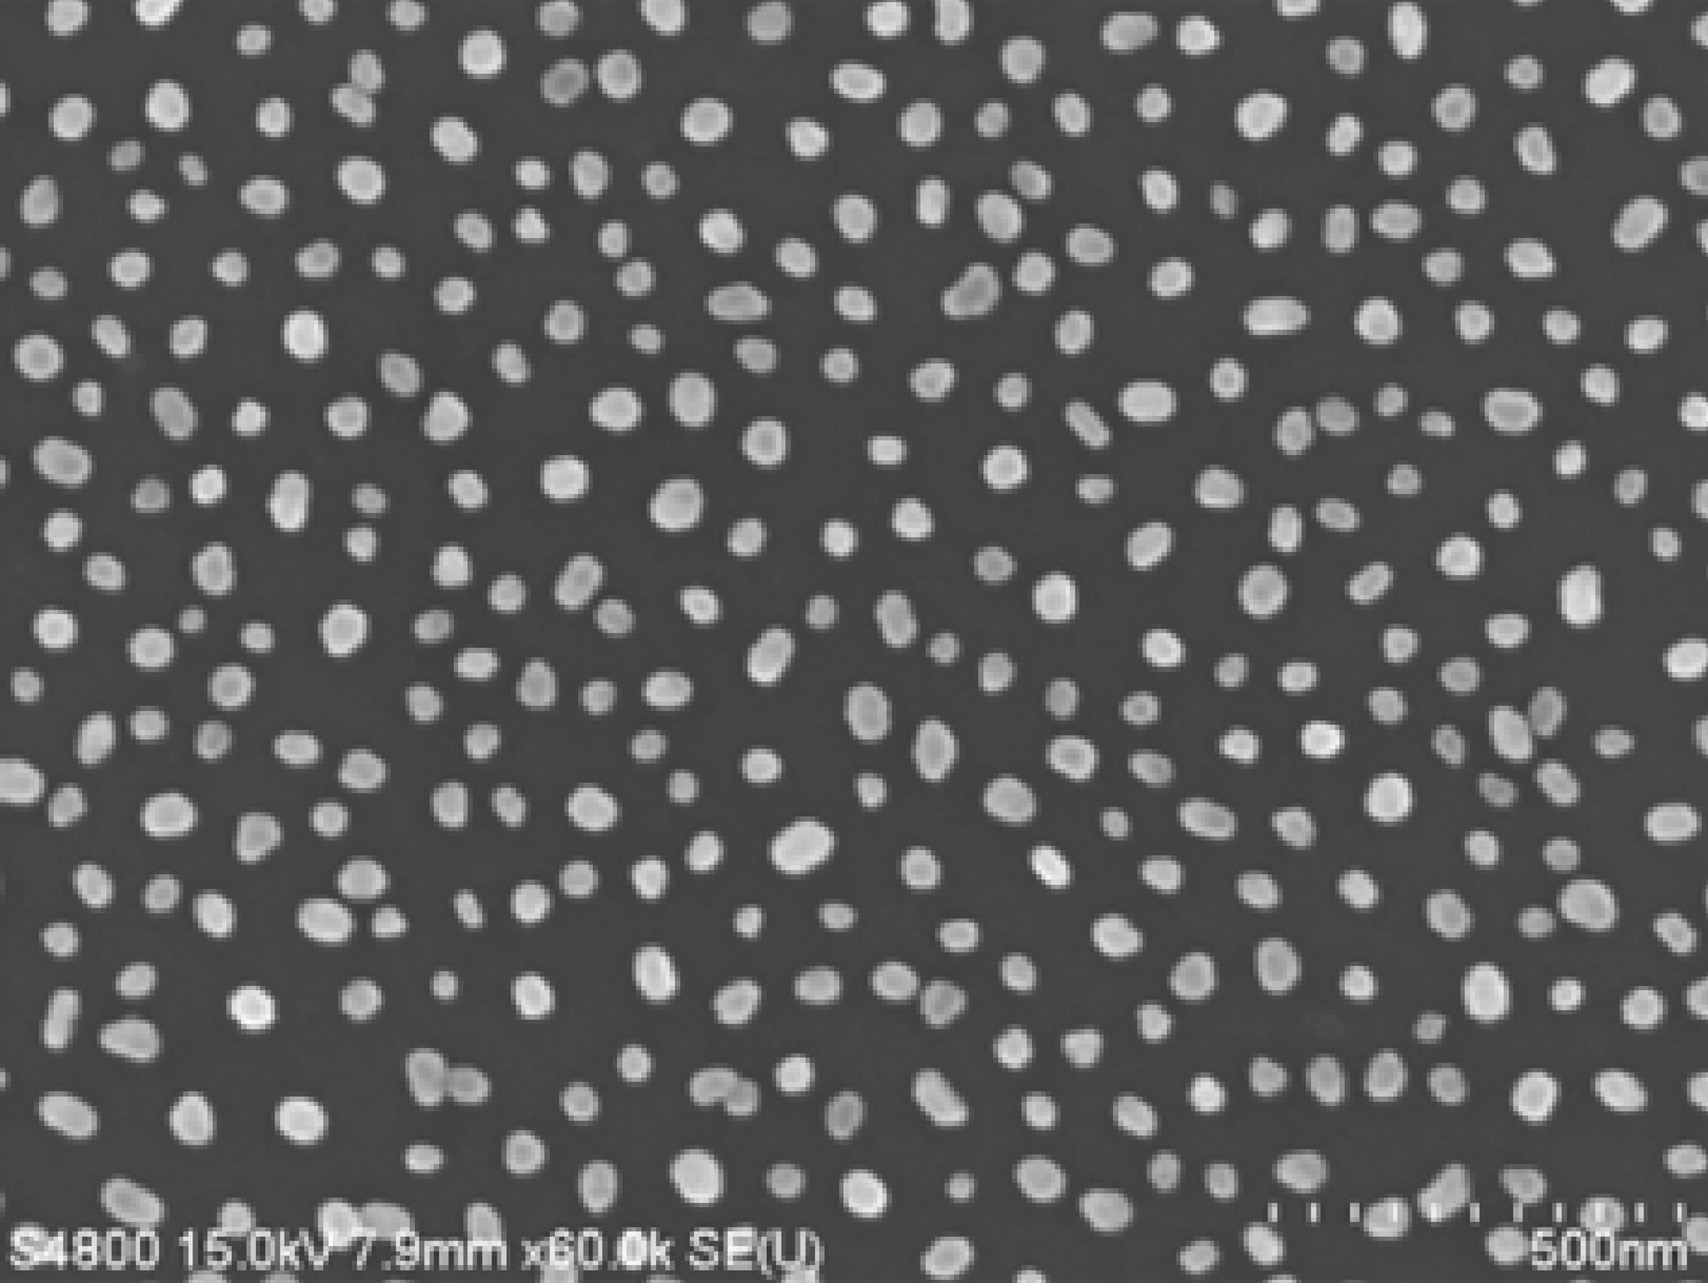
3. Results and discussionThe prepared gold nanoparticles (GNPs) is shown in Fig. 2,the GNPs are spherical in shape and about 55 nm in diameter.

|
Download:
|
| Fig. 2.The scanning electron microscopy (SEM) of gold nanoparticles. | |
CBZ molecule consists of benzimidazolyl,amino and methyl formate,including C-H,N-H,C55C,C55O and -CH3 group,which functional group has its characteristic vibrational frequency and mode [22]. The spectrum of carbendazim in water was shown in Fig. 3,and the assignments of Raman bands of CBZ are presented in Table 1. The Raman shifts between the wavenumber from 400 to 1000 cm-1 are mainly attributed to the inner bending vibration of C-C-C,and the shifts with higher intensity from 1000 to 1400 cm-1 are attributed to C-H outer bending,imdazole inner ring vibration and C-N stretching vibration [3, 23]. The shifts in the range of 1400 to 2000 cm-1 mainly relate to C=C stretching vibration. A typical SERS spectrum of CBZ aqueous solution is shown in Fig. 3. The obvious shift peaks at 1021,1283 and 1392 cm-1 can be used as the characteristic peak of CBZ. In the experiments,the peak at 1021 cm-1 was used to the analysis of CBZ.

|
Download:
|
| Fig. 3.SERS spectrum of carbendazim. | |
| Table 1 Wavenumbers and assignments of Raman bands of carbendazim. |

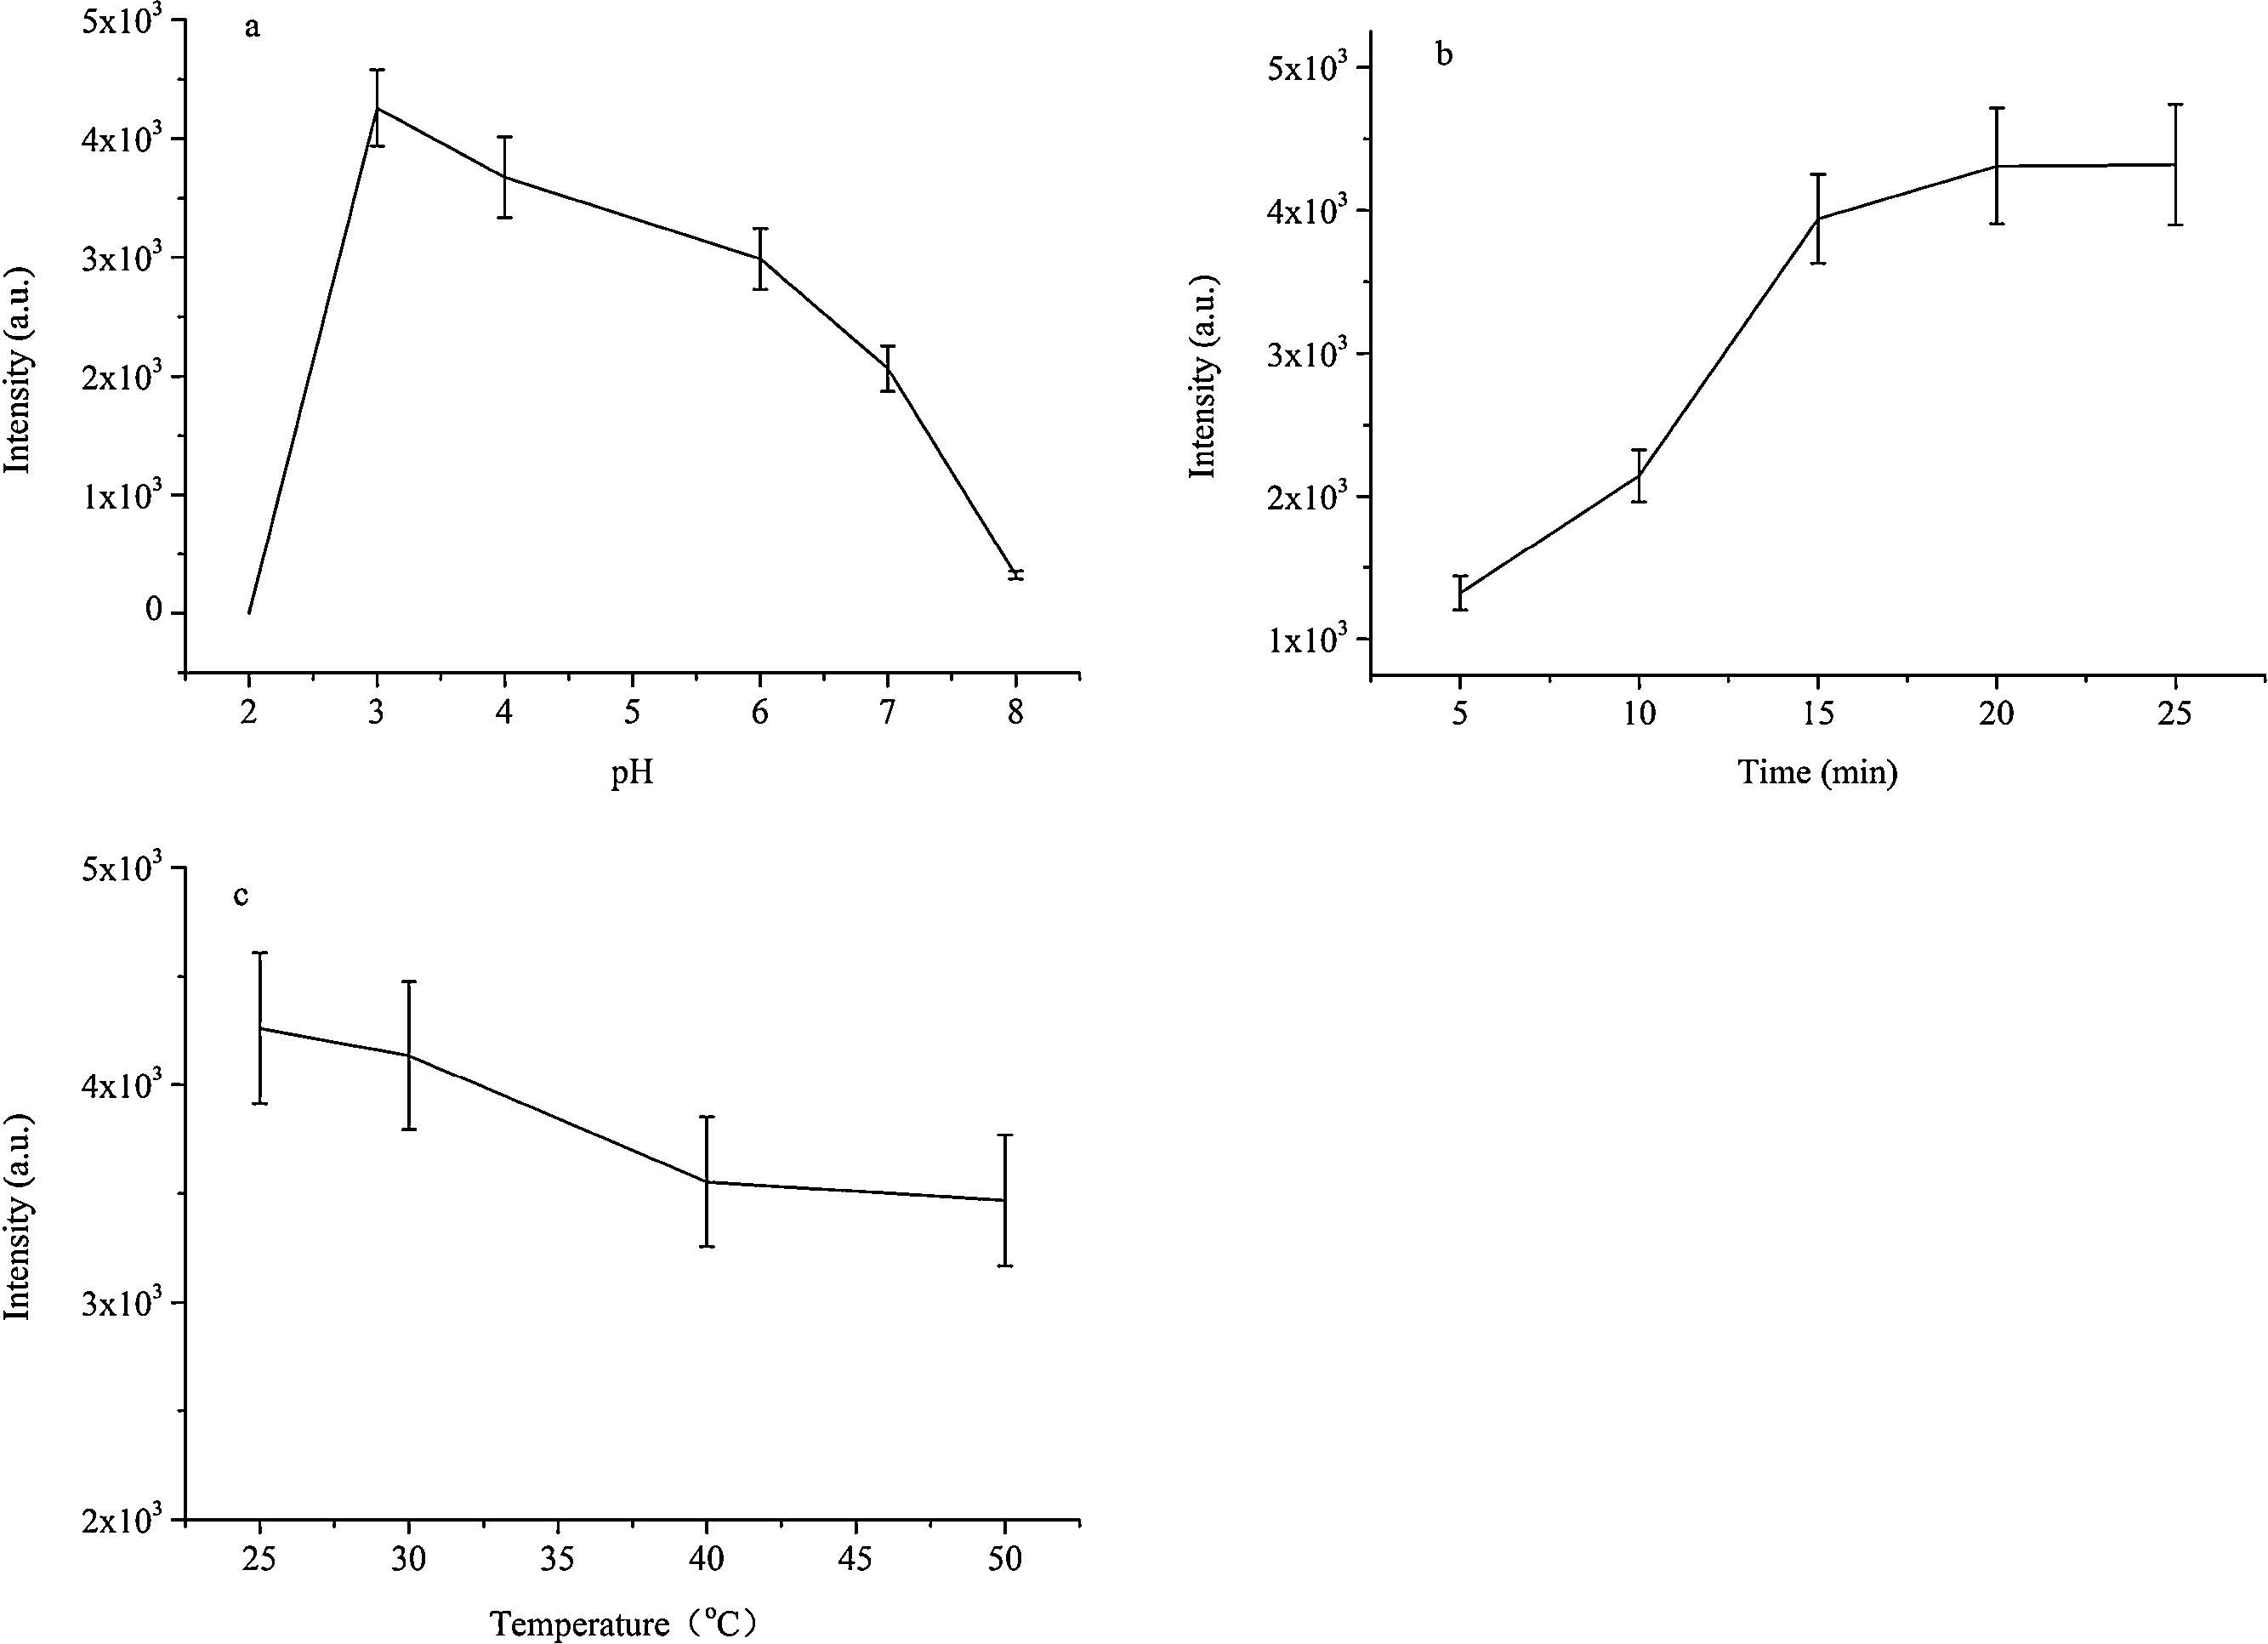
Under the consideration of sensitivity and the simplicity of the proposed approach,several parameters such as pH value, extraction time and temperature,which affect the extraction efficiency,were studied and optimized using 0.3 g tea sample spiked CBZ (final amount 6.0 mg kg-1). CBZ is soluble and stable in acidic conditions,but changes to its salt in an alkaline condition. The pH effect on the SERS signal of CBZ was investigated. As shown in Fig. 4a,no obvious SRES signal of CBZ could be found at pH 2, while the signal obviously increased with the increase of pH,and a maximum response at pH could be obtained. pH affects Raman intensity hugely since gold colloid aggregates at very low pH conditions,however,in an appropriate pH condition,gold nanoparticles can combine with analyte and cause signal enhancement. When pH was over 3,the higher pH caused lower SERS responses owing to its lower solubility at higher pH. The ultrasonic extraction time is another factor that affects the SERS signal intensity. In the experiment,the effect of the ultrasonic time from 5 to 25 min was studied. As depicted in Fig. 4b,the extraction efficiency increased with the longer ultrasonic time,and almost reached a constant value after the 20 min extraction. Hence,the ultrasonic time was chosen as 20 min. Temperature generally affects the molecular motion and transfer,resulting in different extraction efficiency. The higher extraction temperature may increase the extraction ability of solvent (water is the solvent in this experiment),while the diffusion of the target molecule in the matrix increases simultaneously. The effect of the ultrasonic temperature on the SERS signal was studied from 25 to 50 °C. As depicted in Fig. 4c,SERS intensity conversely decreased as the increase of ultrasonic temperature,revealing a complex process in the extraction of solvent (water) and the diffusion in the matrix (tea leaf). Based on the experimental results,the ultrasonic process was performed at the room temperature (25 °C) (Fig. 5).

|
Download:
|
| Fig. 4.Optimization of extraction conditions (a) effect of pH; (b) extraction time; (c) extraction temperature. | |

|
Download:
|
| Fig. 5.SERS spectra of CBZ in tea spiked different concentration of CBZ (mg kg-1). (a) 0, (b) 0.5, (c) 1.0, (d) 5.0, (e) 8.0. | |
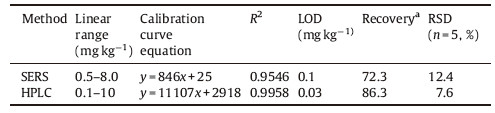
Under the optimized conditions,the analytical performance of the proposed approach was investigated. As listed in Table 2,the experimental results revealed that the limit of detection (LOD),defined at a signal to-noise of three,was calculated as 0.1 mg kg-1, and the linearity between to CBZ concentration and the SERS signal intensity ranged from 0.5 to 8.0 mg kg-1 with a correlation coefficient (R2) of 0.9546. For the samples spiked with 5 mg kg-1 1 CBZ,the relative standard deviation was found to be 12.4% in five reduplicate detections. HPLC was applied to verify the results of SERS,its characteristics also listed in Table 2.
| Table 2 Analytical characteristics of SERS and HPLC for the CBZ detection in tea samples. |
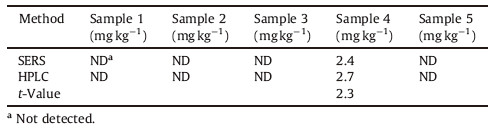
The method was then applied to the determination of CBZ in tea samples. In the analysis,each determination was replicated three times. The results for the CBZ analysis using SERS and HPLC were compared and listed in Table 3. The results showed that t value was 4.3 at the condition of 95% confidence coefficient,indicating that the two methods exists no obvious difference in the determination of CBZ in tea samples.
| Table 3 The comparison results for CBZ in tea samples using SERS and HPLC. |
The proposed method was applied to the detection of CBZ in tea infusion to study its transfer rate in the tea brewing. Tea samples were spiked using 8 mg kg-1 CBZ,and the results as shown in Fig. 6 revealed that the concentration of CBZ in tea infusion was less than 0.1 mg kg-1. The lower concentration of CBZ in the tea infusion may be caused by the strong adsorption capacity of tea leaves due to the hydrophobicity of CBZ. In addition,the short immersing time of the tea leaves (generally less 5 min) did not ensure the dissolving of CBZ out,which limited the transfer of CBZ into the tea infusion.

|
Download:
|
| Fig. 6.SERS spectra of CBZ in different tea infusions. | |
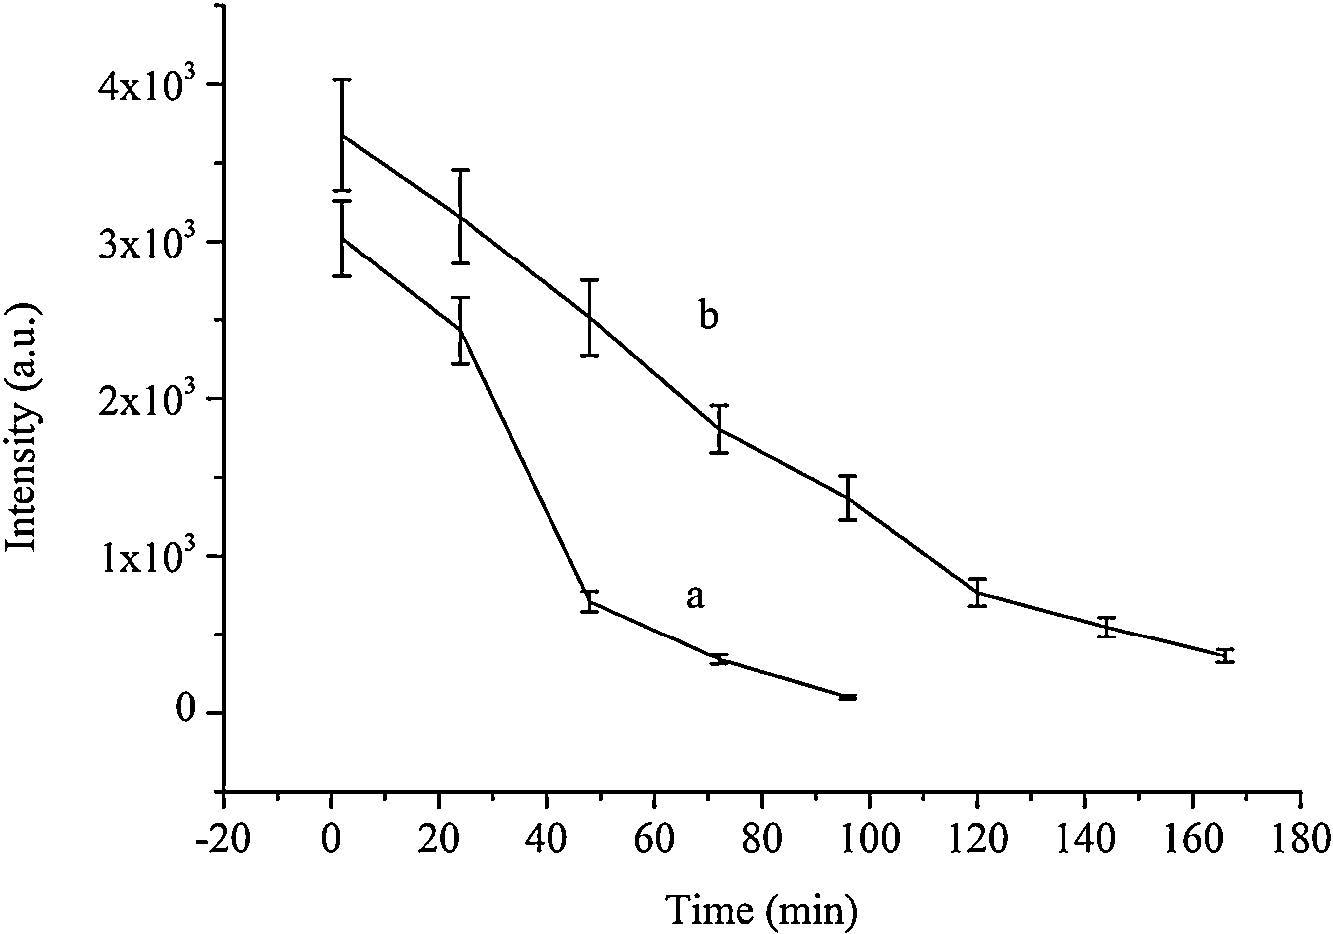
In the monitor of the concentration change of CBZ after its spraying,SERS appeared its excellent characteristics owing to its convenience and no sample preparation. In the field applications, we just dipped the condensed Au colloid on the tea sample leaves and then collected the SERS signal. In the tea plantation of Wuyi University,CBZ spraying experiments were carried out in raining and sunshiny days. Clearly,as shown in Fig. 7a,the residue amount of CBZ decreased obviously in the raining days. In 48 h,its amount decreased 70% of its initial value due to the rain-water flow. However,in contrast,the amount of CBZ still kept 50% of its initial amount in the sunshiny days after CBZ was sprayed for 4 days as shown in Fig. 7b. Pesticide residue refers to the pesticides that may remain on or in food after they are applied to food crops, and the amount of residue was affected by the stability of pesticide and environment factors such as temperature,illumination intensity and moisture content. Fan [24] determined CBZ in teas using HPLC,and found that the half-life of CBZ was 5.3 days. Devi [25] found that the half-life of CBZ in mango was 1-5 days. Our results displayed that the half-life of CBZ sprayed on the tea leaves was about 4 days,which is coincident with the reported results.

|
Download:
|
| Fig. 7.SERS of leaf spiked with carbendazim (a) rain the next day after spraying carbendazim (b) without rain. | |
In this study,we proposed a fast and simple SERS method for the detection of CBZ residue in tea samples. The sample preparation time is less than 25 min. In addition,its operation process is simple. Moreover,the proposed method is of good sensitivity,and can be applied to analyze the half-life period of CBZ,which is meaningful to detect CBZ in tea plantation.
AcknowledgmentThis work was financially supported by the National Instrumentation Program (NO. 2011YQ0301240904),which is gratefully acknowledged.
| [1] | Z.H. Wei, J. Xu, M.X. Guo, A.M. Shi, Research progress of carbendazim in China, J. Anhui Agric. Sci. 43 (2015) 125-127. |
| [2] | P.S. Daundkar, S. Rampal, Evaluation of ameliorative potential of selenium on carbendazim induced oxidative stress in male goats, Environ. Toxicol. Pharm. 38 (2014) 711-719. |
| [3] | F.R. Dollish, W.D. Fateley, F.F. Bentley, Characteristic Raman Frequencies of Organic Compounds, Chinese Chemical Society, Beijing, 1980. |
| [4] | General administration of quality supervision inspection and quarantine of the People's Republic of China,GB 2763-2014., National food safety standardmaximum residue limits for pesticides in food, Standard Press of China, Beijing, 2014, pp. 54. |
| [5] | J. Wang, W. Cheung, D. Leung, Determination of pesticide residue transfer rates (percent) fromdried tea leaves to brewedtea, J.Agric. Food Chem. 62 (2014) 966-983. |
| [6] | Q.H. Wu, Y.P. Li, C. Wang, et al., Dispersive liquid-liquid microextraction combined with high performance liquid chromatography-fluorescence detection for the determination of carbendazim and thiabendazole in environmental samples, Anal. Chim. Acta 638 (2009) 139-145. |
| [7] | Z.M. Liu, W.H. Liu, Q.H. Wu, et al., Determination of carbendazim and thiabendazole in apple juice by hollow fibre-based liquid phase microextraction-high performance liquid chromatography with fluorescence detection, Int. J. Environ. Anal. Chem. 92 (2012) 582-591. |
| [8] | C.A. Razzino, L.F. Sgobbi, T.C. Canevari, J. Cancino, S.A.S. Machado, Sensitive determination of carbendazim in orange juice by electrode modified with hybrid material, Food Chem. 170 (2015) 360-365. |
| [9] | Y.J. Guo, S.J. Guo, J. Li, E.K. Wang, S.J. Dong, Cyclodextrin-graphene hybrid nanosheets as enhanced sensing platform for ultrasensitive determination of carbendazim, Talanta 84 (2011) 60-64. |
| [10] | L. Rubio, M.C. Ortiz, L.A. Sarabia, Identification and quantification of carbamate pesticides in dried lime tree flowers by means of excitation-emission molecular fluorescence and parallel factor analysis when quenching effect exists, Anal. Chim. Acta 820 (2014) 9-22. |
| [11] | Y.Q. Zhu, L. Zhang, L.B. Yang, Designing of the functional paper-based surfaceenhanced Raman spectroscopy substrates for colorants detection, Mater. Res. Bull. 63 (2015) 199-204. |
| [12] | Y.Y. Zhang, W.S. Yu, L. Pei, et al., Rapid analysis of malachite green and leucomalachite green in fish muscles with surface-enhanced resonance Raman scattering, Food Chem. 169 (2015) 80-84. |
| [13] | A.Y. Panarin, I.A. Khodasevich, O.L. Gladkova, S.N. Terekhov, Determination of antimony by surface-enhanced Raman spectroscopy, Appl. Spectrosc. 68 (2014) 297-306. |
| [14] | Y.D. Liu, B.B. He, Y.X. Zhang, H.Y. Wang, B. Ye, Detection of phosmet residues on navel orange skin by surface-enhanced Raman spectroscopy, Intell. Autom. Soft Comput. 21 (2015) 423-432. |
| [15] | Q.Q. Li, Y.P. Du, Y. Xu, et al., Rapid and sensitive detection of pesticides by surfaceenhanced Raman spectroscopy technique based on glycidyl methacrylate-ethylene dimethacrylate (GMA-EDMA) porous material, Chin. Chem. Lett. 24 (2013) 332-334. |
| [16] | Z. Zhang, Q.S. Yu, H. Li, A. Mustapha, M.S. Lin, Standing gold nanorod arrays as reproducible SERS substrates for measurement of pesticides in apple juice and vegetables, J. Food Sci. 80 (2015) N450-N458. |
| [17] | X.H. Tang, R.L. Dong, L.B. Yang, J.H. Liu, Fabrication of Au nanorod-coated Fe3O4 microspheres as SERS substrate for pesticide analysis by near-infrared excitation, J. Raman Spectrosc. 46 (2015) 470-475. |
| [18] | T.X. Yang, X.Y. Guo, H. Wang, et al., Au dotted magnetic network nanostructure and its application for on-site monitoring femtomolar level pesticide, Small 7 (2014) 1325-1331. |
| [19] | A.D. Strickland, C.A. Batt, Detection of carbendazim by surface-enhanced Raman scattering using cyclodextrin inclusion complexes on gold nanorods, Anal. Chem. 81 (2009) 2895-2903. |
| [20] | X. Wang, Y.P. Du, H. Zhang, et al., Fast enrichment and ultrasensitive in-situ detection of pesticide residues on oranges with surface-enhanced Raman spectroscopy based on Au nanoparticles decorated glycidyl methacrylate-ethylene dimethacrylate material, Food Control 46 (2014) 108-114. |
| [21] | G. Frens, Controlled nucleation for the regulation of the particle size in monodisperse gold suspensions, Nat. Phys. Sci. 241 (1973) 20-22. |
| [22] | X.B. Wang, R.M. Wu, M.H. Liu, et al., Laser Raman spectrum analysis of carbendazim pesticide, Spectrosc. Spect. Anal. 34 (2014) 1566-1570. |
| [23] | A. Ü nal, B. Eren, FT-IR, dispersive Raman, NMR, DFT and antimicrobial activity studies on 2-(thiophen-2-yl)-1H-benzo[d]imidazole, Spectrochim. Acta, A: Mol. Biomol. Spectrosc. 114 (2013) 129-136. |
| [24] | D. Fan, X.Z. Gan, Y.Y. Lu, et al., Dissipation dynamics of carbendazim in tea, J. Agro- Environ. Sci. 24 (2005) 298-300. |
| [25] | P.A. Devi, M. Paramasivam, V. Prakasam, Degradation pattern and risk assessment of carbendazim and mancozeb in mango fruits, Environ. Monit. Assess. 187 (2015) 4142. |