 2015, Vol.26


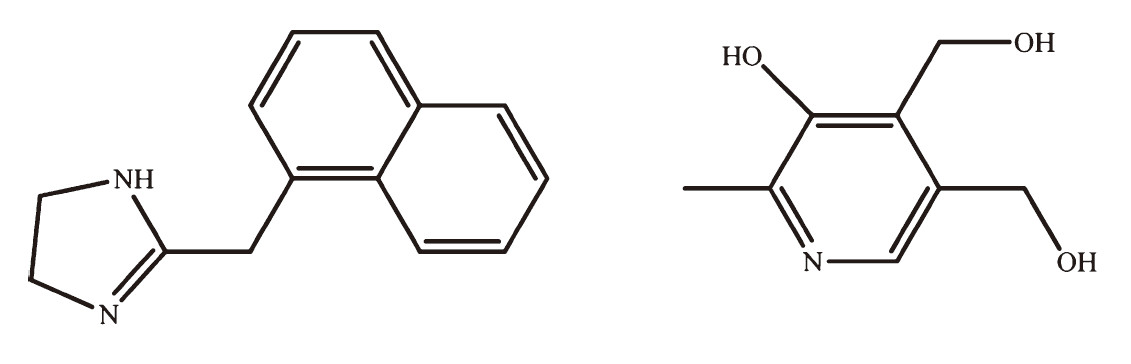
Second-order calibration methodology with attractive "secondorder advantage" has become a research hotspot in current chemometric domain and has been widely accepted in many scientific fields [1, 2, 3, 4]. Our laboratory has reported some work about the determination of multi-components in complex samples using second-order calibration methods [5, 6, 7, 8]. Naphazoline hydrochloride (NAP,Fig. 1) [2-(naphthalene-1-yl-methyl)-4,5- dihydro-1H-imidazole hydrochloride] is a decongestant,which acts on a-adrenergic receptors in the arterioles of the conjunctiva to produce vasoconstriction,resulting in decreased conjunctival congestion [9]. Pyridoxine hydrochloride (VB6,Fig. 1) [5-hydroxy- 6-methyl-3,4-pyridinedimethanol] is a water-soluble vitamin and primarily involved in the metabolism of amino acid carbohydrate and fat [10]. Several pharmaceuticals containing the two active ingredients are currently commercialized as eye drops in China [11]. In order to keep the quality of preparations high,it is essential to quantitatively determine NAP and VB6 in the eye drops. So far, no analytical method has been reported for the simultaneous analysis of NAP and VB6 in the eye drops. High performance liquid chromatographic (HPLC) and liquid chromatography-tandem mass spectrometry (LC-MS/MS) methods were reported for individual determination of NAP or VB6 in pharmaceutical preparations [12, 13, 14]. However,these methods are complicated and need expensive instruments. In addition,each eye drop includes various excipients that sometimes interfered with determination. This report describes a simple,sensitive and rapid method for the direct and simultaneous determination of NAP and VB6 in commercial eye drops products using excitation-emission matrix fluorescence coupled with second-order calibration based on alternating trilinear decomposition (ATLD) algorithm.

|
Download:
|
| Fig. 1.The chemical structures of NAP and VB6. | |
NAP and VB6 were purchased from the National Institute for Control of Pharmaceutical and Biological Products (Changsha, China). The eye drop samples,Xinledun (XLD) and Shanliang (SL),were made in China and purchased from local drug stores. The active ingredients were labeled (per 10 mL) as 0.3 mg of NAP and 5.0 mg of VB6. The standard solutions of NAP (0.10 mg mL-1) and VB6 (0.10 mg mL-1) were prepared by dissolving corresponding standard analyte with ultra-pure water in 10 mL volumetric flasks as the stock solutions. The stock solutions were stored in a refrigerator at 4 °C. The water was prepared with a Milli-Q water purification system (Aquapro,China).
The working solutions were prepared by appropriate dilution of the stock solution in ultra-pure water. In terms of the linear analytical ranges of NAP and VB6,14 samples (8 for calibration plus 2 for actual samples in triplicate) were prepared for the determination of NAP and VB6. The first eight samples contained NAP in the concentration range from 0.03 μg mL-1 to 0.80 μgmL-1 and VB6 in the concentration range from 0.2 μgmL-1 to 3 μgmL-1. The concentrations of the calibration sets are displayed in Table 1. 1 mL of each commercial eye drop was transferred into a 10 mL volumetric flask and diluted with ultra-pure water. Further dilution was done with ultra-pure water to reach a concentration of 0.12 μg mL-1 of NAP and 2.0 μg mL-1 of VB6 in triplicate.
| Table 1 Concentrations of eight calibration samples. |

All fluorescence measurements were performed on an F-7000 fluorescence spectrophotometer (HITACHI,Tokyo,Japan) equipped with a xenon lamp. All measurements were recorded in a 1.0 cm quartz cell. The spectra were obtained by scanning the mixture standard solutions recording at the excitation wavelengths in the range from 200 nm to 380 nm at regular steps of 2.0 nm and emission wavelengths in the range from 280 nm to 550 nm at regular steps of 3.0 nm. Excitation and emission slit widths were both set to be 5 nm,the scan rate was 12,000 nm min-1,and the detector voltage was 550 V. Under the chemical conditions mentioned above,each sample can obtain a two-way data array of size 91 × 91. All computer programs were written in MATLAB, and all calculations were carried out on a personal computer with Windows 7 operating system. All glassware was rinsed with doubly distilled water before use.
3. Theory 3.1. Trilinear component model for second-order calibrationIn the second-order calibration,the noted trilinear component model proposed by Harshman [15] and Carol and Chang [16] has been widely accepted,owing to its consistency with the Beer’s law in chemistry. The excitation-emission matrix (EEM) fluorescence at I excitation wavelengths and J emission wavelengths for K samples can get a three-way data array X. This three-way data array has an internally mathematical structure called trilinear, which can be depicted as follows:
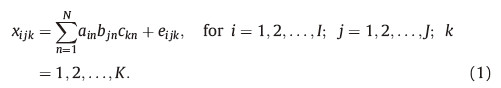
where xijk,the element of X,is the fluorescent intensity of sample k at excitation wavelength i and emission wavelength j,ain is the element (i,n) of an I × N matrix A with normalized excitation spectra of the N species in K samples; bjn is the element (j,n) of a J × N matrix B with normalized emission spectra of the N species in K sample; ckn is the element (k,n) of a K × N matrix C with relative concentrations of the N species in K samples; and eijk represents the residual element of an I × J × K three-way residual array,E. N denotes the number of factors,which should be considered as the total number of fluorescing species,including the components of interest and the background as well as uncalibrated interferences.
A typical property of X is that it can be uniquely decomposed, which can provide access to spectral profiles (A and B) and the relative concentrations (C) of individual components in K samples, even in the presence of chemically unknown interferences. The property is well-known as the "second-order advantage".
3.2. ATLD methodATLD method,developed by Wu et al. in 1996 [17],is one of the most commonly used methods for processing second-order data. ATLD algorithm alternately minimizes the following three objective functions (2)-(4) based on an alternating least-squares principle and the Moore-Penrose generalized inverse computations with truncated singular value decomposition (SVD) to update the qualitative profiles (A and B) and the relative concentration (C) of individual components until a certain stopping criterion is satisfied,usually ε = 10-6,calculated according to Eq. (5).
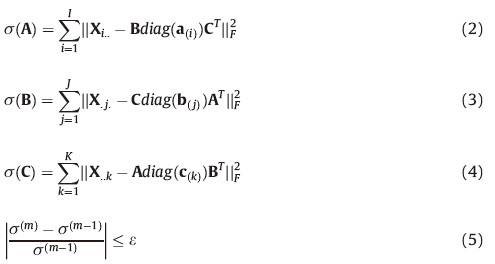
The ATLD method holds the advantages of fast convergence, being insensitive to excessive factors and more robust as the introduction of Moore-Penrose pseudo-inverse computation in the iterative procedures compared to the traditional PARAFAC algorithm. More details about ATLD and its comparison with other algorithms can be found in our previous works [18, 19].
4. Results and discussionThe first- and second-order Rayleigh scattering that partly overlaps with the signals of NAP and VB6 and the Raman scattering that even runs throughout it make the data analysis rather difficult. When selecting a rectangular area without Rayleigh and Raman scattering,it will result in losing a great deal of information of the samples or even lead to erroneous results. So a method for dealing with this problem was taken [20]. Fig. 2 shows that Rayleigh and Raman scattering were removed from the raw data and then the missing values were renewedly repaired using one-dimensional interpolations. In the interpolation method,the width of the scatter areas must be assessed. Very large widths will cause some uncertainty in the interpolated area whereas too narrow widths will bias the solution because scatter will be included. Approximately 1.5 times of the visually assessed scatter area was removed in order to completely remove the scatter values. For the current experimental data set,±12,±0,±20 were used for first-order Rayleigh,Raman and second-order Rayleigh scatter areas,respectively. Fig. 2(a) presents the original three-dimensional spectra of the calibration sample C08. The spectra then can be seen as Fig. 2(b) after substituting the first-order and second-order Rayleigh scattering and Raman scattering as missing,and Fig. 2(c) corresponds to the threedimensional spectra of C08 which had been handled by the interpolation method [20]. All the data obtained had been handled by the same data treatments by substituted Rayleigh and Raman scattering as fitted value using the interpolation method [20, 21]. More details about the theory of interpolation have been discussed in the relevant references [20].

|
Download:
|
| Fig. 2.Excitation–emission spectra of sample C08. (a) Represents the original spectrum, (b) illustrates the spectrum after removal of the Rayleigh and Raman scattering, and (c) shows the spectrum had been handled by the interpolation method. | |
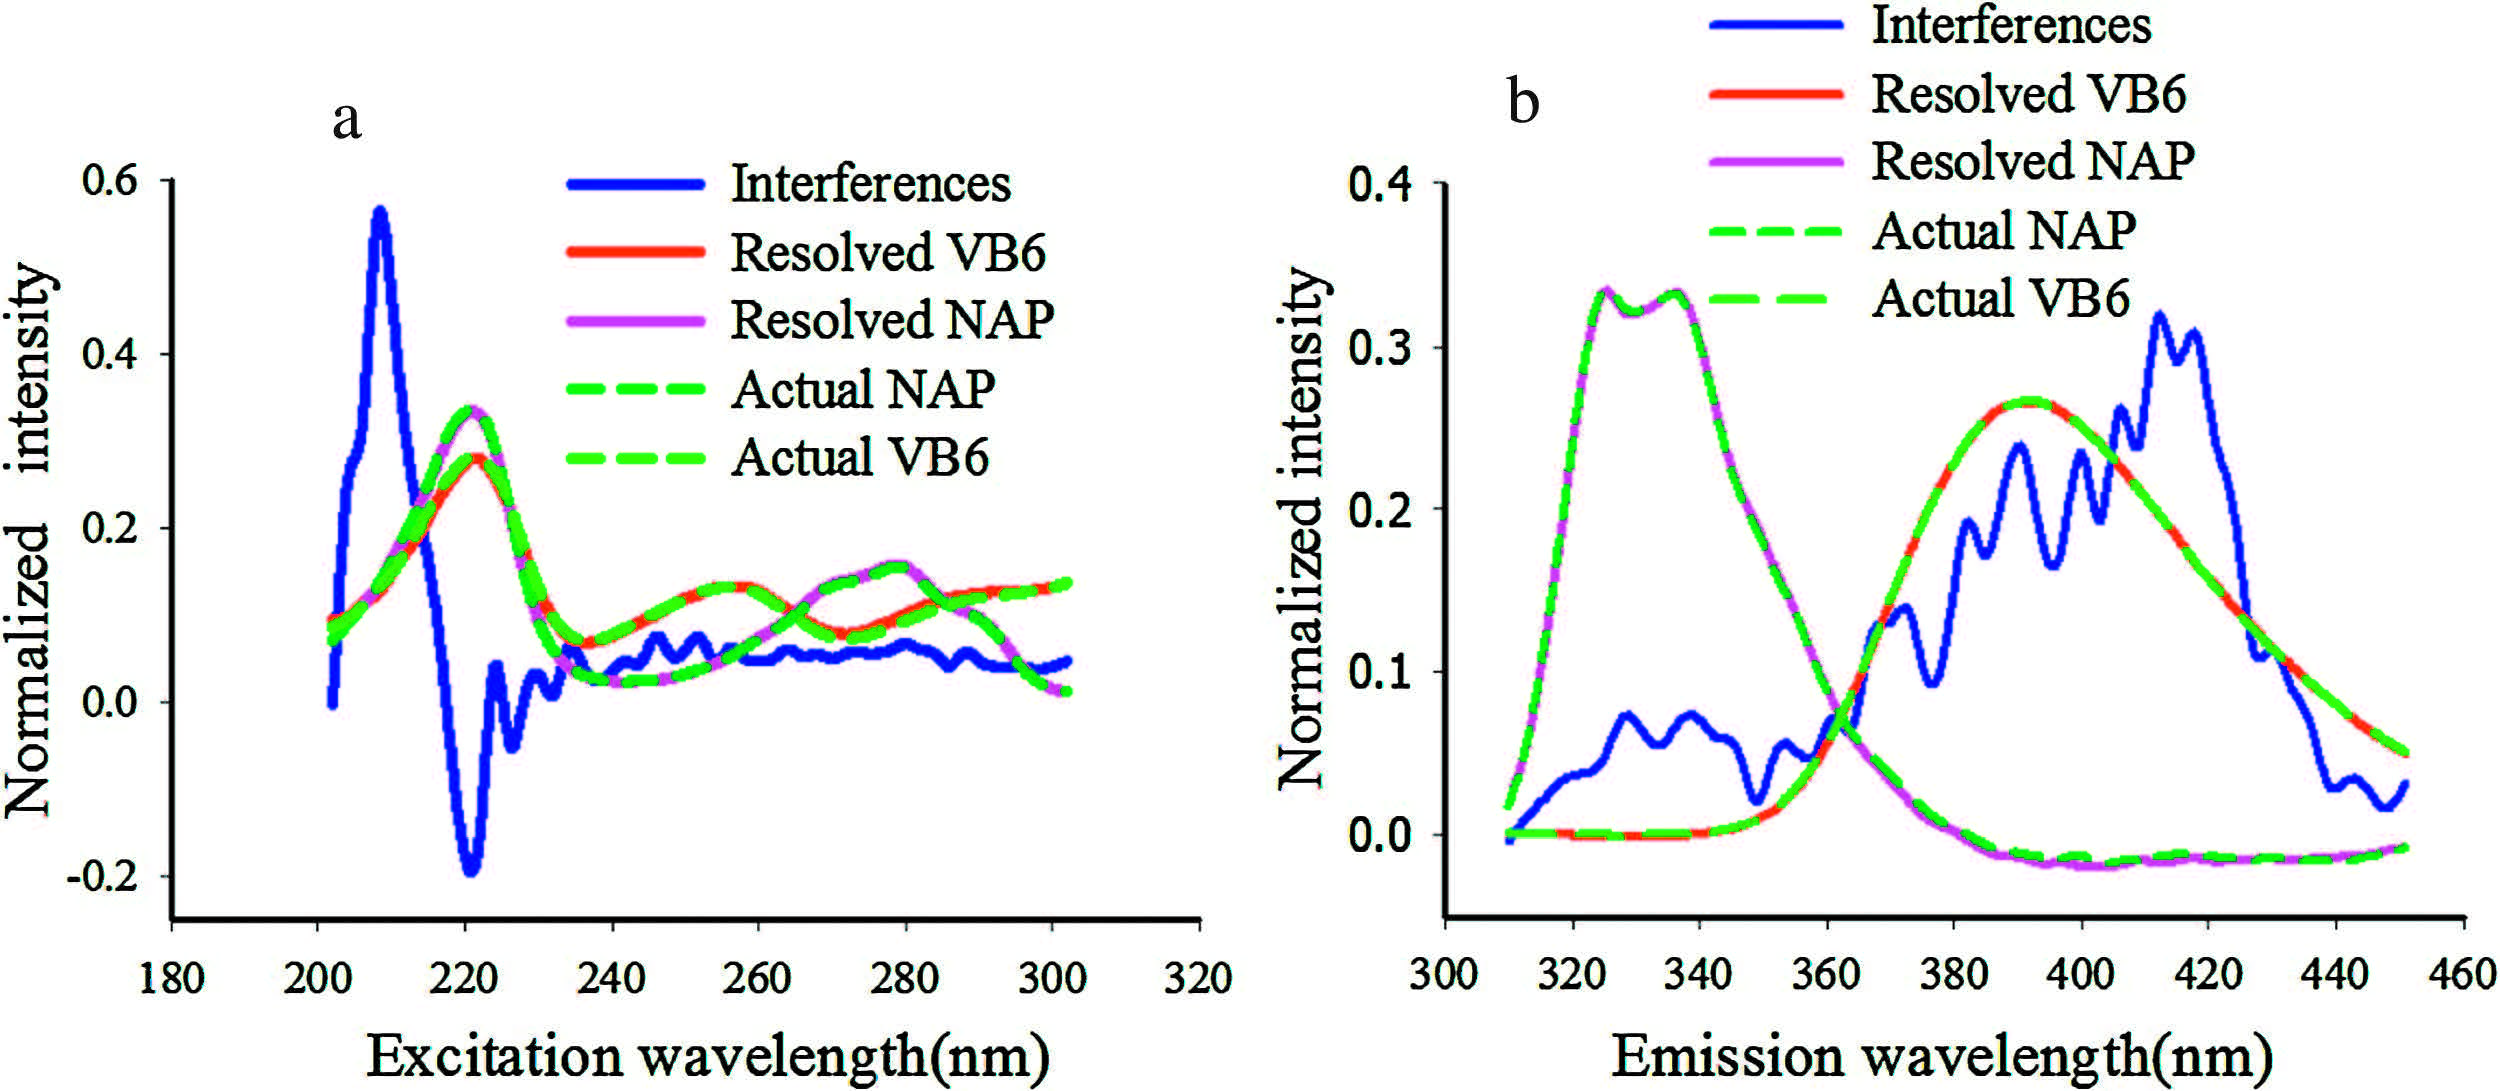
In second-order calibration,estimation of the number of components is of great importance. In this work,the number of components N = 3,obtained from the core consistency diagnostic [22] was selected for quantitative analysis of NAP and VB6 by using the ATLD method. Fig. 3 shows the resolved spectral profiles and corresponding actual ones from the decomposition of the excitation-emission matrix fluorescence data array obtained for both the calibration and predicted samples by using ATLD. The spectral profiles associated with the excitation mode were shown in Fig. 3(a) and the spectral profiles associated with the emission mode were shown in Fig. 3(b). These normalized excitation and emission spectral profiles were collected into the matrices A and B,respectively. The obtained contents of NAP and VB6 in XLD and SL are 0.140 μg mL-1, 1.956 μg mL-1 and 0.134 μg mL-1,1.932 μg mL-1,respectively, which were consistent with the labeled contents 0.120 μg mL-1 and 2.000 μg mL-1.

|
Download:
|
| Fig. 3.Actual and resolved normalized excitation spectra (a) and normalized emission spectra (b). | |
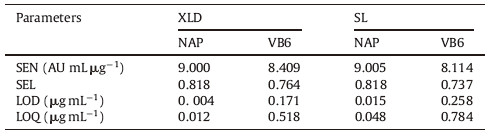
To further confirm the feasibility and reliability of our proposed strategy,the same batch samples were analyzed by LC-MS/MS method. Take the SL eye drops as an example,the contents of NAP and VB6,0.134 μg mL-1 and 1.932 μgmL-1,were quite similar with 0.147 μg mL-1 and 1.875 μg mL-1 obtained by MRM based on LC-MS/MS method. T-test demonstrated that there are no significant differences between the prediction results of the two methods. The experimental results of the SL eye drops obtained from different analytical approaches are listed in Table 2. Considering the disadvantages of high-cost and complicated conditions optimization,we can conclude that the performances of the proposed method are better than those of MRM method to some extent. In addition,we calculated the figures of merit including SEN [23],SEL [24],LOD [25] and LOQ [25]. As shown in Table 3,the parameters indicated that the proposed method could give satisfactory quantitative results.
| Table 2 Determination results of NAP and VB6 in SL eye drops. |

| Table 3 Statistical validation results for determination of NAP and VB6 in commercial eye drops. |
The method described in this paper for the simultaneous determination of NAP and VB6 in commercial eye drops was found to be simple,sensitive,accurate,rapid and economical. In addition, the proposed strategy could allow for direct concentration determination of NAP and VB6 without any pretreatment,even in the presence of unknown natural fluorescent interferences and seriously overlapped peaks. Thus,it is expected that the use of EEM coupled with second-order calibration method is a promising tool for fast industrial quality control and pharmaceutical analysis.
AcknowledgmentsThe authors would like to acknowledge the financial supports from the National Natural Science Foundation of China (No. 21175041),the National Basic Research Program of China (No. 2012CB910602),and the Foundation for Innovative Research Groups of NSFC (No. 21221003).
| [1] | A. Hierlemann, R. Gutierrez-Osuna, Higher-order chemical sensing, Chem. Rev. 108 (2008) 563-613. |
| [2] | G.M. Escandar, A.C. Olivieri, N.K.M. Faber, et al., Second-and third-order multivariate calibration: data, algorithms and applications, Trends Anal. Chem. 26 (2007) 752-765. |
| [3] | J.H. Christensen, A.B. Hansen, J. Mortensen, O. Andersen, Characterization and matching of oil samples using fluorescence spectroscopy and parallel factor analysis, Anal. Chem. 77 (2005) 2210-2217. |
| [4] | S.S. Li, H.L. Wu, Y.J. Liu, H.W. Gu, R.Q. Yu, Simultaneous determination of tyrosine and dopamine in urine samples using excitation-emission matrix fluorescence coupled with second-order calibration, Chin. Chem. Lett. 24 (2013) 239-242. |
| [5] | H.W. Gu, H.L. Wu, Y.J. Liu, et al., Simultaneous determination of metoprolol and ahydroxymetoprolol in human plasma using excitation-emission matrix fluorescence coupled with second-order calibration methods, Bioanalysis 4 (2012) 2781-2793. |
| [6] | H.Y. Fu, H.L. Wu, J.F. Nie, et al., Highly sensitive fluorescence quantification of irinotecan in biological fluids with the aid of second-order advantage, Chin. Chem. Lett. 21 (2010) 1482-1486. |
| [7] | L.Q. Ouyang, H.L. Wu, Y.J. Liu, et al., Simultaneous determination of metronidazole and tinidazole in plasma by using HPLC-DAD coupled with second-order calibration, Chin. Chem. Lett. 21 (2010) 1223-1226. |
| [8] | X.L. Yin, H.L. Wu, X.H. Zhang, et al., Simultaneous determination of irinotecan and its metabolite 7-ethyl-10-hydroxycamptothecin in biological fluids using excitation- emission matrix fluorescence coupled with second-order calibration method, Acta Chim. Sin. 71 (2013) 560-566. |
| [9] | S. Ghoreishi, M. Behpour, M. Nabi, A novel naphazoline-selective membrane sensor and its pharmaceutical applications, Sens. Actuators B: Chem. 113 (2006) 963-969. |
| [10] | P.F. Jin, J. Ma, X.J. Wu, et al., Simultaneous determination of chondroitin sulfate sodium, allantoin and pyridoxine hydrochloride in pharmaceutical eye drops by an ion-pair high-performance liquid chromatography, J. Pharm. Biomed. Anal. 50 (2009) 293-297. |
| [11] | H. Okamoto, A. Uetake, R. Tamaya, et al., Simultaneous determination of eleven ingredients in ophthalmic solutions by cyclodextrin-modified micellar electrokinetic chromatography with tetrabutylammonium salt, J. Chromatogr. A 888 (2000) 299-308. |
| [12] | T. Saito, S. Morita, I. Kishiyama, et al., Simultaneous determination of dibucaine and naphazoline in human serum by monolithic silica spin column extraction and liquid chromatography-mass spectrometry, J. Chromatogr. B 872 (2008) 186-190. |
| [13] | C.K. Markopoulou, K.A. Kagkadis, J.E. Koundourellis, An optimized method for the simultaneous determination of vitamins B1, B6, B12, in multivitamin tablets by high performance liquid chromatography, J. Pharm. Biomed. Anal. 30 (2002) 1403-1410. |
| [14] | M. Van der Ham, M. Albersen, T.J. de Koning, et al., Quantification of vitamin B6 vitamers in human cerebrospinal fluid by ultra performance liquid chromatography- tandem mass spectrometry, Anal. Chim. Acta 712 (2012) 108-114. |
| [15] | R.A. Harshman, Foundations of the PARAFAC Procedure: Models and Conditions for an “Explanatory” Multimodal Factor Analysis, UCLA Working Papers in Phonetics, University Microfilms, Ann Arbor, MI, 1970, pp. 1-84. |
| [16] | J.D. Carroll, J.J. Chang, Analysis of individual differences in multidimensional scaling via an n-way generalization of “Eckart-Young” decomposition, Psychometrika 35 (1970) 283-319. |
| [17] | H.L. Wu, M. Shibukawa, K. Oguma, An alternating trilinear decomposition algorithm with application to calibration of HPLC-DAD for simultaneous determination of overlapped chlorinated aromatic hydrocarbons, J. Chemom. 12 (1998) 1-26. |
| [18] | H.L. Wu, J.F. Nie, Y.J. Yu, R.Q. Yu, Multi-way chemometric methodologies and applications: a central summary of our research work, Anal. Chim. Acta 650 (2009) 131-142. |
| [19] | H.W. Gu, H.L. Wu, X.L. Yin, et al., Multi-targeted interference-free determination of ten b-blockers in human urine and plasma samples by alternating trilinear decomposition algorithm-assisted liquid chromatography-mass spectrometry in full scan mode: comparison with multiple reaction monitoring, Anal. Chim. Acta 848 (2014) 10-24. |
| [20] | M. Bahram, R. Bro, C. Stedmon, A. Afkhami, Handling of Rayleigh and Raman scatter for PARAFAC modeling of fluorescence data using interpolation, J. Chemom. 20 (2006) 99-105. |
| [21] | Y. Li, H.L. Wu, Y.J. Yu, et al., A novel method to handle Rayleigh scattering in threeway excitation-emission fluorescence data, Anal. Methods 4 (2012) 3987-3996. |
| [22] | R. Bro, H.A.L. Kiers, A new efficient method for determining the number of components in PARAFAC models, J. Chemom. 17 (2003) 274-286. |
| [23] | A.C. Olivieri, Computing sensitivity and selectivity in parallel factor analysis and related multiway techniques: the need for further developments in net analyte signal theory, Anal. Chem. 77 (2005) 4936-4946. |
| [24] | A.C. Olivieri, N.K.M. Faber, A closed-form expression for computing the sensitivity in second-order bilinear calibration, J. Chemom. 19 (2005) 583-592. |
| [25] | A.C. Olivieri, Analytical figures of merit: from univariate to multiway calibration, Chem. Rev. 114 (2014) 5358-5378. |