 2015, Vol.26


b Department of Mathematics and Physics, Beijing Institute of Technology Petrochemical, Beijing 102617, China;
c Department of Chemistry, The Hongkong University of Science and Technology, Clear Water Bay, Kowloon, HongKong, China
Gold nanoparticles (AuNPs) have attracted worldwide interests due to their surface chemical activities,high surface-to-volume ratio and good biological compatibility,and have been extensively reported as the substrate in surface-enhanced Raman scattering (SERS) for advantages [1, 2, 3, 4, 5]. As we know,this technique has become a powerful tool for molecule detection,sensor application, surface process study as a branch of Raman spectroscopy and an important characterization tool in the fields of nanoscience [6, 7]. Uniform arrays of gold nanoparticles with many tiny branches have larger specific surface area,tips often lead to the formation of sharp peaks and valleys [8]. The tips are potential "hot spots" for localized near-field enhancements [9] and could potentially enhance the Raman scattering on the highly branched gold nanostructures. So fabrication of SERS substrates with specific morphology and high average enhancement factor (EF) over relatively large areas arouse an explosion of interest for them.
Tuan’s group had synthesized gold nanostars with varying sizes and their use in surface-enhanced Raman scattering (SERS) measurements with the enhancement factor was estimated as 5 × 10³ for detecting p-mercapto benzoic acid (PMBA) [10]. In Guo Lin group,tetrahexahedral (THH) and elongated tetrahexahedral (ETHH) gold nanocrystals (NCs) were introduced to experimentally investigate enhancement factors of SERS [11]. Zhixun Luo and coworkers also researched the Raman scattering about Au nanoparticles [12, 13]. Because enhancement factor (EF) can be estimated to measure SERS properties and related to the shapes,the proper morphological controlling for gold nanomaterials are important. Herein,regular arrays of 130 nm gold nanoparticles with different sharp tips have been fabricated for the high enhancement factor for SERS. The seed-mediated growth method was economical and repeatable. The roughness of gold nanoparticles was effected by the surfactant CTAB and CTAC,which has rarely,to the best of our knowledge,been reported. The near-field enhancement properties of coarse and smooth gold nanoparticles (NPs) were also investigated experimentally through SERS using p-mercapto benzoic acid (PMBA) as a probe molecule,the experimental results show that the enhancement factor can be as high as 106.
2. ExperimentalHydrochloroauric acid tetrahydrate (HAuCl4·4H2O,Shenyang Jinke Chemical Reagent Works),sodium borohydride (NaBH4, Guangdong Guanghua Chemical Factory Co.,Ltd),dimethylsulfoxide (DMSO,Beijing Chemical Works,500 mL),ethylene glycol (EG,Xilong Chemical Industry Co.,Ltd,500 mL),cetyltrimethylammonium bromide (CTAB,Tianjin Fine Chemical Industry Research Institute),cetyltrimethylammonium chloride (CTAC, Tianjin Jingke Fine Chemical Industry Research Institute),Polyvinyl Pyrrolidone (MW 58000,Alfa Aesar),ascorbic acid (AA,Beijing Aoboxing Biological Technology Limited Liability Company), 4-Mercaptobenzoic acid (PMBA,MW 154,Acros Organics).
The solvent of all experiments was dimethyl sulfoxide. The 50 μLCTAC(0.01mol/L) solution and 50 μLHAuCl4 (5 × 10⁻⁴ mol/L) solution were mixed together,and then 6 μL NaBH4 (0.01 mol/L) solution was injected in the above mixture solution. The obtained solution was diluted to 50 times to get the CTACcapped seed solution. To fabricate the coarse AuNPs,12 mL of seed solution was added in the growth solution containing CTAB (0.2 mol/L,6.75 μL),Polyvinyl Pyrrolidone (PVP,0.001 mol/L, 1.35 mL),HAuCl4 (5 × 10⁻⁴ mol/L,2.7 mL),glycol (7 mL) and ascorbic acid (0.05 mol/L,100 mL). This solution was put in a 30 °C water bath overnight. The coarse AuNPs were washed three times by centrifugation (12,000 rpm,5 min). To fabricate the smooth AuNPs,the procedure was the same as method of the coarse Au nanoparticles except for replacing the CTAB of growth solution with CTAC.
The SERS substrate was prepared by dropping 10 μL of the above-prepared sample onto a carefully cleaned silicon plate, which was allowed to dry naturally in air. The substrate was immersed into 1 × 10⁻⁴ mol/L p-mercapto benzoic acid (PMBA) ethanol solution and for 30 min. After drying at room temperature, it was then rinsed with deionized water and absolute ethanol several times to remove the free PMBA molecules.
Scanning electron microscopy (SEM) images were carried out with a Hitachi S-4800. High-resolution transmission electron microscopy (HRTEM) images were performed with a JEOL JEM- 2100 F microscope,Raman spectra were recorded on a Jobin Yvon (Laboratory RAM HR800) spectrometer employing a 647-nm laser line as the excitation source. The Raman band of a silicon wafer at 520 cm-1 was used to calibrate the spectrometer. The spectra were obtained by using a 50 × objective lens to focus the laser beam onto a spot with ~1.9 μm2.
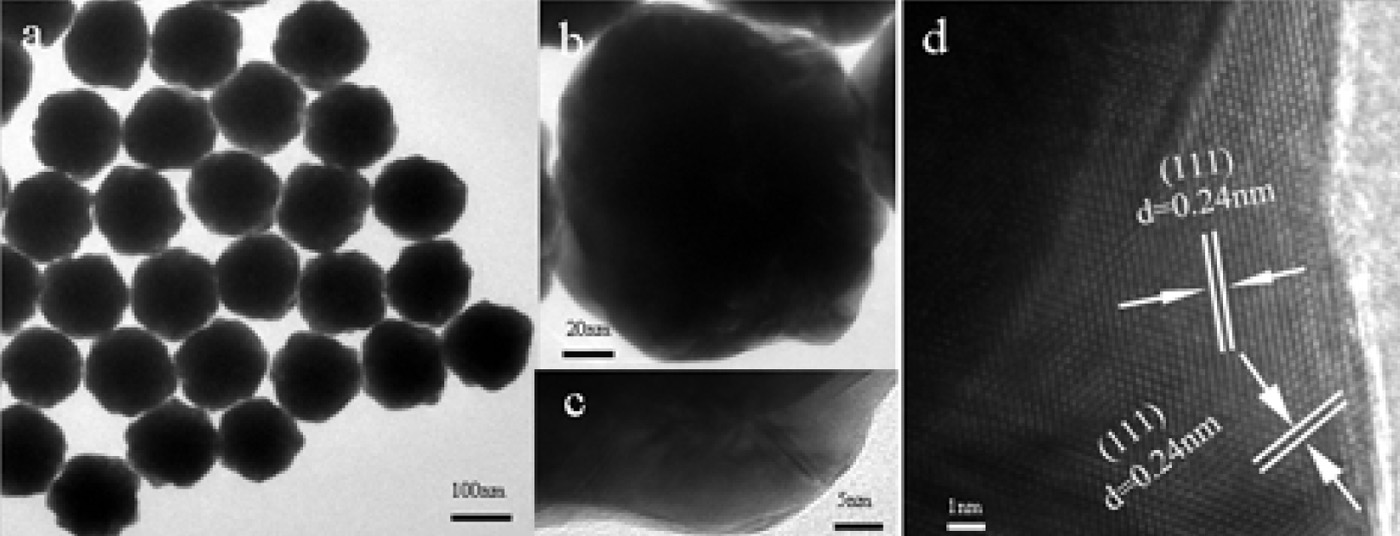
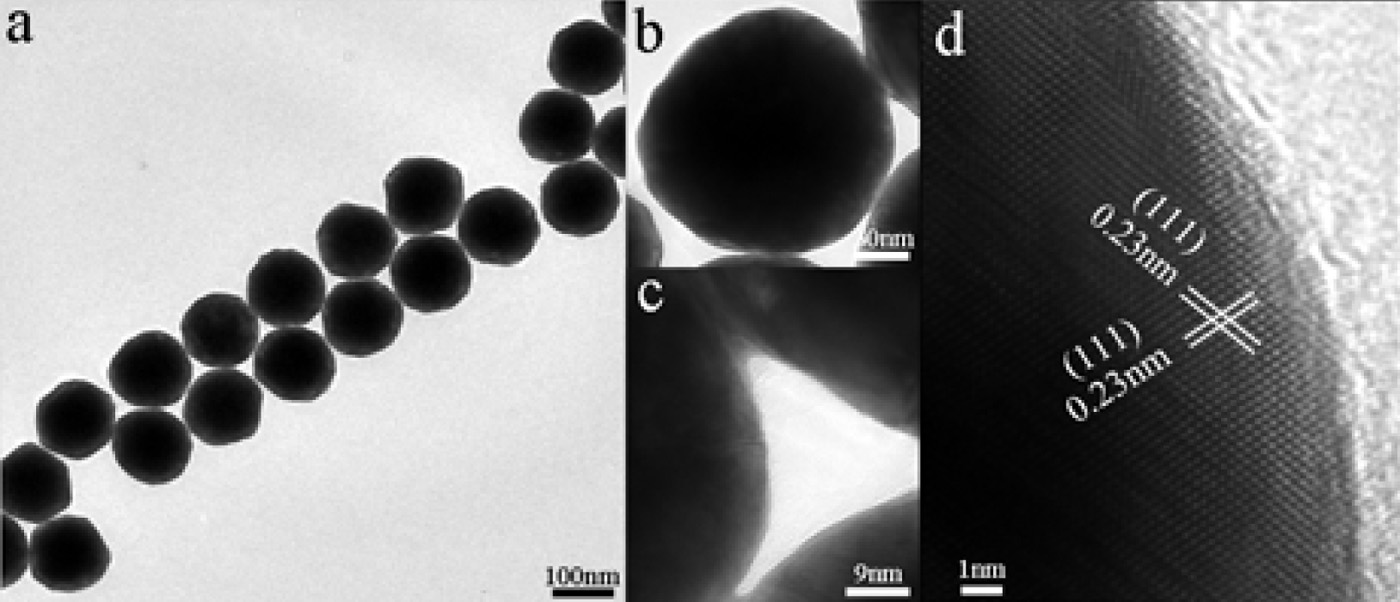
3. Results and discussionSEM images of the as-prepared coarse and smooth AuNPs are shown in Fig. 1. It can be clearly seen that the products are highly ordered arrangement (Fig. 1a and d) and relatively uniform quasi spherical nanostructure with diameter around 130 nm (Fig. 1b and e). From the amplified image of nanoparticles (Fig. 1b and e), different roughness of two nanoparticles could be distinguished clearly. To gain more insight into the morphologies of nanoparticles with the different roughness,the surface of the coarse Au nanoparticles and smooth Au nanospheres were computed using the 3-dimensional finite difference time-domain (3D-FDTD) method,respectively (see Fig. 1c and f). Further structural characterization was carried out using transmission electron microscopy (TEM). From TEM images,it can be clearly found that AuNPs are well-dispersed without aggregation,indicating the colloidal stability of these dispersions. Typical low- and highmagnification TEM images of the coarse AuNPs and smooth AuNPs, which show uniform and well-ordered quasi spheres with a diameter of 130 nm,were presented in Figs. 2a,3a and 2b,3b, respectively. The HRTEM image (Fig. 2d) clearly reveals the good crystalline and lattice fringes,the lattice fringe spacing marked with 0.24 nm is corresponded to the (1 1 1) planes of face-centered cubic structure of Au (JCPDS No. 65-2870). The same case is shown in Fig. 3d.

|
Download:
|
| Fig. 1.(a, b) SEM images of low and high magnification coarse Au nanoparticles, (d, e) SEM images of low and high magnification smooth Au nanospheres, (c, f) 3D-FDTDsimulation models for the coarse Au nanoparticle and smooth Au nanospheres. | |

|
Download:
|
| Fig. 2.(a) TEM images of the as-synthesized coarse Au nanoparticles, (b) TEM image of single coarse Au nanoparticle, (c) partial amplification of single Au nanoparticle, (d) the HRTEM image of coarse Au nanoparticle. | |

|
Download:
|
| Fig. 3.(a) TEM images of the as-synthesized smooth Au nanoparticles, (b) TEM image of single smooth Au nanoparticle, (c) partial amplification of single Au nanoparticle, (d) the HRTEM image of smooth Au nanoparticle. | |
Fig. 4 shows X-ray diffraction (XRD) patterns of the as-prepared coarse and smooth AuNPs with size of 130 nm. The face-centered cubic (fcc) structure (JCPDS card No. 65-2870) of gold crystal diffraction pattern was recognized from the peak in Fig. 4,which can be indexed as the (1 1 1),(2 0 0),(2 2 0),(3 1 1) and (2 2 2)- crystallographic planes of fcc gold nanocrystals. No impurity phases are detected,indicating the formation of pure and highly crystallized Au.

|
Download:
|
| Fig. 4.XRD patterns of Au nanoparticles: (a) coarse Au nanoparticles, (b) smooth Au nanoparticles. | |
Other experiments are shown in Supporting information. From the statistical diagram of the size distributions of these two nanoparticles in Fig. S1 in Supporting information,the peak widths of the two nanoparticles were narrow which means the Au nanoparticles were uniform. And the size of the coarse nanoparticles was slightly larger than the smooth,so the larger size may lead to the slightly red shift for the coarse nanoparticles compared with the smooth nanoparticles in the UV-vis spectra shown in Fig. S2 in Supporting information. Other control experiments,such as changing the volume of reducing agent ascorbic acid (AA),but keep the concentration of ascorbic acid (AA) and other parameters constant,is shown in Fig. S3 in Supporting information,the particle size increases with the increasing ascorbic acid (AA). The increasing volumes of ascorbic acid (AA) helps more gold ion deposit on the small Au nanoparticles to be reduced to the larger size of nanoparticles. As increasing the ratios of PVP and CTAB,the particle size also decreases as shown in Fig. S4 in Supporting information,and the size from 48.8 nm of Fig. S4a to 36.6 nmof Fig. S4b. Increasing the volume of EG,when the fixed EG volume was exceeded,the morphology of nanoparticles was remained unchanged in Fig. S5 in Supporting information. The morphology of nanoparticles was affected a little by the solvent. Besides,the size of nanoparticles decreases with the increasing volume of gold seeds as shown in Fig. S6 in Supporting information. The less amount of gold seeds grown up to larger size of nanoparticles as the gold ions in the solution being reduced and deposited on them. While under the condition of the same concentration of HAuCl4 solution,more amount of gold seeds easily grown into smaller size of nanoparticles. The parameter,which affected roughness of nanoparticles,was discussed in the below.
3.1. The influence factors of roughnessDuring the preparation of the coarse and smooth AuNPs,CTAB/ PVP and CTAC/PVP was served as duple surfactant respectively. In order to understand the influence factors of the surface roughness for AuNPs,only CTAB and CTAC were used as single surfactant during the reaction to prepare AuNPs,seperatedly. The TEM image of the as-synthesized Au nanoparticles by using CTAB as the only surfactant is shown in Fig. 5a. The surface morphology of the nanoparticles is uneven,the reason for the coarse morphology was generated by many tiny tips and branches. In comparison,the surface of Au nanoparticles when using CTAC as the only surfactant (as shown in Fig. 5b) is relatively smooth. It is known that PVP is a water soluble [14] nontoxic polymer which extensively has been used in synthesizing many types of colloidal nanocrystals. Based on Fig. 4,the absence of PVP in the growth solution resulted in nonuniformity of nanoparticles,the experimental results revealed that CTAB and CTAC were the key factors which led to the different surface roughness of Au nanopartcles. The PVP,which contains an amide group in its monomer,has been widely used in the chemical synthesis of many types of colloidal nanocrystals to protect the product from agglomeration,and plays a very important role in the synthesis for its ability to form coordination binding with a variety of metal surfaces. If no PVP is used,the irregular shape nanoparticles were easily obtained [15]. Such different morphologies obtained with CTAB and CTAC have been ascribed to the different ability of bromide and chloride ions to bind on Au surfaces [16, 17]. The formation of such different roughness structure could be attributed to the weaker oxidative etching power for the Br- in CTAB as compared to the Cl- in CTAC in controlling the crystallinity of the nuclei and seeds,thus the morphology of the resulting Au nanocrystals,while the CTA+ (hexadecyltrimethylammonium cation) serves as a stabilizer to prevent the nuclei and seeds from aggregation [18]. The particles stabled by CTAC are subjected to oxidation etching more serious than by CTAB,so the surface of particles stablized by CTAC compared is smoother than that of by CTAB.

|
Download:
|
| Fig. 5.TEM images of the as-synthesized Au nanoparticles: (a) coarse Au nanoparticles with CTAB; (b) smooth Au nanoparticles with CTAC. | |
The as-prepared coarse and smooth Au nanostructures were used to investigate the SERS behaviors. PMBA was selected as the probe molecule to investigate the SERS activity of the as-prepared coarse AuNPs and smooth AuNPs,because it is a commonly-used molecule in SERS studies [11]. Fig. 6 presents the normal Raman spectra of solid PMBA,PMBA adsorbed on the coarse AuNPs and smooth AuNPs. Compared with normal Raman spectrum of solid PMBA shown in Fig. 6c,we found that the Raman shift was changed and the Raman intensity was enhanced on the two Au substrates in the SERS spectra. As shown in Fig. 6,the predominant bands in the spectrum of solid PMBA are located at 1099,1183 and 1594 cm-1, which are assigned to a1 modes of νCS,δCH,and νCC,respectively. In SERS spectrum,the band νCS shift from 1099 to 1076 cm-1 is due to the formation of Au-S bonding [11]. The νCC band at 1594 cm-1 shifted to 1587 cm-1 and the δCH band shifted from 1183 to 1177 cm-1 as a result of bonding and electronic structure changes. Obviously,the SERS intensity on a coarse AuNPs substrate gains larger enhancement than that of on a smooth AuNPs substrate. This result suggests that the coarse AuNPs could be used as an ideal active SERS substrate.

|
Download:
|
| Fig. 6.Raman and SERS spectra: (a) SERS spectra of PMBA absorbed on coarse Au nanoparticles; (b) SERS spectra of PMBA absorbed on smooth Au nanoparticles; (c) Raman spectra of solid PMBA. All of the spectra reported were the result of a single 1 s accumulation. | |
It is generally considered that the enhancement of a1 mode in SERS mainly originated from EM mechanism. To evaluate the enhancement activity more quantitatively,two predominant a1 bands discussed earlier in the paper were selected to determine the enhancement factor (EF) according to the following equation [9, 19]:
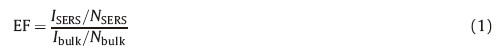
In Eq. (1),ISERS and Ibulk are the measured vibration intensity in the SERS and normal Raman spectra,respectively. Nbulk and NSERS are the molecule number of solid and adsorbed PMBA in the laser illumination volume,respectively. And Nbulk was acquired via Eq. (2):

The illuminated volume was calculated as the product of the area of the laser spot A (~1.9 μm2) and the penetration depth h of the focused laser (~15.4 μm). Considering the density (1.49 g/cm3) of bulk PMBA,Nbulk was calculated as 1.7 × 10¹¹. As for SERS samples,NSERS could be obtained via Eq. (3):
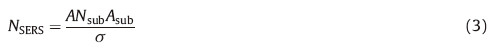
A is the area of the focal laser spot (~1.9 μm2). Asub is the occupied area of individual microparticle (~7.4 × 10⁻⁴ μm2 for the coarse AuNPs and ~5.3 × 10⁻⁴ μm2 for the smooth AuNPs) and σ represents the surface area occupied by one adsorbed PMBA molecule about 0.3 nm2 according to the literature [20]. Assuming that a layer of Au nanoparticles deposited on the substrate homogeneously,number density of AuNPs (Nsub) could be counted from the SEM figure. According to the parameters above,NSERS was finally estimated as 1.1 × 10⁷ and 8.4 × 10⁶ for smooth and coarse AuNPs samples,respectively.
By substituting the values of the variables into Eq. (1), enhancement factor (EF) of PMBA adsorbed on Au coarse and smooth gold nanoparticles was estimated to be about 3.1 × 10⁶ and 2.0 × 10⁶. Through the analysis of the results,an enhancement factor of 105~106 that was mainly contributed by electromagnetic mechanism was finally estimated.
As we know that a few molecules adsorbed on hot sites [9] contributed a most part in the strength of SERS spectrum [14]. Tips or edges on coin metal microstructures are generally considered to be of the huge enhancement and inclined to produce more hot spots [10, 11]. The different EFs of coarse nanoparticles and smooth nanoparticles may not due to different surface area,but the enhancement of ability. The higher enhancement factor (EF) for coarse nanoparticles is due to the electromagnetic field around tip. Besides,the uneven surface presented in the coarse Au nanostructure with nano-tips cause larger roughness on the surfaces, helps remain the absorbed probe molecules PMBA stable and not easy to take off form the coarse AuNPs,which facilitated to provide greater enhancement.
4. ConclusionIn conclusion,uniform coarse and smooth Au nanoparticles with surface-enhanced Raman scattering were successfully synthesized through a simple seed-mediated growth method. We have demonstrated that the roughness of gold nanoparticles was influenced by the surfactant CTAB and CTAC. The coarse and smooth Au nanoparticles with diameter about 130 nm are particularly interesting for SERS applications as they demonstrate high EFs up to 3.1 × 10⁶ and 2.0 × 10⁶ in magnitude for individual particles. In addition,with respect to the surface-enhanced Raman scattering,the results show that the coarse gold nanostructures have higher influence factor than the smooth gold nanostructures and appear to be very promising as high-performance SERS substrates for future applications.
AcknowledgmentsThis work was financially supported by the National Basic Research Program of China (No. 2010CB934700),the National Natural Science Foundation of China (Nos. 51272012,21273001, 51302208),Fundamental Research Funds for the Central Universities (No. YWF-14-HHXY-009) and Specialized Research Fund for the Doctoral Program of Higher Education (No. 20111102130006).
Appendix A. Supplementary dataSupplementary data associated with this article can be found,in the online version,at http://dx.doi.org/10.1016/j.cclet.2015.06.004.
| [1] | P.S. Kumar, I. Pastoriza-Santos, B. Rodríguez-Gonzá lez, et al., High-yield synthesis and optical response of gold nanostars, Nanotechnology 19 (2008) 015606. |
| [2] | E.C. Hao, R.C. Bailey, G.C. Schatz, J.T. Hupp, S.Y. Li, Synthesis and optical properties of "branched" gold nanocrystals, Nano Lett. 4 (2004) 327-330. |
| [3] | F. Hao, C.L. Nehl, J.H. Hafner, P. Nordlander, Plasmon resonances of a gold nanostar, Nano Lett. 7 (2007) 729-732. |
| [4] | C.L. Nehl, H.W. Liao, J.H. Hafner, Optical properties of star-shaped gold nanoparticles, Nano Lett. 6 (2006) 683-688. |
| [5] | K.B. Li, L. Clime, L.L. Tay, et al., Multiple surface plasmon resonances and near-infrared field enhancement of gold nanowells, Anal. Chem. 80 (2008) 4945-4950. |
| [6] | H. Wei, F. Hao, Y.Z. Huang, et al., Polarization dependence of surface-enhanced Raman scattering in gold nanoparticle-nanowire systems, Nano Lett. 8 (2008) 2497-2502. |
| [7] | H.R. Tang, Q.Q. Li, Y.L. Ren, et al., Surface enhanced Raman spectroscopy signals of mixed pesticides and their identification, Chin. Chem. Lett. 22 (2011) 1477- 1480. |
| [8] | J. Grand, M. Lamy de la Chapelle, J.L. Bijeon, et al., Role of localized surface plasmons in surface-enhanced Raman scattering of shape-controlled metallic particles in regular arrays, Phys. Rev. B 72 (2005) 033407. |
| [9] | J.X. Fang, S.Y. Du, S. Lebedkin, et al., Gold mesostructures with tailored surface topography and their self-assembly arrays for surface-enhanced Raman spectroscopy, Nano Lett. 10 (2010) 5006-5013. |
| [10] | C.G. Khoury, T. Vo-Dinh, Gold nanostars for surface-enhanced Raman scattering: synthesis, characterization and optimization, J. Phys. Chem. C 112 (2008) 18849- 18859. |
| [11] | P.G. Yin, T.T. You, E.Z. Tan, et al., Characterization of tetrahexahedral gold nanocrystals: a combined study by surface-enhanced raman spectroscopy and computational simulations, J. Phys. Chem. C 115 (2011) 18061-18069. |
| [12] | Z.X. Luo, Y.S. Zhao, W.S. Yang, et al., Core-shell nanopillars of fullerene C60/C70 loading with colloidal Au nanoparticles: a Raman scattering investigation, J. Phys. Chem. A 113 (2009) 9612-9616. |
| [13] | Z.X. Luo, W.S. Yang, A.D. Peng, et al., Net-like assembly of Au nanoparticles as a highly active substrate for surface-enhanced Raman and infrared spectroscopy, J. Phys. Chem. A 113 (2009) 2467-2472. |
| [14] | I. Pardiñas-Blanco, C.E. Hoppe, Y. Piñ eiro-Redondo, M. Arturo Ló pez-Quintela, J. Rivas, Formation of gold branched plates in diluted solutions of poly(vinylpyrrolidone) and their use for the fabrication of near-infrared-absorbing films and coatings, Langmuir 24 (2008) 983-990. |
| [15] | I. Washio, Y.J. Xiong, Y.D. Yin, Y.N. Xia, Reduction by the end groups of poly(vinyl pyrrolidone): a new and versatile route to the kinetically controlled synthesis of Ag triangular nanoplates, Adv. Mater. 18 (2006) 1745-1749. |
| [16] | T.H. Ha, H.J. Koo, B.H. Chung, Shape-controlled syntheses of gold nanoprisms and nanorods influenced by specific adsorption of halide ions, J. Phys. Chem. C 111 (2007) 1123-1130. |
| [17] | O.M. Magnussen, Ordered anion adlayers on metal electrode surfaces, Chem. Rev. 102 (2002) 679-726. |
| [18] | W.Y. Li, Y.N. Xia, Facile synthesis of gold octahedra by direct reduction of HAuCl4 in an aqueous solution, Chem. Asian J. 5 (2010) 1312-1316. |
| [19] | Y.L. Wang, X.Q. Zou, W. Ren, W.D. Wang, E.K. Wang, Effect of silver nanoplates on Raman spectra of p-aminothiophenol assembled on smooth macroscopic gold and silver surface, J. Phys. Chem. C 111 (2007) 3259-3265. |
| [20] | L.X. Xia, H.B. Wang, J. Wang, et al., Microwave-assisted synthesis of sensitive silver substrate for surface-enhanced Raman scattering spectroscopy, J. Chem. Phys. 129 (2008) 134703. |