


b Biophysics, University of Michigan, Ann Arbor, MI 48109, USA
Metabolomics is the study of the entirety of a metabolic profile of a given biological structure or compartment,or a representative subgroup therein. It harnesses the chemical fingerprints of cellular processes and uses them to develop real-time profiles of the state of an organism,tissue,or cell through its metabolome,which represents the total unity of the metabolites and chemical byproducts in a cell,tissue,organ,or organism,depending on the scale under study,providing an instantaneous snapshot of the physiological state of a biological compartment at the moment of sampling. Although proteomics and genomics aid metabolomic analysis,metabolomic approaches give the most holistic analysis, bearing significant promises for medical applications,from tuberculosis [1, 2, 3] to bipolar disorders [4, 5].
Bioanalytical approaches utilized inmetabolomics studies could potentially be developed into new diagnostic tests that give a more detailed understanding of disease pathogenesis,as well as better prognostic and diagnostic approaches for patient care,and have alreadybeenwell-established incancer,in general,more specifically in head and neck cancers (HNCs). In order to reach the goal of having clinical tests being replaced by metabolomics related exams for HNC,all aspects of themetabolomic process,including the selection, preparation,analysis,and interpretation of samples,must be examined,perfected,and standardized to ensure uniformity and remove variation. Detailed attention should be focused on the type, number,and time of collection of samples,as well as the storage conditions,type and stage of cancer,medications ingested,and the characteristics of the patient,such as age,diet,sex,and other extenuating circumstances [6, 7]. To eliminate statistical anomalies [8],a largenumber of control and afflicted patients must be used. All researchers need to be fully aware that the safety and the rights of thehuman subjects under study need to be protected and invariably occupy the highest priority. This is ensured by following the provisions of Good Clinical Practice,the international quality standard for clinical trials.
Metabolomics,however,can be a challenging field for this kind of analysis. The intrinsicnatureofmetabolites themselves is variedand ever-changing,with a large dynamic range,changing based on time dependency,inter-individual variation,and others [9]. Even further, meaningful changes in metabolite profiles can indicate diseases, natural physiological fluctuations,and variety in aspects such as diet,or even sample transport,freezing,and storage procedures that can change between two research groups [10]. Usable data could be obscured by these phenomena as well. Due to these issues,studies need to be under strict and reproducible conditions. Analysis is usually done using spectrometric and spectroscopic techniques for this reason,usually by mass spectrometry,nuclear magnetic resonance spectroscopy,and fluorescence spectroscopy [5]. It is crucial to painstakingly establish and follow the detailed collection and preparation protocols to standardize the data. These standard operating procedures (SOPs) are necessary for the highest accuracy of metabolomic analysis.
To improve on current metabolomic methods,a comprehensive technique would be useful as discussed herein in relation to HNC. A successful application to HNC would indicate feasibility concerning other cancers and diseases as well. An ideal technique would detect HNCearly,before other symptomsused in current diagnoses appear. This would be beneficial in treating these cancers,preventing metastasis and other complications. A screening testwould be best, which would encompass the benefits and sensitivity of current diagnostic techniques into a more cost-effective and less invasive procedure. It must have a high sensitivity,specificity to HNC, reproducibility,and ease of performance that matches current techniques and allows to be used by all. This must depend on smallmoleculemetabolic profiles,specific toHNC and detectable through fluids such as urine,saliva,and blood,or tissue,among others. Changes in the profiles and concentrations of these markers come from differing pathological conditions. Monitoring such changes allows for diagnoses and tracking treatments,due to its to-theminute profiling.
Currently,most cancer diagnostic tests use the principles of biomarkers [11] such as the prostate specific antigen (PSA),upon which metabolomics improves. Biomarkers are metabolites whose concentration is correlated to certain complex physiological parameters or states,such as diseases. Newer than the other ‘‘omics’’,genomics and proteomics [12],metabolomics uses small molecules as biomarkers instead of proteins and nucleic acids, offering new routes to identifying and quantifying biomarker metabolites. Complex physiological states may not be detectable by an individual biomarker alone,but in the concentration patterns of a group. These fingerprints found through metabolomics could greatly influence the field of oncology [13]. The most powerful technique would be a combination of all the major ‘‘omics’’ analytical data [14],but metabolomics on its own provides a more holistic offering of data as an individual group. Since this research is relatively new in the ‘‘omics’’,recent advances are only beginning to make an impact in the diagnosis and management of diseases at a clinical level.
Before medical applications can be fully realized,basic principles of metabolomics must be established. Metabolomics searches for metabolite variations that differentiate between healthy and diseased samples,providing diagnoses. It also allows a better understanding of the underlying mechanisms of a disease through determining changes inmetabolites,and discovering the reasons for these changes,monitoring the progress of the disease and giving insight into pathologywhile providing biomarkers that can diagnose the disease. Once these principles are well-established,metabolomics can progress to clinical implementation and usage. 2. Head and neck cancer (HNC) and head and neck squamous cell carcinomas (HNSCC)
HNCs encompass cancers of the mouth,throat,larynx,lip, squamous cell carcinoma,and other related diseases,including leukoplakia and periodontal disorders [15]. Head and neck squamous cell carcinomas (HNSCC) are sometimes distinguished from general HNCs. HNSCCs are cancers of the epithelium of the head and neck area. Epithelia include the outer layer of cells that make up the covering of the body surfaces,lining the cavities and surfaces of structures throughout the body,including many glands. They function in secretion,like sweats and oils for the skin, selective absorption,like the reabsorption of water,protection from bacteria and other damaging substances,and sensation. They are avascular,nourished from cells below. Many are made up of squamous cells,flat cells that are wider than they are tall,named for its scale-like appearance. Examples in the head and neck area include exterior skin,the outer layer of the lip,the visible mouth, and the outer throat. Epithelia are targets for cancer; as the outer layer,they contact carcinogens,such as UV light,cigarettes,and others,first. HNSCCs constitute 90% of all HNCs [16]. HNCs are the eighth most common cancers in the United States of America, accounting for about 3% of all new reported malignant tumors and 2% of deaths [17]. About 42,440 new cases and 8390 total deaths, from new as well as former cases,were predicted for 2014 [17].
Risk factors for HNC include tobacco and alcohol consumption [18]. Current diagnoses depend on invasive procedures,such as needle biopsies. However,such a procedure is only feasible in certain cases,and is based on previous symptoms of HNC, including halitosis,neck pain,sinus infections,and weight loss [19],all of which may also represent other diseases. More specific symptoms,such as detectable lumps in the throat or neck,are not always present in HNC. Furthermore,invasive procedures such as biopsies carry a risk of causing damage to the patient,as well as involve large costs.
Despite advancements in the detection and treatment of HNC, prognosis depends on the stage and site of the tumor,and the rate of metastasis,giving a poor survival rate [20]. Although tumor biology has become better understood,the effectiveness of chemotherapy is limited and disease resistance remains high [21]. Most current studies use tumor cells and tissue in vitro [22, 23] and in vivo [24, 25],to combat HNC. In contrast to a cellular approach,a global metabolomics study provides more information to understand HNC and identify biomarkers to diagnose it [26].
Current HNC diagnosis depends on a physical examination, with blood and urine tests,endoscopies,X-ray,computed tomography,and magnetic resonance imaging (MRI),normally in response to symptoms already present in the patient.Generally, diagnoses are confirmed by procuring a physical sample of tissue through a needle biopsy of the potential tumor,which is then examined for cancer,confirming or dismissing diagnosis. However, metabolomics can greatly improve on this procedure. HNC, as with all diseases [27],has a specific and detectable metabolic signature,separate from cancers and normal cells [28]. Therefore, metabolomic based analysis of head and neck cancer would lend itself easily to diagnosing this disease. This has already been seen with genomics and proteomics through mass spectrometry [29- 35]. Metabolomics,giving an earlier diagnosis than even genomics and proteomics,would help fight HNC,removing the need for harsh treatments,involving surgeries and chemotherapy [36, 37, 38],and easing suffering on the road to recovery. Also,being non-invasive,HNC would cause less distress in the diagnostic process,ensuring that the patients’ quality of life during treatment will improve. 3. Metabolomics methodology
Due to the chemico-physical variation in metabolic mixtures, analysis is extremely complicated. Nuclear magnetic resonance spectroscopy (NMR) and mass spectrometry (MS) have the necessary analytical power to overcome this,especially when combined with chromatographic purification techniques to reduce complexity. Overcoming this complexity is one avenue of future research,as the need for specialized and customized methods of statistical analysis,possibly through integrating information from external databases,is paramount.
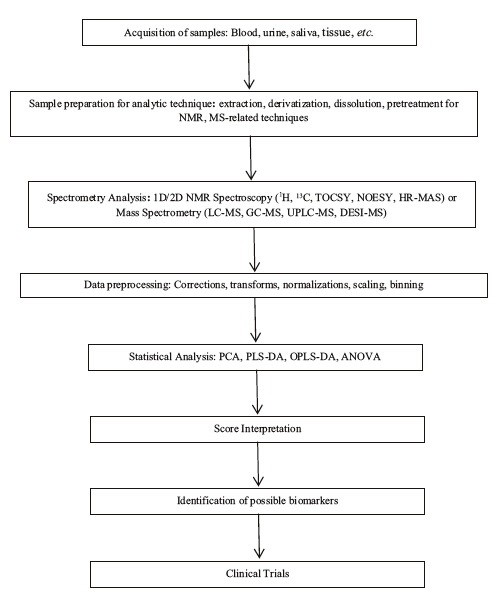
Metabolomic analysis falls into two categories: targeted and untargeted. Targeted approaches quantify known biomarkers for certain diseases or physiological states to make conclusions on the patient from whom the data originates. Targeted metabolomics looks for something expected in the data. Untargeted approaches search for correlations between diseased states and experimental quantities in previously uncharacterized diseases to develop targeting profiles. Both acquire data similarly. They do have their limitations,however,as metabolomic samples such as tissues, urine,blood,and amniotic fluid [39, 40] contain fewer metabolites as compared to genetic materials and proteins,fewer of which are detectable,depending on the sample,analytical platform and goals of the study,focusing on MS and NMR spectroscopy [41]. Due to variations in biological samples,no single method can identify and quantify all metabolites in a sample. A combination of applicable procedures must be used in order to maximize the number of detected and quantified metabolites,which is not well-established at this moment,though a typical course of action for metabolomic analysis does exist (Scheme 1).

|
Download:
|
| Fig. 1. Overview of metabolomics methodology for NMR and MS based analysis. | |
Preparation of samples for analysis is very important in metabolomics. Due to natural physicochemical variation in biological samples,preparation specific to analysis is necessary to best standardize samples. For example,for NMR,samples require homogenization and extraction,with an appropriate solvent,if done in liquid phase. Tissue samples can be analyzed using solid-state NMR spectroscopy through magic angle spinning (MAS) or high-resolution magic angle spinning (HR-MAS) techniques [42],which can analyze tissues non-destructively. Neat,extracted,and incubated samples are used in MS analyses [43, 44, 45, 46]. Specific conditions depend on the analysis being done. 3.1. Sample collection and preparation for metabolomic analysis
Sample collection and preparation depends on the type being analyzed and the goals of analysis. Factors considered include diet, gender,age,ethnicity,pathophysiology,and location. A high number of samples,along with controls,replicated samples,and blanks,are always preferable to ensure the broadest and most accurate data. For analysis,samples must be preserved through sample-specific techniques. For blood plasma and serum,samples are collected with anti-coagulants or coagulants,respectively, centrifuged and stored frozen,e.g. on dry ice. Urine storage uses the same principles,stored at -80 ℃. Saliva samples are preferable if not stimulated,and stored at normally -20 ℃ for short term use and -70 ℃ for long term usage. Tissue samples depend on being frozen at usually -80 ℃. More techniques include freezing in liquid N2,acid treatment [47],quenching in salt and methanol [48], or chemical protection against oxidation and degradation.
Preparation depends on the sample,metabolites,and analytic platform. Volatile metabolites,especially organic compounds [49], are difficult to use. Extraction techniques can destroy metabolites. Solvents alter metabolites in large scale separations. For mass spectrometry,most metabolites are extracted using solid-phase or liquid-liquid extraction,or liquid and gas chromatography [50]. These techniques can be directly coupled to MS,eliminating transfer steps and allowing for analysis. Proper separation is one of the problems in metabolomics that future research needs to address.
NMR based metabolomics requires a different sample preparation, depending on whether solution- or solid-state NMR experiments are used. In solution-state NMR experiments,the sample is prepared according to standard,desolvated,and suspended in a deuterated solvent for analysis. Adjustments may be made for certain conditions,including a buffer to regulate pH or EDTA to eliminate salt variations. This minimal sample preparation helps solutionNMRspectroscopy to be applied for metabolomic analysis. Solid-state NMR spectroscopy can be directly applied to tissues, even in vivo [51],and MAS techniques directly to bone [52]. High throughput NMR techniques also exist through the use of a flow cell for automatic sample insertion into the NMR spectrometer, with data nearly as accurate as standard methods [53]. Future research could address peak drift in NMR spectra due to changes in pH or salt concentration,which can cause inaccuracies in comparing signals between spectra collected from different samples [54]. 3.2. Nuclear magnetic resonance spectroscopy
NMR spectroscopy measures the resonance frequencies of nuclear spins (Table 1) in the presence of an external magnetic field without damaging or denaturing the sample. An NMR spectrometer consists of a cryomagnet,a probe where a sample is loaded for data collection,and a console that comprises of amplifiers, receivers and data processing units.
| Table 1 List of NMR active nuclei used for metabolomics studies on biospecimens [55]. |
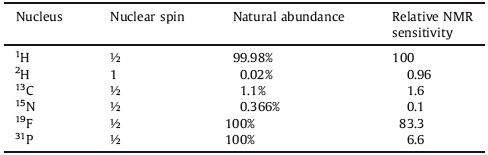
Cooled (or cryo) probes use liquid He and N2 to achieve higher sensitivity by reduction of electronic noise in the probe. Magnetic field strength is often denoted in terms of 1H NMR resonance frequency and cryomagnets as high as 1000 MHz are presently available for metabolomics studies. The use of an ultra-high magnetic field allows for high enough sensitivity to detect lowabundant metabolites and high spectral resolution to simultaneously detect different types of metabolites present in a biospecimen.
Figures of merit also increase with magnetic field strength. A 500 MHz spectrometer with a cooled probe is considered to be the lower limit for metabolomic studies. Furthermore,previous limitations on NMR spectroscopy,especially the need for an expert operator to maximize quality of data,has been removed due to full automation,which has helped makeNMRa high-throughput technique,seen in commercially available quality control techniques [53, 56, 57]. Despite reproducible and quantitative data, standardized procedures,ease of preparation,and automation [53, 58],the low sensitivity of NMR still is the major limitation when compared to mass spectrometry. However,the use of latest approaches including fast data collection and cryoprobes can overcome this limitation. In addition,the advent of higher magnetic fields and dynamic nuclear polarization (DNP) techniques can also dramatically enhance the sensitivity [59].
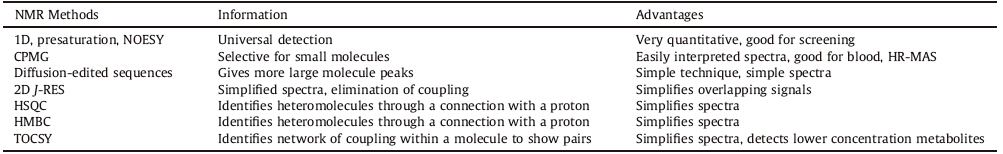
NMR experiments produce 1D,2D and even 3D spectra that can be used to identify and fully characterize metabolites without any difficulty in reproducing the data [60]. The Carr-Purcell-Meiboom- Gill (CPMG) sequence helps suppress peaks from large molecular components like proteins while diffusion edited experiments identify lipids [61]. Total correlation spectroscopy (TOCSY) can be used in metabolomics to detect low concentration metabolites [62]. 2D methods reduce spectral complexity and show connectivities to increase accuracy in identifying metabolites,but with the drawback in increased time of data acquisition despite effectiveness and the simplification of spectra [31, 63]; however, an effective use of recently introduced non-uniform sampling (NUS) approach can dramatically speed up the data collection process. The most common techniques are scalar coupling based 2D TOCSY,heteronuclear single-quantum coherence,and heteronuclear multiple bond correlation. Most NMR studies are carried out on 1H nuclei,but 13C NMR metabolomics have also been utilized,despite needing isotope labeling. Combining 1H and 13C NMR into 2D experiments can cut down on data collection time and give better data. A list of experiments useful for NMR-based metabolomics is summarized in Table 2.
| Table 2 A list of commonly used NMR experiments in metabolomic studies [64]. |
Data can also be obtained from both liquid and solid samples,by using MAS experiments. Liquid-state samples are dissolved in deuterated solvents,such as D2O,CDCl3,and CD3OD. Solid samples are spun at the magic angle (54.73568) to obtain ‘‘liquid-like’’ spectra [65]. MAS techniques render a variety of avenues for detection of metabolites,particularly non-soluble components or large size metabolites and species like tissues,in-cell components, bacteria,viruses,bone etc. Such measurements are in high demand as physiologically relevant metabolomics can be investigated using MAS experiments. While samples can be spun as fast as 110 kHz using ultrafast MAS probes,slow spinning (typically <5 kHz) is used for tissues. On the other hand,rigid solids like bone can be investigated using ultrafast MAS [66]. NMR spectroscopy has already been established in metabolomic analysis of disease [67] and drug resistance to cancer [68]. Though additional NMR experiments have been introduced [51, 69],expanding NMR applicability remains an avenue for future research. 3.3. Mass spectrometry
Mass spectrometry (MS) is a highly sensitive technique for metabolomic analysis. A MS spectrometer has three components: the ion source for desolvation and ionization; the mass analyzer, separating ions based on mass-to-charge ratio; and a detector. Generated ions are accelerated to create an ion beam,directed into a magnetic field,where it is deflected and ions are separated on mass-to-charge ratio,which the detector senses. Electron impact (EI) ionization,being harsh on analytes,has been replaced with the softer electrospray ionization (ESI) and matrix-assisted laser desorption ionization (MALDI),and ESI is often used in both positive and negative ion mode for a maximum range [70]. Common analyzers include quadrupoles,ion traps,and time-offlight analyzers,with FT-ICR and orbitraps for a higher resolution, around 1 ppm [71, 72, 73]. Metabolomics focuses on quadrupole and the time-of-flight analyzers,giving the most flexibility and range for targeted and untargeted approaches. A list of all MS experiments,combined and otherwise,used in metabolomics is provided in Table 3. MS experiments can also be run in multiple dimensions and as imaging. MS has been used in metabolomics due to specificity and sensitivity in dealing with a complex mixture of metabolites [74]. But,MS based metabolomics has severe limitations as it can provide results that are not reproducible,can give varying results across research groups,fails to identify established biomarkers,and cannot reliably display a specific molecule in a metabolomic mass spectrum [75]. In addition,unlike NMR,samples for measurements are altered and are not recoverable for further analyses. These are all avenues for future research.
| Table 3 List of MS experiments applicable to metabolomic analysis [65]. |
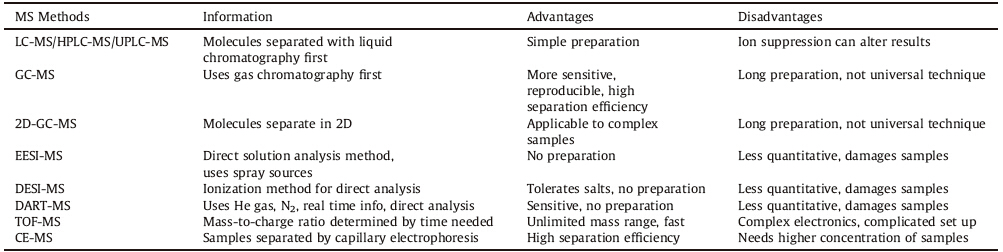
Analytical techniques can be combined with separation techniques,such as gas chromatography (GC),liquid chromatography (LC),and capillary electrophoresis (CE) in so-called hyphenated experiments. These provide more information,as separation simplifies spectra,giving more accurate results [50]. LC is generally used due to its sensitivity and breadth of information, as fluids are directly put into the system. Sera require only the removal of proteins. Advances in LC have reduced the limits in the detection system further,but still take a long time. GC is also widely seen,but requires more sample preparation. Alternative methods can remove separation,but require more ionization of samples [76]. These are all potential avenues for further research. 3.5. Statistical analysis
NMR and MS give thousands of signals that require processing before analysis,removing false signals and peak drift offsets that cause misalignment,removing complexities and revealing lowabundance signals through binning and data scaling and centering. These areas are potential avenues for research. However,all methodologies do affect the accuracy in data,potentially eliminating real biomarkers or giving false positives. Spectra are aligned based on reference compounds from databases such as KnowItAll [77] and Amix [78]. Processed spectra then use statistical methods for interpretation. Though univariate analysis, such as the t-test,is possible and used in metabolomics [79],the common process is to use multivariate methods due to the complexity of samples,which also limits the dimensionality of spectra to ease interpretation. Many specific forms exist,divided into unsupervised and supervised methods.
Unsupervised methods classify spectra based on the given data, not to any external standard,in untargeted analysis. This is normally done through principal component analysis (PCA), ranking components and descriptors to explain variance. Another method is hierarchical cluster analysis (HCA),which defines natural clusters based on comparisons between distances of pairs of samples or variables. A third unsupervised method is K nearest neighbor (KNN) analysis,which shows similarity within classes. Supervised methods compare the data against a predicted model in targeted analysis. It is used as cross-validation [80],but can force classifications. Methods include partial least squares-discriminant analysis (PLS-DA) [81],soft independent modeling of class analogies (SIMCA),orthogonal signal correction (OSC),and OSC and PLS-DA combined to form OPLS-DA,with the number of permutation tests being upwards of 200 [82]. Statistically validated PCA findings need secondary samples and biological validation before acceptance of the biomarker.
Correlation methods,such as statistical TOCSY,are used to compare NMR and MS spectra,and can help simplify the identification of metabolites [83, 84]. PCA,NMR,and MS results can be combined as well [85],which aids the interpretation of data when 2D score plots are insufficient.
4. Metabolic information from databases
With the vast amount of spectra generated,metabolomics benefits from databases that can identify and interpret data as references. Examples include the Human Metabolome Database (HMDB),backed by the University of Alberta,a free electronic database with 41,154 metabolite entries,including water-soluble, lipid-soluble,abundant,and rare signals [86]. Another is METAGENE,based in the University of Tuebingen,which contains genetic errors in metabolic pathways,giving information on the genetic fingerprint and metabolic concentrations found in a disease [87]. MassBank [88],of Keio University,contains vast amounts of MS spectra,while the Biological Magnetic Resonance Data Bank (BMRB) at the University of Wisconsin is NMR-specific and metabolomics specific,along with more detailed NMR data such as coupling constants,time-domain data,and kinetic information [89]. MetaboID is another NMR-specific database used for complex mixture assignment in 1D analysis [90]. AMIX,by Bruker,is a commercial database that can verify small molecule structures from NMR and MS [91]. The Chenomx profiler is also commercial,and identifies and quantifies compounds from NMR spectra,with adjustments for conditions [92]. 5. Biological specimen used in metabolomics analysis of HNSCC
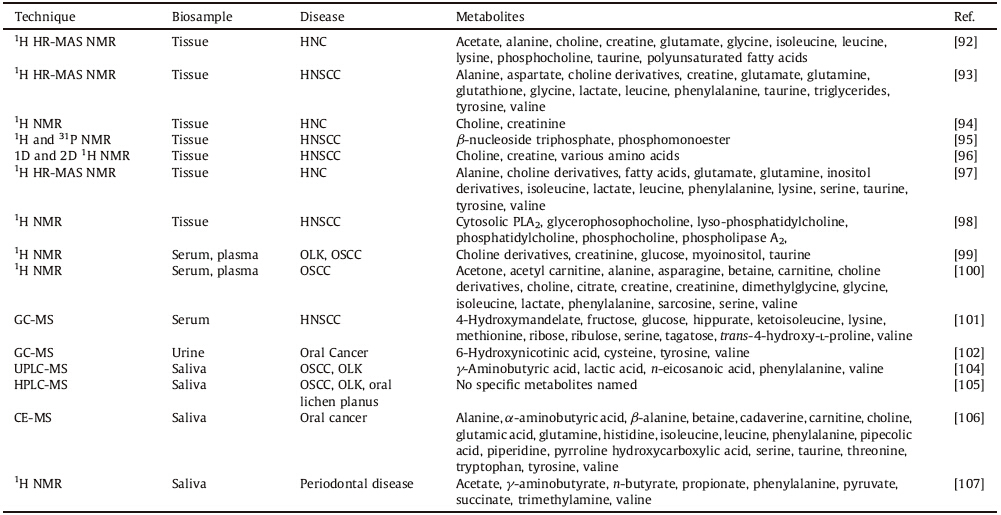
Biological samples are necessary for metabolomic analysis of a disease. These include urine,blood,serum,plasma,saliva,and tissue,among others [93]. HNCs begin in epithelia,spreading through fluids in metastasis. Thus,blood and urine samples are easily available,and are ideal for metabolomics,as they are the drainage system of body fluids. Saliva is also useful for HNC as it is in direct contact with the disease. Tissues can be useful if from the growth in question. Each sample type has its own advantages and disadvantages. A summary of biomarkers found in these various samples for HNC and HNSCC is found in Table 4.
| Table 4 List of metabolites identified for HNC and HNSCC [91, 92, 93, 94, 95, 96, 97, 98, 99, 100, 101, 102, 104, 105, 106, 107]. |
Tissue extracts require treatment before profiling but have become more common because they are the actual site of the disease. NMR advancements have significantly reduced the required size of a sample and enhanced the spectral resolution in MAS experiments,which require almost no sample preparation [94]. However,tissue experiments in MS have not been wellestablished. Tissue samples have dominated current metabolomics research in HNC. Srivastava et al. used HR-MAS 1H spectroscopy on tissues to analyze oral squamous cell carcinoma [95]. Tissues were placed in their histopathological categories with an accuracy of 97.4%. Malignant tissues had higher values of glutamate,choline, phosphocholine,lactate,acetate,taurine,glycine,leucine,lysine, isoleucine,and alanine,as well as lower values of creatine and polyunsaturated fatty acids.
Somashekar et al. used tissues with HR-MAS 1H NMR spectroscopy [96] to HNSCC. They found a clear difference between normal and cancerous tissue,with metastatic tissue having elevated levels of lactate,leucine,isoleucine,valine,alanine,glutamine,glutamate,aspartate,glycine,phenylalanine,tyrosine, choline derivatives,creatine,taurine,glutathione,and decreased levels of triglycerides. Bezabeth et al. tested whether 1H NMR spectroscopy is a feasible diagnostic tool for determining treatment response in HNC [97]. The researchers found the choline to creatinine ratio and the spectral intensity ratio elevated in the group that responded poorly to treatment. Shukla-Dave et al. also tackled the problem of predicting treatment response for HNSCC using NMR spectroscopy [98],using a multidimensional combination of 1H and 31P NMR to determine a biomarker for the progression of treatment of HNSCC. The average pretreatment ratio of phosphomonoester to b-nucleoside triphosphate varied between those who did respond to the treatment and those who did not,being significantly smaller in complete responders than partial responders and non-responders. Mukherji et al. used 1H NMR spectroscopy on ex vivo tissue in order to detect HNSCC and correlate with clinical studies [99]. 1D and 2D NMR spectra were performed,with the biomarker examined being the ratio of areas under the choline and creatine resonances. The mean in vitro choline to creatine ratio was significantly higher in tumor samples than in normal,healthy samples. A variety of amino acids were more prevalent in the tumor than the normal tissues. Torregrossa et al. used HR-MAS NMR spectroscopy to analyze cancer as well [100]. HR-MAS analysis was then carried out on solid samples, looking at mainly 1H data. In general,phenylalanine,tyrosine, serine,lysine,taurine,glutamine,glutamate,alanine,isoleucine, leucine,valine,and lactate were found to be elevated,while fatty acids,choline derivatives,and inositol derivatives were found to be depressed in tumor samples.
Tripathi et al. [101],used tissues to examine HNSCC through 1H NMR,which showed differences between healthy and diseased cells. Anomalies found include the Warburg effect,oxidative phosphorylation, energy metabolism,Krebs Cycle anaplerotic flux,glutaminolysis, hexosamine pathway,and osmoregulatory and antioxidant mechanisms. There were also significant alterations in the ratios between phosphatidylcholine and lyso-phosphatidylcholine as well as phosphocholine and glycerophosphocholine,along with elevated arachidonic acid in the HNSCC cells,with in increased activity of phospholipase A2 and cytosolic PLA2.
When looking at the breadth of HNC tissue-based metabolomics research as a whole,it is obvious that the technique is well established for the research in question. However,drawbacks still appear that form future potential research avenues,as data does not remain consistent,in terms of elevated and depressed levels of metabolites,across groups. 5.2. Serum and plasma profiling by NMR and MS techniques
Blood sera and plasma are similar to tissue metabolomics. Though they give a global view of the body,they require preparation to remove proteins and lipids,as seen with tissues. MS analysis of blood is,as withNMR,performed with extracts,and,along with gas chromatography,derivatization procedures. Zhou et al. used blood to analyze oral squamous cell carcinoma (OSCC) and oral leukoplakia (OLK) through 1H NMR [102]. Myoinositol and taurine, choline-containing compounds,creatinine,and glucose indicated cancerous patients. Tiziani et al. used 1HNMRto study OSCC[103]. It was found that metabolites such as sarcosine,betaine,cholinecontaining compounds,phenylalanine,acetone,asparagine,and glucose all showed elevated levels while those of creatinine, creatine,glycine,serine,alanine,lactate,isoleucine,valine,and citrate all were lower in tumors. Choline-creatine ratios were elevated in the cancerous samples. Specifically,choline,betaine, dimethylglycine,carnitine,and acetyl carnitine all distinctly differentiate between early and late stage diseases. Yonezawa et al. used sera and tissue from HNSCC,analyzed with GC-MS [104]. The elevated metabolites in tumors were glucose,ribose,fructose, ribulose,and tagatose. The decreased ones were lysine,hippurate, trans-4-hydroxy-L-proline,methionine,ketoisoleucine,and 4- hydroxymandelate. The levels of amino acids such as valine, tyrosine,serine,and methionine were seen to be higher. Thus,blood serum is a viable sample source for metabolomic analysis.However, like tissue,data does notremain consistent across research groups,a problem and a potential future research area. 5.3. Urinary profiling by MS
Urine has many advantages for metabolomics,as it is readily available and has fewer proteins,along with more metabolites. However,it has salts and gives very complicated spectra. Though it gives narrow peaks in NMR,it is too complicated for primitive NMR analysis and has large peak drifts due to salt contaminations in NMR and MS. Xie et al. [105] used GC-MS to study oral cancer. Diagnostic correlations were found for a combination of valine and 6-hydroxynicotinic acid and the group of cysteine,6-hydroxynicotinic acid and tyrosine. Though this study validates urine as a sample and recent studies have shownmore unity than before [106], unity across research groups still needs to be found. 5.4. Saliva profiling by NMR and MS techniques
Saliva,like urine,is an easily prepared sample for metabolomics. However,it is much more specialized,being a localized fluid,and contains more proteins than urine,requiring more preparation in that regard,though less than blood or tissue. Wei et al. used UPLC-MS on saliva for OSCC and OLK studies [107]. Significant metabolites include g-aminobutyric acid,phenylalanine, valine,n-eicosanoic acid,and lactic acid. Yan et al. did a similar study on OSCC,OLK,and oral lichen planus [108] through HPLC-MS. Though no specific metabolites were named,this research separated the three diseases with near perfect accuracy. Sugimoto et al. also used saliva as a basis for metabolomics study of oral,breast,and pancreatic cancer-specific profiles [109] through CE-MS. Metabolites shown as potential markers for oral cancer include: pyrroline hydroxycarboxylic acid,leucine,isoleucine, choline,tryptophan,valine,threonine,histidine,pipecolic acid, glutamic acid,carnitine,alanine,piperidine,taurine,α-aminobutyric acid,phenylalanine,betaine,serine,tyrosine,glutamine,β-alanine, and cadaverine. Aimetti et al. used 1H NMR to analyze saliva to detect periodontal disease [110]. Profiling of the metabolites involved indicated higher concentrations of acetate, g-aminobutyrate,n-butyrate,succinate,trimethylamine,propionate, phenylalanine,and valine. Pyruvate and N-acetyl groups were found to have decreased concentrations compared to the controls. Though this study validates saliva as a sample,unity across research groups still needs to be found.
In terms of the best overall sample to use,it is obvious that tissues are the best due to their specificity to the disease in question. Though MS is unwieldy with tissue samples,the overwhelming accuracy from the data marks it as having the greatest potential in metabolomics. For a global screening process, blood or urine would be preferable. Though blood has more preparatory steps than urine,urine can give more sample to sample variation in peak drifts. Saliva is only useful in disease in the mouth and surrounding area. All sample techniques,however, have their inherent problems,which need to be addressed in coming research. 6. Obstacles to metabolomics analysis
Most benefits as well as problems with metabolomics stem from the analytical procedures used. Though MS is among the most sensitive analytical techniques available,experiments are not always reproducible. Not all data are reported in a study [50]. MS also destroys the sample,preventing further experiments from being run on quantified samples. Itmay not be able to detect signature metabolites in a more complex spectrum. MS also shows conflicting data on the elevation and depression of metabolites when different samples are used. It cannot analyze tissue directly,nor can it overcome the inherently complex data it presents. Sample preparation can be complex as well. The unique capabilities of NMR spectroscopy have limitations that aremainly due to low sensitivity. In spite of the relatively high expenses,the development of ultra-high magnetic fields (like the 1.0 GHz magnets),faster data collection approaches and ambient temperature DNP instruments are essential to significantly expand the applications of powerful (both solution and solid-state) NMR approaches [111]. Peaks shift due to changes in pH and salt concentrations pose some limitations,but can be overcome.Most treatNMR andMS as separate tools,but a combined approachmay overcome issues. A combined instrument is available from Bruker, but the applications to metabolomics remain to be expanded. 7. Concluding remarks and outlook
NMR and MS metabolomics have become more common, especially studying major diseases such as cancer,which alter profiles the greatest. Metabolomics-related methods are expected to affect clinical diagnoses for numerous diseases. As discussed above,diagnoses of HNCs using metabolomics,both NMR-based and MS-based,have a positive outlook in the near future. Both NMR and MS based spectrometry have been applied in clinical settings,and they will improve diagnostic accuracy of current detection techniques upon expanded usage,limiting medical issues and extending lifespans. Furthermore,metabolomics,once established in cancers,can expand to other diseases such as diabetes,cardiovascular disease,pulmonary disease,and even bipolar disorder,though this analysis is still under development.
Current metabolomic techniques also have room to improve, providing avenues for future research. Current techniques give overly complex spectra. These could be addressed by improving current separation techniques,or by adding derivatization techniques,such as selective esterification to separate metabolites into polar and nonpolar groups. Furthermore,metabolomics is not quite as high-throughput as desired. Designing new methodologies and machinery to aid in this would be a large step forward to increasing the power of metabolomics. This could include better integrating separation techniques,MS and NMR analysis,or even finding a methodology to simplify the preparation of each sample, whether by determining optimal samples for each technique or helping techniques such as MS to be able to analyze samples such as tissues.
Specific analytical techniques also pose their own problems, which need to be addressed. Mass spectra,though extremely sensitive,can sometimes lose specificity,especially when searching for certain,characteristic peaks. Furthermore,mass spectra are not reproducible,as the sample is destroyed upon analysis,and also extremely sensitive to matrix effects,which can cause problems in the data. Standard operating procedures,which could be developed for MS,would help alleviate these issues and provide unifying data across groups and samples. NMR is also sensitive to peak shifts between different samples mainly due to pH and salt concentrations. These variations are characteristic of metabolomic samples,and are due to variations in age,weight,gender,location, diet,pharmacology and other subject-specific factors. These changes must be taken into account for accurate metabolomic analysis,whether by statistical or chemical treatment. Possible avenues include developing standard operating procedures for pretreatment of samples before analysis,including selective precipitation and buffer analysis,again,future avenues of research in metabolomics. The most pressing future research,however,is developing metabolomic profiles for cancers. As seen with HNCs, many metabolites show changes due to diseased states,but they need to be standardized and corroborated biologically before clinical application. This process is the single most important step in metabolomics. Once done with one cancer,the rest will follow.
With improvements in methodology and statistical analysis, metabolomics will become the most sensitive and convenient approach for early disease diagnosis. Thus,the five-year outlook is extremely strong for metabolomics,given rapid recent developments and easily discernible areas of improvement that promise to fix current problems and provide a definitive platform by which diseases can be accurately and specifically detected,diagnosed, and treated.
AcknowledgmentsWe would like to thank the funding support to the Ramamoorthy lab and from NSF-REU. We also thank Dr. Bagganahalli S. Somashekar for his contributions to metabolomics studies in the Ramamoorthy laboratory and to this review article. We dedicate this article to Professor Zhan Chen for his outstanding contributions in the area of Spectroscopy and Membrane Biophysics.
| [1] | B.S. Somashekar, A.G. Amin, P. Tripathi, et al., Metabolomic signatures in guinea pigs infected with epidemic associated W-Beijing strains of Mycobacterium tuberculosis, J. Proteome Res. 10 (2012) 4873-4884. |
| [2] | B.S. Somashekar, A.G. Amin, C.D. Rithner, et al., Metabolic profiling of lung granuloma in Mycobacterium tuberculosis infected guinea pigs: ex vivo 1H magic angle spinning NMR studies, J. Proteome Res. 10 (2011) 4186-4195. |
| [3] | A.P. Zhou, J.J. Ni, Z.H. Xu, et al., Application of 1H NMR spectroscopy-based metabolomics to sera of tuberculosis patients, J. Proteome Res. 12 (2013) 4642- 4649. |
| [4] | A. Villaseñor, A. Ramamoorthy, M. Silva Dos Santos, et al., A pilot study of plasma metabolomic patterns from patients treated with ketamine for bipolar depression: evidence for a response-related difference in mitochondrial networks, Br. J. Pharmacol. 171 (2014) 2230-2242. |
| [5] | M.P. Lorenzo, A. Villaseñor, A. Ramamoorthy, A. Garcia, Optimization and validation of a capillary electrophoresis laser-induced fluorescence method for amino acids determination in human plasma: application to bipolar disorder study, Electrophoresis 34 (2013) 1701-1709. |
| [6] | M. Assflaq, I. Bertini, D. Colangiuli, et al., Evidence of different metabolic phenotypes in humans, Proc. Natl. Acad. Sci. U. S. A. 105 (2008) 1420-1424. |
| [7] | P. Bernini, I. Bertini, C. Luchinat, et al., Individual human phenotypes in metabolic space and time, J. Proteome Res. 8 (2009) 4264-4271. |
| [8] | C. Hafner, R. Kneuchel, L. Zanardo, et al., Evidence for oligoclonality and tumor spread by intraluminal seeding in multifocal urothelial carcinomas of the upper and lower urinary tract, Oncogene 20 (2001) 4910-4915. |
| [9] | S. Krug, G. Kastenmüller, F. Stückler, et al., The dynamic range of the human metabolome revealed by challenges, FASEB J. 26 (2012) 2607-2619. |
| [10] | M.J. Rist, C. Muhle-Goll, B. Görling, et al., Influence of freezing and storage procedure on human urine samples in NMR-based metabolomics, Metabolites 3 (2013) 243-258. |
| [11] | D. Sidransky, Emerging molecular markers of cancer, Nat. Rev. Cancer 2 (2002) 210-219. |
| [12] | C. Schmidt, Metabolomics takes its place as latest up-and-coming "omic" science, J. Nat. Cancer Inst. 96 (2004) 732-734. |
| [13] | J.L. Griffin, J.P. Shockcor, Metabolic profiles of cancer cells, Nat. Rev. Cancer 4 (2004) 551-561. |
| [14] | N.S. Nagaraj, Evolving ‘omics' technologies for diagnostics of head and neck cancer, Brief Funct. Genomics Proteomics 8 (2009) 49-59. |
| [15] | E.E. Vokes, R.R. Weichselbaum, S.M. Lippman, W.K. Hong, Head and neck cancer, N. Engl. J. Med. 328 (1993) 184-194. |
| [16] | Macmillan Cancer Support, Types of Head and Neck Cancer, 2015. |
| [17] | American Cancer Society, Cancer Facts & Figures, 2014. |
| [18] | S. Schmitz, J.P. Machiels, Molecular biology of squamous cell carcinoma of the head and neck: relevance and therapeutic implications, Expert Rev. Anticancer Ther. 10 (2010) 1471-1484. |
| [19] | Head and neck cancer. http://www.cel-sci.com/head_and_neck_cancer.html. |
| [20] | J.P. Pignon, A. le Maítre, E. Maillard, J. Bourhis, Meta-analysis of chemotherapy in head and neck cancer (MACH-NC): an update on 93 randomised trails and 17,346 patients, Radiother. Oncol. 92 (2009) 4-14. |
| [21] | J. Bernier, S.M. Betnzen, J.B. Vermorken, Molecular therapy in head and neck oncology, Nat. Rev. Clin. Oncol. 6 (2009) 266-277. |
| [22] | V.C. Sandaluche, T.J. Ow, C.R. Pickering, et al., Glucose, not glutamine, is the dominant energy source required for proliferation and survival of head and neck squamous carcinoma cells, Cancer 117 (2011) 2926-2938. |
| [23] | T. Jiffar, T. Yilmaz, J. Lee, et al., KiSS1 mediates platinum sensitivity and metastasis suppression in head and neck squamous cell carcinoma, Oncogene 30 (2011) 3163-3173. |
| [24] | S. Karahatay, K. Thomas, S. Koybasi, et al., Clinical relevance of ceramide metabolism in the pathogenesis of human head and neck squamous cell carcinoma (HNSCC): attentuation of C(18)-ceramide in HNSCC tumors correlates with lymphovascular invasion and nodal metastasis, Cancer Lett. 256 (2007) 101-111. |
| [25] | T. Ziebart, S. Walenta, M. Kunkel, et al., Metabolic and proteomic differentials in head and neck squamous cell carcinomas and normal gingival tissue, J. Cancer Res. Clin. Oncol. 137 (2011) 193-199. |
| [26] | Y.S. Kim, P. Maruvada, J.A. Milner, Metabolomics in biomarker discovery: future uses for cancer prevention, Future Oncol. 4 (2008) 93-102. |
| [27] | C.B. Newgard, Finding mechanisms from metabolic signatures of diseases, BMC Proc. 6 (2012), O19. |
| [28] | B.R. Konety, Molecular markers in bladder cancer: a critical appraisal, Urol. Oncol. 24 (2006) 326-337. |
| [29] | A. Matta, R. Ralhan, L.V.W. De Souza, K.W. Michael Siu, Mass spectrometry-based clinical proteomics: head-and-neck cancer biomarkers and drug discovery, Mass. Spectrom. Rev. 29 (2010) 945-961. |
| [30] | E.M. Reis, E.P. Ojopi, F.L. Alberto, et al., Large-scale transcriptome analyses reveal new genetic marker candidates of head, neck, and thyroid cancer, Cancer Res. 65 (2005) 1693-1699. |
| [31] | J.Y. Engwegen, M.C.W. Gast, J.H.M. Schellens, J.H. Beijnen, Clinical proteomics: searching for better tumour markers with SELDI-TOF mass spectrometry, Trends. Pharmacol. Sci. 27 (2006) 251-259. |
| [32] | J.T. Wadsworth, K.D. Somers, J. Stack, et al., Identification of patients with head and neck cancer using serum protein profiles, Arch. Otolaryngol. Head Neck Surg. 130 (2004) 98-104. |
| [33] | E.P. Diamandis, Serum proteomic profiling by matrix-assisted laser desorptionionization time of flight mass spectrometry for cancer diagnosis: next steps, Cancer Res. 66 (2006) 5540-5541. |
| [34] | E.P. Diamandis, Analysis of serum proteomic patterns for early cancer diagnosis: drawing attention to potential problems, J. Nat. Cancer Inst. 49 (2004) 353-356. |
| [35] | W.C.S. Cho, Contribution of oncoproteomics to cancer biomarker discovery, Mol. Cancer 6 (2007) 6-25. |
| [36] | A.A. Forastiere, Chemotherapy in the treatment of locally advanced head and neck cancer, J. Surg. Oncol. 97 (2008) 701-707. |
| [37] | A. Forastiere, R. Weber, K. Ang, Treatment of head and neck cancer, N. Engl. J. Med. 358 (2008) 1076-1077. |
| [38] | A.A. Forastiere, A. Trotti, D.G. Pfister, et al., Head and neck cancer: recent advances and new standards of care, J. Clin. Oncol. 24 (2006) 2603-2605. |
| [39] | G. Graça, I.F. Duarte, B.J. Goodfellow, et al., Metabolite profiling of human amniotic fluid by hyphenated nuclear magnetic resonance spectroscopy, Anal. Chem. 80 (2008) 6085-6092. |
| [40] | G. Graça, I.F. Duarte, B.J. Goodfellow, et al., Potential of NMR spectroscopy for the study of human amniotic fluid, Anal. Chem. 79 (2007) 8367-8375. |
| [41] | J.C. Lindon, J.K. Nicholson, Spectroscopic and statistical techniques for information recovery in metabonomics and metabolomics, Annu. Rev. Anal. Chem. 1 (2008) 45-69. |
| [42] | B. Sitter, T.F. Bathen, M.B. Tessem, I.S. Gribbestad, High-resolution magic angle spinning (HR MAS) MR spectroscopy in metabolic characterization of human cancer, Prog. Nucl. Magn. Reson. Spectrosc. 54 (2009) 239-254. |
| [43] | T.J. Waybright, Q.N. Van, G.M. Muschik, et al., LC-MS in Metabonomics: optimization of Experimental Conditions for the Analysis of Metabolites in Human Urine, J. Liq. Chromatogr. Relat. Technol. 29 (2006) 2475-2497. |
| [44] | M.P. Gonthier, L.Y. Rios, M.A. Verny, C. Rémésy, A. Scalbert, Novel liquid chromatography- electrospray ionization mass spectrometry method for the quantification in human urine of microbial aromatic acid metabolites derived from dietary polyphenols, J. Chromatogr. B: Anal. Technol. Biomed. Life Sci. 789 (2003) 247-255. |
| [45] | E.J. Want, G. O'Maille, C.A. Smith, et al., Solvent-dependent metabolite distribution, clustering, and protein extraction for serum profiling with mass spectrometry, Anal. Chem. 78 (2006) 743-752. |
| [46] | A. Sreekumar, L.M. Poisson, T.M. Rajendiran, et al., Metabolomic profiles delineate potential role for sarcosine in prostate cancer progression, Nature 457 (2009) 910-914. |
| [47] | U. Theobald, W. Mailinger, M. Reuss, M. Rizzi, in vivo analysis of glucose-induced fast changes in yeast adenine nucleotide pool applying a rapid sampling technique, Anal. Biochem. 214 (1993) 31-37. |
| [48] | R.P. Maharjan, T. Ferenci, Global metabolite analysis: the influence of extraction methodology on metabolome profiles of Escherichia coli, Anal. Biochem. 313 (2003) 145-154. |
| [49] | G.A. Mills, V. Walker, Headspace solid-phase microextraction profiling of volatile compounds in urine: application to metabolic investigations, J. Chromatogr. B: Biomed. Sci. Appl. 753 (2001) 259-268. |
| [50] | K. Dettmer, P.A. Aronov, B.D. Hammock, Mass spectrometry-based metabolomics, Mass Spectrom. Rev. 26 (2007) 51-78. |
| [51] | I. Tkac, P.G. Henry, P. Andersen, et al., Highly resolved in vivo 1H NMR spectroscopy of the mouse brain at 9.4 T, Magn. Reson. Med. 52 (2004) 478-484. |
| [52] | J.D. Xu, P.Z. Zhu, Z.H. Gan, et al., Natural-abundance 43Ca solid-state NMR spectroscopy of bone, J. Am. Chem. Soc. 132 (2010) 11504-11509. |
| [53] | L. Da Silva, M. Godejohann, F.P. Martin, et al., High-resolution quantitative metabolome analysis of urine by automated flow injection NMR, Anal. Chem. 12 (2013) 5801-5809. |
| [54] | N. MacKinnon, W. Ge, A.P. Khan, et al., Variable reference alignment: an improved peak alignment protocol for NMR spectral data with large intersample variation, Anal. Chem. 84 (2012) 5372-5379. |
| [55] | T.L. James, Fundamentals of NMR (Chapter 1). https://www.biophysics.org/Portals/1/PDFs/Education/james.pdf. |
| [56] | R. Godelmann, F. Fang, E. Humpfer, et al., Targeted and nontargeted wine analysis by 1H-NMR spectroscopy combined with multivariate statistical analy-sis. Differentiation of important parameters: grape variety, geographical origin, year of vintage, J. Agric. Food. Chem. 61 (2013) 5610-5619. |
| [57] | M. Spraul, B. Schütz, P. Rinke, et al., NMR-based multi parametric quality control of fruit juices: SGF profiling, Nutrients 1 (2009) 148-155. |
| [58] | O. Beckonert, H.C. Keun, T.M. Ebbels, et al., Metabolic profiling, metabolomic and metabonomic procedures for NMR spectroscopy of urine, plasma, serum and tissue extracts, Nat. Protoc. 2 (2007) 2692-2703. |
| [59] | T. Fujiwara, A. Ramamoorthy, How far can the sensitivity of NMR be increased? Ann. Rep. NMR Spectrosc. 58 (2006) 155-175. |
| [60] | E.J. Saude, C.M. Slupsky, B.D. Sykes, Optimization of NMR analysis of biological fluids for quantitative accuracy, Metabolomics 2 (2006) 113-123. |
| [61] | D. Wu, A. Chen, C.S. Johnson, An improved diffusion-ordered spectroscopy experiment incorporating bipolar-gradient pulses, J. Magn. Reson. 115 (1995) 260-264. |
| [62] | P. Sandusky, D. Raftery, Use of selective TOCSY NMR experiments for quantifying minor components in complex mixtures: application to the metabonomics of amino acids in honey, Anal. Chem. 77 (2005) 2455-2463. |
| [63] | Y. Xi, J.S. de Ropp, M.R. Viant, D.L. Woodruff, P. Yu, Automated screening for metabolites in complex mixtures using 2D COSY NMR spectroscopy, Metabolomics 2 (2006) 221-233. |
| [64] | G.A. Gowda, S. Zhang, H.W. Gu, et al., Metabolomics-based methods for early disease diagnostic: a review, Expert Rev. Mol. Diagn. 8 (2008) 617-633. |
| [65] | O. Beckonert, M. Coen, H.C. Keun, et al., High-resolution magic-angle spinning NMR spectroscopy for metabolic profiling of intact tissues, Nat. Protoc. 5 (2010) 1019-1032. |
| [66] | K.H. Mroue, R.C. Zhang, P.Z. Zhu, et al., Acceleration of natural-abundance solidstate MAS NMR measurements on bone by paramagnetic relaxation from gadolinium-DTPA, J. Magn. Reson. 244 (2014) 90-97. |
| [67] | I.C. Smith, R. Baert, Medical diagnosis by high resolution NMR of human specimens, IUBMB Life 55 (2003) 273-277. |
| [68] | A.L. Merz, N.J. Serkova, Use of nuclear magnetic resonance-based metabolomics in detecting drug resistance in cancer, Biomark. Med. 3 (2009) 289-306. |
| [69] | H.J. Issaq, Q.N. Van, T.J. Waybright, G.M. Muschik, T.D. Veenstra, Analytical and statistical approaches to metabolomics research, J. Sep. Sci. 32 (2009) 2186-2199. |
| [70] | M. Yuan, S.B. Breitkopf, X.M. Yang, J.M. Asara, A positive/negative ion-switching, targeted mass spectrometry-based metabolomics platform for bodily fluids, cells, and fresh and fixed tissue, Nat. Protoc. 7 (2012) 872-881. |
| [71] | S.C. Brown, G. Kruppa, J.L. Dasseux, Metabolomics applications of FT-ICR mass spectrometry, Mass Spectrom. Rev. 24 (2005) 223-231. |
| [72] | W.Y. Lu, M.F. Clasquin, E. Melamud, et al., Metabolomic analysis via reversedphase ion-pairing liquid chromatography coupled to a stand alone orbitrap mass spectrometer, Anal. Chem. 82 (2010) 3212-3221. |
| [73] | J.H. Wang, T.T. Christison, K. Misuno, et al., Metabolomic profiling of anionic metabolites in head and neck cancer cells by capillary ion chromatography with orbitrap mass spectrometry, Anal. Chem. 86 (2014) 5116-5124. |
| [74] | S. Ma, S.K. Chowdhury, K.B. Alton, Application of mass spectrometry for metabolite identification, Curr. Durg Metab. 7 (2006) 503-523. |
| [75] | E.P. Diamandis, Mass spectrometry as a diagnostic and a cancer biomarker discovery tool: opportunities and potential limitations, Mol. Cell. Proteomics 3 (2004) 367-378. |
| [76] | R.B. Cody, J.A. Laramée, H.D. Durst, Versatile new ion source for the analysis of materials in open air under ambient conditions, Anal. Chem. 77 (2005) 2297-2302. |
| [77] | KnowItAll Enterprise Server. http://www.bio-rad.com/en-us/product/spectroscopy-software/knowitall-enterprise-server. |
| [78] | A. O'Sullivan, D. Avizonis, J.B. German, C.M. Slupsky, Software tools for NMR metabolomics, eMagRes (2011), http://dx.doi.org/10.1002/9780470034590.emrstm1232. |
| [79] | M. Vinaixa, S. Samino, I. Saez, et al., A guideline to univariate statistical analysis for LC/MS-based untargeted metabolomics-derived data, Metabolites 2 (2012) 775-795. |
| [80] | R.A. Johnson, D.W. Wichern, Applied Multivariate Statistical Analysis, Prentice Hall, 1999. |
| [81] | M. Barker, W. Rayens, Partial least squares for discrimination, J. Chemom. 17 (2003) 166-173. |
| [82] | B.M. Beckwith-Hall, J.T. Brindle, R.H. Barton, et al., Application of orthogonal signal correction to minimize the effects of physical and biological variation in high resolution 1H NMR spectra of biofluids, Analyst 127 (2002) 1283-1288. |
| [83] | O. Cloarec, M.E. Dumas, A. Craig, et al., Statistical total correlation spectroscopy: an exploratory approach for latent biomarker identification from metabolic 1H NMR data sets, Anal. Chem. 77 (2005) 1282-1289. |
| [84] | D.J. Crockford, E. Holmes, J.C. Lindon, et al., Statistical heterospectroscopy, an approach to the integrated analysis of NMR and UPLC-MS data sets: application in metabonomic toxicology studies, Anal. Chem. 78 (2006) 363-371. |
| [85] | H.W. Chen, Z.Z. Pan, N. Talaty, D. Raftery, R.G. Cooks, Combining desorption electrospray ionization mass spectrometry and nuclear magnetic resonance for differential metabolomics without sample preparation, Rapid Commun. Mass Spectrom. 20 (2006) 1577-1584. |
| [86] | HMBD. http://www.hmdb.ca/. |
| [87] | METAGENE. http://www.metabolomicssociety.org/databases. |
| [88] | H. Horai, M. Arita, S. Kanaya, et al., MassBank: a public repository for sharing mass spectral data for life sciences, J. Mass Spectrom. 45 (2010) 703-714. |
| [89] | E.L. Ulrich, H. Akutsu, J.F. Doreleijers, et al., BioMagResBank, Nucleic Acids Res. 36 (2008) 402-408. |
| [90] | N. MacKinnon, B.S. Somashekar, P. Tripathi, MetaboID: a graphical user interface package for assignment of 1H NMR spectra of bodyfluids and tissues, J. Magn. Reson. 226 (2013) 93-99. |
| [91] | AMIX. http://www.bruker.com/products/mr/nmr/nmr-software/software/ amix/overview.html. |
| [92] | CHENOMX. http://www.chenomx.com/software/software.php?pageID=65. |
| [93] | J.L. Griffin, R.A. Kauppinen, Tumour metabolomics in animal models of human cancer, J. Proteome. Res. 6 (2007) 498-505. |
| [94] | D. Moka, R. Vorreuther, H. Schicha, et al., Biochemical classification of kidney carcinoma biopsy samples using magic-angle spinning 1H nuclear magnetic resonance spectroscopy, J. Pharm. Biomed. Anal. 17 (1998) 125-132. |
| [95] | S. Srivastava, R. Roy, V. Gupta, et al., Proton HR-MAS MR spectroscopy of oral squamous cell carcinoma tissues: an ex vivo study to identify malignancy induced metabolic fingerprints, Metabolomics 7 (2011) 278-288. |
| [96] | B.S. Somashekar, P. Kamarajan, T. Danciu, et al., Magic angle spinning NMRbased metabolic profiling of head and neck squamous cell carcinoma tissues, J. Proteome Res. 10 (2011) 5232-5241. |
| [97] | T. Bezabeth, O. Odlum, R. Nason, et al., Prediction of treatment response in head and neck cancer by magnetic resonance spectroscopy, Am. J. Neuroadiol. 26 (2005) 2108-2113. |
| [98] | A. Shukla-Dave, H. Poptani, L.A. Loevner, et al., Prediction of treatment response of head and neck cancers wtih P31 MR spectroscopy from pretreatment relative phosphomonoester levels, Acad. Radiol. 9 (2002) 688-694. |
| [99] | S.K. Mukherji, S. Schiro, M. Castillo, et al., Proton MR spectroscopy of squamous cell carcinoma of the extracranial head and neck: in vitro and in vivo Studies, Am. J. Neuroadiol. 18 (1997) 1057-1072. |
| [100] | L. Torregrossa, L. Shintu, J.N. Chandran, et al., Toward the reliable diagnosis of indeterminate thyroid lesions: a HRMAS NMR-based metabolomics case study, J. Proteome Res. 11 (2012) 3317-3325. |
| [101] | P. Tripathi, P. Kamarajan, B.S. Somashekar, et al., Delineating metabolic signatures of head and neck squamous cell carcinoma: phospholipase A2, a potential therapeutic target, Int. J. Biochem. Cell. Biol. 44 (2012) 1852-1861. |
| [102] | J.L. Zhou, B. Xu, J. Huang, et al., 1H NMR-based metabonomic and pattern recognition analysis for detection of oral squamous cell carcinoma, Clin. Chim. Acta 401 (2009) 8-13. |
| [103] | S. Tiziani, V. Lopes, U.L. Günther, Early stage diagnosis of oral cancer using 1H NMR-based metabolomics, Neoplasia 11 (2009) 269-276. |
| [104] | K. Yonezawa, S. Nishiumii, J. Kitamoto-Matsuda, et al., Serum and tissue metabolomics of head and neck cancer, Cancer Genomics Proteomics 10 (2013) 233-238. |
| [105] | G.X. Xie, T.L. Chen, Y.P. Qui, et al., Urine metabolite profiling offers potential early diagnosis of oral cancer, Metabolomics 8 (2012) 220-231. |
| [106] | S. Aygen, U. Dürr, P. Hegele, et al., NMR-based screening for inborn errors of metabolism: initial results from a study on Turkish neonates, JIMD Rep. 16 (2014) 101-111. |
| [107] | J. Wei, G. Xie, Z. Zhou, et al., Salivary metabolite signatures of oral cancer and leukoplakia, Int. J. Cancer 129 (2011) 2207-2217. |
| [108] | S.K. Yan, B.J. Wei, Z.Y. Lin, et al., A metabonomic approach to the diagnosis of oral squamous cell carcinoma, oral lichen planus, and oral leukoplakia, Oral Oncol. 44 (2008) 477-483. |
| [109] | M. Sugimoto, D.T. Wong, A. Hirayama, T. Soga, M. Tomita, Capillary electrophoresis mass spectrometry-based saliva metabolomics identified oral, breast and pancreatic cancer-specific profiles, Metabolomics 6 (2010) 78-95. |
| [110] | A. Aimetti, S. Cacciatore, A. Graziano, L. Tenori, Metabonomic analysis of saliva reveals generalized chronic periodontitis signature, Metabolomics 8 (2012) 465-474. |
| [111] | S. Meier, M. Karlsson, P.R. Jensen, M.H. Lerche, J. Duus, Metabolic pathway visualization in living yeast by DNP-NMR, Mol. BioSyst. 7 (2011) 2834-2836. |