


b Department of Nephrology, Nanjing Children's Hospital, Nanjing Medical University, Nanjing 210008, China;
c Department of Radiology, University of Michigan School of Medicine, Ann Arbor, MI 48109, USA;
d Department of Automation, Nanjing College of Chemical Technology, Nanjing 210048, China
The chemical compositions of tissue,such as DNA/RNA, hemoglobin,melanin,water and lipid,bring important information regarding the anatomical,functional,metabolic,and molecular/ genetic processes in biological systems. Therefore,tissue chemical compositions can be employed as the reference standards for the diagnosis of many diseases [1, 2]. Characterizing chemical information in biological tissue has always been the subject of intense research in chemistry as well as medicine.
Due to the unique optical spectra of atoms and molecules, optical spectroscopic techniques have been used to analyze the chemical properties of materials in analytical chemistry [3], material science [4] and astronomy [5] for a long time. With the advantages in detecting chemical information,optical modalities, such as optical coherence tomography [6],two-photon microscopy [7] and confocal laser scanning microscopy [8],have also shown great success in biomedical imaging [9, 10, 11]. Most biological tissues are strongly scattering for electromagnetic waves in the spectral range from ultraviolet to near-infrared. Within this range,the optical diffusion limit,i.e. optical mean free path,in most biological tissues is on the order of 1 mm. When beyond this depth,multiple light scattering would quickly randomize the trajectories of incident photons and prevent effective optical focusing in tissue [12, 13, 14, 15]. Therefore,pure optical modalities either suffer from poor spatial resolution or have limited imaging depth [16].
In comparison to optical wave,acoustic wave is much less scattered in biological tissue. In soft biological tissues,the acoustic scattering coefficient is about three orders of magnitude less than the optical scattering coefficient [17]. Benefitted from the lower scattering,acoustic method can achieve much better spatial resolution in deep tissue,usually equivalent to 1/200 of the imaging depth [12]. Conventional acoustic imaging,such as Bmode ultrasonography,however,is purely relying on the detection of mechanical properties and structures of biological tissues without considering tissue chemical information (i.e. the contents and changes in chemical components). Therefore,B-mode ultrasonography is not sensitive to tissue physiology and function which are highly valuable for the diagnosis of many diseases.
PAI is a recently developed technique whereby non-ionizing, non-invasive laser pulses are used to generate ultrasonic signals from biological tissues followed by signal detection via ultrasonic transducers to form images. Benefited from the low scattering of ultrasonic signals,PAI is able to achieve high resolution in optically scattering biological tissues at unprecedented depths. Moreover, like other conventional optical imaging modalities,PAI can be used to differentiate tissues containing various chemical substances based on their different optical absorption spectra. The hybrid PAI technology,by combining the advantages of both light and sound, shows tremendous potential applications in medicine and biology, and has already been used in evaluating the anatomical,functional, metabolic,molecular and genetic information of biological samples [12, 13, 14, 15, 16, 17, 18, 19, 20].
In this mini-review article,we will first introduce the basic principles and two major implementations of PAI,photoacoustic tomography (PAT) and photoacoustic microscopy (PAM). The applications of PAI in detecting the chemical compositions and evaluating the microstructures in biological tissues will also be introduced. 2. Principles and implementations
When biological tissue is illuminated by laser light,the electrons transit from the ground state to an excited state as a result of photon absorption. The excitation is defined as thermally or stress confined if the laser pulse duration is much shorter than the thermal relaxation. The rapid deposition of laser energy causes an immediate increase in pressure within the radiated region. The release of this pressure transforms thermoelastic expansion to ultrasonic wave,named photoacoustic (PA) wave. The PA pressure p(r,t) at position r and time t can be described as [21, 22]:
Assuming Г(r) is homogenous,the spatially distributed optical absorption coefficient A(r) in a 3-dimensional space or a 2- dimensional cross-section can be obtained. Because the optical absorption A(r) of a biological tissue is closely related to its chemical composition,the spectroscopic form of PAI,i.e. imaging the target tissue with multiple optical wavelengths,allows quantitative measurements of the chemical and functional information in the tissue.
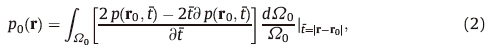
Based on the differentmethods for image acquisition aswell as the differences in targeted spatial resolution and imaging depth, PAI can be divided into two large categories which are PAT and PAM. Fig. 1(a) [24] shows a typical PAT system where an unfocused laser beam covering a large area on the sample generates PA signals and an unfocused ultrasound transducer detects the PA signals. The tomographic images are generated from PA signals by using a reconstruction algorithm based on the inversely solving the photoacoustic wave equation. Several reconstruction algorithms,such as back projection [23],Radon transform [25],and Fourier-domain algorithms [26],have been developed for PAT. The spatial resolution and the penetration depth of a PAT system are scalable with the ultrasonic frequency. The lateral resolution of PAT can be estimated as RL = 0.71c/ (NAc′f0),where c is the speed of PA signal,f0 is the center ultrasonic frequency,and NAc is the numerical aperture of the transducer. The axial resolution of PAT can be estimated by RA = 0.88c/△f, where △f is the bandwidth for photoacoustic signal detection and is proportional to f0 [12]. The imaging depth is limited by not only the frequency-dependent acoustic attenuation but also the optical attenuation in the biological sample.

|
Download:
|
| Fig. 1. SExample implementations of PAI,including (a) PAT [24],(b) AR-PAM [27],and (c) PAE [28]. | |
In contrast to PAT,Fig. 1(b) [27] shows a typical PAM system where a focused laser beam is used for signal generation and a spherically focused ultrasound transducer is used for signal detection. To generate an image,PAM scans along the sample surface point by point without involving tomographic image reconstruction. PAM is further divided into two categories including optical resolution PAM (OR-PAM),where the lateral resolution is determined by optical focus,and acoustic resolution PAM (AR-PAM),where the lateral resolution is determined by ultrasonic focus [12]. OR-PAM utilizing a strongly focused light beam for signal excitation results in a diffraction-limited optical resolution in the lateral direction which can be estimated by 0.51λopt/NA,where NA is the numerical aperture of the optical lens, and λopt is the wavelength of the laser. PA signals could be picked up by an unfocused ultrasonic transducer,or a focused ultrasonic transducer [12] aligned confocally with the optical lens to maximize the detection sensitivity. The axial resolution of ORPAM is still acoustically determined by the bandwidth of the ultrasonic transducer,△f,following the equation of 0.88c/△f [17]. The imaging depth of OR-PAM is determined by the optical mean free path which is usually within 1 mm for most biological tissues. Similar to OR-PAM or PAT,the axial resolution of AR-PAM is determined by the bandwidth of the ultrasonic transducer. Its lateral resolution,however,is determined by the acoustic focal diameter,following the equation of 0.71cl/(f0·c/2),where NAc is the aperture of an ultrasound transducer and l is the focal length [17]. AR-PAM can provide spatial resolution on the order of micrometer and imaging depth of up to several millimeters [17]. Fig. 1(c) [28] shows a miniaturized PAM system for endoscopic imaging of internal organs. Compared to routinely used clinical ultrasound endoscopy,photoacoustic endoscopy (PAE) offers similar spatial resolution and imaging depth while providing additional functional information [29]. In recent years,PAE has been developed for potential applications in esophagus and colon [28, 29]. 3. Chemical information in photoacoustic images
In biological tissues,each chemical composition has its specific optical absorption spectrum from ultraviolet (UV) to nearinfrared (NIR). Electromagnetic radiation is more likely to be absorbed at wavelengths which match the energy difference between two quantum-mechanical states of the molecules. The optical absorption properties over a range of electromagnetic wavelengths,namely absorption spectroscopy,are primarily determined by the electronic and molecular structures of the sample. As a result,the optical absorption properties of amaterial are useful in chemical analysis because of its high specificity and quantitative nature. On the one hand,the excellent specificity associated with optical absorption properties allows different chemical compounds in biological tissue to be distinguished accurately. On the other hand,with the knowledge of the optical absorption coefficients of all the chemical components,the measurement of absorption spectroscopy of a sample can be used to quantitatively determine the absolute concentrations of chemical compounds. PAI is essentially probing the spectroscopic optical absorption properties of biological tissue by means of acoustic detection. Therefore,it naturally inherits the merits of optical spectroscopy in chemical analysis.
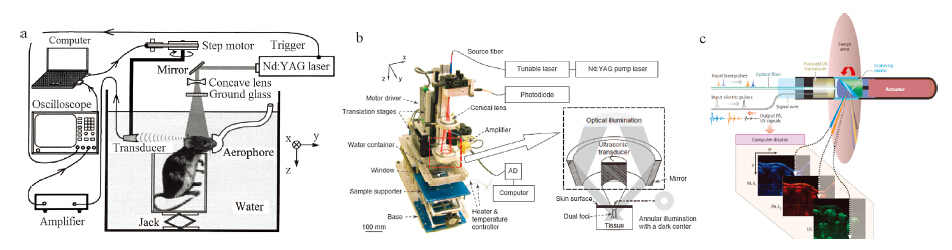
By targeting the selective optical absorption fingerprint of molecules,PAI can acquire the information of a specific chemical composition in tissue by choosing appropriate optical wavelength. For example,based on the strong optical absorption of DNA and RNA in UV spectrum,PAM has successfully imaged cell nuclei without involving any contrast agent (i.e. label-free),as an example shown in Fig. 2(a) [30]. Since cancer cells lose their control of DNA replication and their nuclei are different from normal nuclei in morphology,successful imaging of cell nuclei may contribute to cancer diagnosis and prognosis [31].

|
Download:
|
| Fig. 2. PA images presenting the chemical information of biological tissues. (a) An image acquired at UV spectrum showing the morphology of cell nuclei [30]. (b) An image of mouse brain vasculature and lesion acquired at 570 nm [19]. (c) Dual-wavelength PAM of vasculature in a mouse ear reflecting the spatially distributed oxygen saturation (SO2) of hemoglobin [32]. (d) An image showing scattered lipid deposition in an arterial wall [36]. | |
Hemoglobin accounts for most of the optical absorption in mammalian tissue in the visible to near-infrared spectrum [12]. One advantage of PAI working in this spectrum is its highresolution and high-sensitivity in presenting the volumetric information of blood volume in biological tissues. By mapping hemoglobin distribution,PAI has demonstrated excellent sensitivity in imaging and quantifying hemodynamic parameters in brain. As an example shown in Fig. 2(b),imaging of the vasculature as well as a blood-rich lesion in a small-animal brain has been achieved by a PAI system working at 570-nm wavelength [19]. Since blood circulation is highly relevant to metabolism and functions of tissues,functional imaging of blood circulation without involving contrast agents could strongly impact the research and clinical management of a variety of diseases,for example,diabetes,coronary artery disease,hypertension,atherosclerosis, and peripheral vascular diseases [12].
Similar to optical spectroscopy broadly used in analytical chemistry,multi-wavelength spectroscopic PAI can quantify the absolute concentrations of chemical compounds,and reveal rich functional and physiological information in biological samples. Based on the spectroscopic optical absorption differences between oxygenated hemoglobin (HbO2) and deoxygenated hemoglobin (HbR),two major forms of hemoglobin in blood, PAI can quantify the relative concentrations of HbO2 and HbR within a single blood vessel,and subsequently extract the information of oxygen saturation (SO2) and total relative concentration of hemoglobin (HbT). Using laser illumination with different opticalwavelengths,λ1 and λ2,PAI can achieve two optical absorption images,μa(λ1) and μa(λ2),of a sample. As a first-order approximation,the blood absorption μa(λi) can be related to the relative concentrations Cox and Cde of HbO2 and HbR by the following equations:


When the optical wavelength is beyond 1000 nm,the optical absorption in biological tissues is determined mainly by molecular vibration. Multi-wavelength photoacoustic imaging within the overtone bands has demonstrated the capability in differentiating fat and collagen in biological tissues. As an example,Fig. 2(d) is a PA image at 1195 nm showing scattered lipid deposition in an arterial wall [36]. In another research using 1200 nm light,PAI has been employed to study the lipid content in fatty liver [37].
Besides imaging based on endogenous contrast,PAI can also employ exogenous contrast agent to enhance the optical contrast and achieve the imaging of ‘‘invisible’’ biomarkers. Exogenous contrast agents are artificial materials which act to enable or augment the visibility of the preferred objects throughout the electromagnetic spectrum. The applications of exogenous contrast agents give PAI the ability to measure chemical and biological information at the molecular level. A great variety of PA contrast agents have been developed in recent years,such as organic dyes [38],metallic nanoparticles [39, 40],carbon nanotubes [41],and oligomer [42]. These agents have been wildly used in bio-medical and bio-chemical research. Based on the passive targeting mechanism,agents can significantly increase the contrast of PAI in cancer detecting [38, 42] and other applications [43]. PAI based on Doppler effect can achieve accurate flow measurements when powered by nanoparticles [44]. Furthermore,PAI in combination with contrast agents has shown promise in guiding and monitoring the therapeutic procedures [39]. An example of PAI enhanced by oligomerizable agents is shown in Fig. 3 [42],where the contrast of PAI of mice tumors is increased significantly after the agent administration.

|
Download:
|
| Fig. 3. Enhancement of PA images of mice tumors by using exogenous contrast agents. (a) LoVo tumor PA image before injection of contrast agents. (b) LoVo tumor PA image after injection of contrast agents. (c) MDA-Mb-233 tumor PA image before injection of contrast agents. (d) MDA-Mb-233 tumor PA image after injection of contrast agents [42]. | |
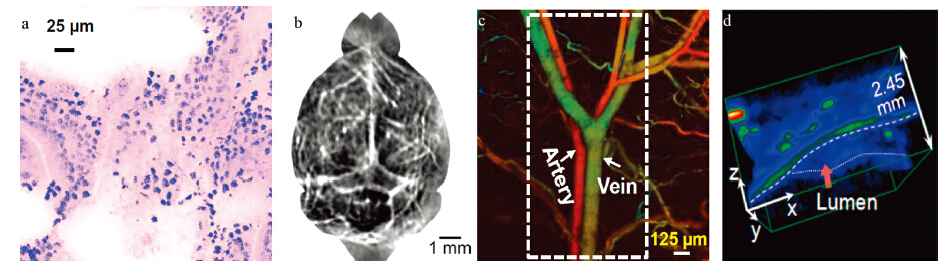
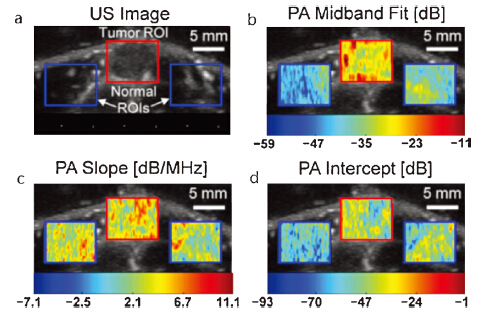
Besides revealing the chemical compositions of tissue,PAI also facilitates the assessment of histological microstructures in tissue. A study based on Monte Carlo simulation suggests that the ultrasonic spectral properties of PA signals are related to the erythrocyte aggregation level [45]. The distinctive features of the PA spectrum can be used to rapidly quantify variations in the morphology of single red blood cell [46]. In another research,as the result shown in Fig. 4 [47],significant differences in PA spectral parameters between cancerous tissue and noncancerous background tissue have been observed,suggesting that PA spectral analysis may enable cancer detection and tissue characterization in vivo. In a more recent study,the feasibility of differentiating fatty and normal livers by PA spectral analysis has been demonstrated, as the result shown in Fig. 5. The changes of histological microstructures in the liver associated with hemoglobin and lipid were characterized respectively by analyzing the power spectra of the radio-frequency PA signals at 532 nm and 1200 nm wavelengths, respectively [37].

|
Download:
|
| Fig. 4. PA spectral parametric imaging of a tumor [47]. (a) B-mode ultrasound (US) image shows the region of interest (ROIs) selected for the tumor and normal tissue. The PA spectral parametric images, including (b) midband fit [dB], (c) slope [dB/ MHz], and (d) intercept [dB], are superimposed on the ultrasound image. The color bar below each image map shows the range of each parameter in the ROIs. | |

|
Download:
|
| Fig. 5. Pixelwise parameters (intercept, midband fit, and slope) of typical sample specimen (fatty and normal livers) at 1200 nm and 532 nm. At 1200 nm, normal liver shows lower intercept, midband-fit, and slope values compared with fatty liver. At 532 nm, normal liver shows higher intercept and midband-fit values but lower slope values compared with fatty liver [37]. | |
The study on well-controlled gel phantoms containing optically absorbing microspheres has facilitated the understanding of the relationship between the PA spectral parameters (intercept,midband fit and slope) and the physical properties (density and sizes) of the optical absorbers [48]. A more interesting finding,as the results shown in Fig. 6 [49],is that PA spectral analysis can evaluate sub-resolution microstructures and can efficiently assess detailed tissue featureswithout need for broad-bandwidth and high-frequency detection of signals. In another study,a method of PA spectral matching has been developed to quantitatively evaluate stochasticmicrostructure in turbid media [50]. The frequency domain PA technique offers fundamental advantages for addressing a number of practical problems faced by conventional PAI. First,being able to performat relatively low frequencies avoids the high cost and the limited imaging depth associated with high-frequency PAI systems. Second,PA spectral analysis separates the effects from system components and tissue properties on image features,and delivers system-independent quantitative results [50]. Third,averaged power spectra provide a method of addressing the stochastic nature of tissue microstructure,and lead to measurements that are quantitative and repeatable.

|
Download:
|
| Fig. 6. PA B-mode images and PA spectral parameter images of gel phantoms containing optically absorbing microspheres. (a, b), PA B-mode images of gel inclusions containing 49 μm and 199 μm microspheres, respectively. (c, d) PA spectral parameter images of gel inclusions containing 49 μm and 199 μm microspheres, respectively [49]. | |
In this mini-review article,fundamental principles and two major implementations of PAI including PAT and PAM are introduced. Then the capability of multi-wavelength PAI in evaluating chemical information in tissues,and the feasibility of PA spectral analyses in evaluating histological microstructures in biological samples are demonstrated. Combining light and ultrasound,PAI inherits the high resolution of ultrasonography in deep tissue and the high sensitivity of optical imaging to functional and chemical information of biological tissues. By taking advantages from its unique multi-physics nature,PAI,unlike any other optical or ultrasonic technologies,enables comprehensive and objective evaluation of both chemical and physical features in the target tissue,and holds promise for achieving quantitative imaging. In the past decade,the very active researches on PAI have already demonstrated many potential applications in biology and medicine. As a non-ionizing and non-invasive biomedical technology, PAI is now ready for the translation from basic research to clinical settings.
AcknowledgmentsThis work was supported by the National Basic Research Program of China (No. 2012CB921504),the National Natural Science Foundation of China (Nos. 11422439,11274167, 11274171,and 11028408),and SRFDP (No. 20120091110001).
| [1] | L. Gortzak-Uzan,W. Jimenez, S. Nofech-Mozes, et al., Sentinel lymph node biopsy vs. pelvic lymphadenectomy in early stage cervical cancer: is it time to change the gold standard, Gynecol. Oncol. 116 (2010) 28-32. |
| [2] | D. Joy, V.R. Thava, B.B. Scott, Diagnosis of fatty liver disease: is biopsy necessary, Eur. J. Gastroenterol. Hepatol. 15 (2003) 539-543. |
| [3] | Z.H. Cui, X.D. Wang, J.C. Guo, et al., Synthesis, spectroscopic properties and applications of novel N-heterocycle-containing benzotriazoles as UV absorbers, Chin. Chem. Lett. 23 (2012) 1019-1022. |
| [4] | Y.N. Ni, W. Lin, Near-infrared spectra combined with partial least squares for pH determination of toothpaste of different brands, Chin. Chem. Lett. 22 (2011) 1473-1476. |
| [5] | J. Harlander, F.L. Roesler, Spatial heterodyne spectroscopy-a novel interferometric- technique for ground-based and space astronomy, Proc. Soc. Photo-Opt. Instrum. 1235 (1990) 622-633. |
| [6] | A.G. Podoleanu, Optical coherence tomography, J. Microsc.-Oxford 247 (2012) 209-219. |
| [7] | F. Helmchen, W. Denk, Deep tissue two-photon microscopy, Nat. Methods 2 (2005) 932-940. |
| [8] | R. Rezakhaniha, A. Agianniotis, J.T.C. Schrauwen, et al., Experimental investigation of collagen waviness and orientation in the arterial adventitia using confocal laser scanning microscopy, Biomech. Model. Mechanobiol. 11 (2012) 461-473. |
| [9] | K.W. Dunn, R.M. Sandoval, K.J. Kelly, et al., Functional studies of the kidney of living animals using multicolor two-photon microscopy, Am. J. Physiol.: Cell Physiol. 283 (2002) C905-C916. |
| [10] | M.A. Yaseen, S. Sakadzic, W.C. Wu, et al., in vivo imaging of cerebral energy metabolism with two-photon fluorescence lifetime microscopy of NADH, Biomed. Opt. Express 4 (2013) 307-321. |
| [11] | T. Fernandez-Alfonso, K.M.N.S. Nadella, M.F. Iacaruso, et al., Monitoring synaptic and neuronal activity in 3D with synthetic and genetic indicators using a compact acousto-optic lens two-photon microscope, J. Neurosci. Methods 222 (2014) 69- 81. |
| [12] | L.V. Wang, S. Hu, Photoacoustic tomography: in vivo imaging from organelles to organs, Science 335 (2012) 1458-1462. |
| [13] | C.X. Qin, K. Cheng, K. Chen, et al., Tyrosinase as a multifunctional reporter gene for photoacoustic/MRI/PET triple modality molecular imaging, Sci. Rep. 3 (2013) 1490. |
| [14] | C.Y. Li, J.M. Yang, R.M. Chen, et al., Photoacoustic endoscopic imaging study of melanoma tumor growth in a rat colorectum in vivo, Photons Plus Ultrasound: Imag. Sens. 2013 (2013) 8581. |
| [15] | L.V. Wang, Multiscale photoacoustic microscopy and computed tomography, Nat. Photonics 3 (2009) 503-509. |
| [16] | J.P. Culver, V. Ntziachristos, M.J. Holboke, A.G. Yodh, Optimization of optode arrangements for diffuse optical tomography: a singular-value analysis, Opt. Lett. 26 (2001) 701-703. |
| [17] | C.H. Li, L.V. Wang, Photoacoustic tomography and sensing in biomedicine, Phys. Med. Biol. 54 (2009) R59-R97. |
| [18] | J.J. Yao, L.D. Wang, C.Y. Li, C. Zhang, L.V. Wang, Photoimprint photoacoustic microscopy for three-dimensional label-free subdiffraction imaging, Phys. Rev. Lett. 112 (2014) 014302. |
| [19] | J. Yao, J. Xia, K.I. Maslov, et al., Noninvasive photoacoustic computed tomography of mouse brain metabolism in vivo, Neuroimage 64 (2013) 257-266. |
| [20] | S. Yang, D. Xing, Q. Zhou, L. Xiang, Y. Lao, Functional imaging of cerebrovascular activities in small animals using high-resolution photoacoustic tomography, Med. Phys. 34 (2007) 3294-3301. |
| [21] | I.G. Calasso, W. Craig, G.J. Diebold, Photoacoustic point source, Phys. Rev. Lett. 86 (2001) 3550-3553. |
| [22] | G.J. Diebold, M.I. Khan, S.M. Park, Photoacoustic signatures of particulate matter-optical production of acoustic monopole radiation, Science 250 (1990) 101-104. |
| [23] | M.H. Xu, L.V. Wang, Universal back-projection algorithm for photoacoustic computed tomography, Phys. Rev. E 71 (2005) 016706. |
| [24] | X.D. Wang, Y.J. Pang, G. Ku, et al., Noninvasive laser-induced photoacoustic tomography for structural and functional in vivo imaging of the brain, Nat. Biotechnol. 21 (2003) 803-806. |
| [25] | M. Haltmeier, O. Scherzer, P. Burgholzer, R. Nustero, G. Paltauf, Thermoacoustic tomography and the circular radon transform: exact inversion formula, Math. Models Methods Appl. Sci. 17 (2007) 635-655. |
| [26] | K.P. Kostli, P.C. Beard, Two-dimensional photoacoustic imaging by use of Fouriertransform image reconstruction and a detector with an anisotropic response, Appl. Opt. 42 (2003) 1899-1908. |
| [27] | H.F. Zhang, K. Maslov, G. Stoica, L.V. Wang, Functional photoacoustic microscopy for high-resolution and noninvasive in vivo imaging, Nat. Biotechnol. 24 (2006) 848-851. |
| [28] | J.M. Yang, C. Favazza, R.M. Chen, et al., Simultaneous functional photoacoustic and ultrasonic endoscopy of internal organs in vivo, Nat. Med. 18 (2012) 1297- 1302. |
| [29] | J.M. Yang, C. Favazza, R.M. Chen, et al., Volumetric photoacoustic endoscopy of upper gastrointestinal tract: ultrasonic transducer technology development, Photons Plus Ultrasound: Imag. Sens. 7899 (2011) 78990D. |
| [30] | D.K. Yao, K. Maslov, K.K. Shung, Q.F. Zhou, L.V. Wang, in vivo label-free photoacoustic microscopy of cell nuclei by excitation of DNA and RNA, Opt. Lett. 35 (2010) 4139-4141. |
| [31] | O.L. Mangasarian, W.N. Street, W.H. Wolberg, Breast cancer diagnosis and prognosis via linear programming, Oper. Res. 43 (1995) 570-577. |
| [32] | J. Yao, L.V. Wang, Photoacoustic microscopy, Laser Photonics Rev. 7 (2013) 758-778. |
| [33] | G.J. Huang, Z. Si, S.H. Yang, C. Li, D. Xing, Dextran based pH-sensitive near-infrared nanoprobe for in vivo differential-absorption dual-wavelength photoacoustic imaging of tumors, J. Mater. Chem. 22 (2012) 22575-22581. |
| [34] | G. Ku, X.D. Wang, X.Y. Xie, G. Stoica, L.V. Wang, Imaging of tumor angiogenesis in rat brains in vivo by photoacoustic tomography, Appl. Opt. 44 (2005) 770-775. |
| [35] | C.P. Favazza, L.A. Cornelius, L.V.Wang, in vivo functional photoacoustic microscopy of cutaneous microvasculature in human skin, J. Biomed. Opt. 16 (2011) 026004. |
| [36] | H.W. Wang, N. Chai, P. Wang, et al., Label-free bond-selective imaging by listening to vibrationally excited molecules, Phys. Rev. Lett. 106 (2011) 238106. |
| [37] | G. Xu, Z.X. Meng, J.D. Lin, et al., The functional pitch of an organ: quantification of tissue texture with photoacoustic spectrum analysis, Radiology 271 (2014) 248-254. |
| [38] | K. Kanazaki, K. Sano, A. Makino, et al., Development of human serum albumin conjugated with near-infrared dye for photoacoustic tumor imaging, J. Biomed. Opt. 19 (2014) 096002, http://biomedicaloptics.spiedigitallibrary.org/article. aspx?articleid=1903205. |
| [39] | H. Ju, R.A. Roy, T.W. Murray, Gold nanoparticle targeted photoacoustic cavitation for potential deep tissue imaging and therapy, Biomed. Opt. Express 4 (2013) 66-76. |
| [40] | K.A. Homan, M. Souza, R. Truby, et al., Silver nanoplate contrast agents for in vivo molecular photoacoustic imaging, ACS Nano 6 (2012) 641-650. |
| [41] | L. Wu, X. Cai, K. Nelson, et al., A green synthesis of carbon nanoparticles from honey and their use in real-time photoacoustic imaging, Nano Res. 6 (2013) 312-325. |
| [42] | A. Dragulescu-Andrasi, S.R. Kothapalli, G.A. Tikhomirov, et al., Activatable oligomerizable imaging agents for photoacoustic imaging of furin-like activity in living subjects, J. Am. Chem. Soc. 135 (2013) 11015-11022. |
| [43] | L. Nie, X. Chen, Structural and functional photoacoustic molecular tomography aided by emerging contrast agents, Chem. Soc. Rev. 43 (2014) 7132-7170. |
| [44] | E.I. Galanzha, V.P. Zharov, Photoacoustic flow cytometry, Methods 57 (2012) 280-296. |
| [45] | R.K. Saha, M.C. Kolios, A simulation study on photoacoustic signals from red blood cells, J. Acoust. Soc. Am. 129 (2011) 2935-2943. |
| [46] | E.M. Strohm, E.S.L. Berndl, M.C. Kolios, Probing red blood cell morphology using high-frequency photoacoustics, Biophys. J. 105 (2013) 59-67. |
| [47] | R.E. Kumon, C.X. Deng, X.D. Wang, Frequency-domain analysis of photoacoustic imaging data from prostate adenocarcinoma tumors in a murine model, Ultrasound Med. Biol. 37 (2011) 834-839. |
| [48] | G. Xu, I.A. Dar, C. Tao, et al., Photoacoustic spectrum analysis for microstructure characterization in biological tissue: a feasibility study, Appl. Phys. Lett. 101 (2012) 221102. |
| [49] | Y.Q. Yang, S.H. Wang, C. Tao, X.D. Wang, X.J. Liu, Photoacoustic tomography of tissue subwavelength microstructure with a narrowband and low frequency system, Appl. Phys. Lett. 101 (2012) 034105. |
| [50] | S.H. Wang, C. Tao, X.D. Wang, X.J. Liu, Quantitative detection of stochastic microstructure in turbid media by photoacoustic spectral matching, Appl. Phys. Lett. 102 (2013) 114102. |