


bDepartment of Chemical Engineering, National Tsing Hua University, Hsinchu 31003
Near infrared (NIR) spectroscopy is a widely used analytical method with the advantages of rapidness,non-destructiveness, non-pretreatment,and cost-effectiveness [1, 2, 3, 4, 5, 6, 7, 8, 9]. In routine NIR analyses,the spectra should be pretreated to enhance informative signals of the interested components and reduce uninformative signals as much as possible in advance of modeling. Savitzky- Golay differentiation [10, 11, 12] is a commonly used spectral pretreatment method that can eliminate baseline interference and improve spectral resolution. The ordinary differentiation method used in NIR is integral order Savitzky-Golay differentiation (IOSGD),and in practice 1st and 2nd derivatives often exhibit significant improvement over the calibration models. Recently, due to the development of fractional calculus,fractional order differentiation is becoming more and more prominent in many fields of applied sciences especially in signal pretreatments [13- 18]. Compared with IOSGD,fractional order Savitzky-Golay differentiation (FOSGD) can extract more details from signals. Furthermore,in contrast to other fractional order differentiation computation methods including Fourier transformation [19, 20] and wavelet transformation [21, 22],the FOSGD can apply a window to extract the local details of signals. Meanwhile,FOSGD is easy to apply,since it only constructs a band matrix for differentiation [23, 24]. In this paper,we tried to apply FOSGD to process NIR spectra in order to improve the multivariate calibration model of NIR spectral analysis. 2. Methods 2.1. Definition of fraction order differentiation
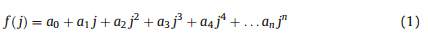
A polynomial function f(j),which is applied to fit in FOSGD,is a linear combination of power functions that could be expressed as:
In this paper,Riemann-Liouville differentiation definition is utilized to generate the fractional order differentiator. The definition of Riemann-Liouville differentiation is shown as follows:
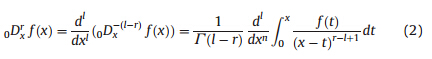
Here,r is differentiation order,l is a natural number with
l-1
Here,Γ(.) is Gamma function,which is the generation of
factorial function. When fixing n and r,(Γ(n+1))/(Γ(n+1-r))
could be obtained. Thus the fractional order differentiation
is another power function multiplying a constant
(Γ(n+1))/(Γ(n+1-r)). Specially,in the case of n=0,the
polynomial function f(x)=x0
= 1,then:
Thus,unlike integral order differentiation,the fractional order
differentiation of a constant is not zero.
2.2. Savitzky-Golay fractional order differentiation
Same as IOSGD,FOSGD also needs to obtain the coefficients
of polynomial function by fitting the spectral intensities with a
polynomial function.
2.2.1. Polynomial function
With a polynomial function defined in Eq. (1),a window of data
withm(m>n) points can be applied to fit,andmequations could
be obtained that can be rewritten as
After obtaining the coefficients of polynomial function,the
FOSGD can be computed with Eq. (3). For thejth point in the
window,the value of f(j) can be calculated with the estimated
coefficients
Then by combining Eqs. (3) and (7),the differentiation ofrth
order could be obtained:
As only the middle point in the window is concerned,with the
middle pointjand the related djT
Savitzky-Golay differentiation of
rth order could be conveniently calculated with the Eq. (9).
In fact,the Eq. (9) is a generalized formula to calculate Savitzky-
Golay derivatives including integral ones. Additionally,the
conventional Savitzky-Golay smoothing is also a special case of
the differentiation calculation of Eq. (9) at the order of zero. The
detailed examples of using Eq. (9) for smoothing and integral order
differentiation are shown in supplementary materials.
3. Datasets
3.1. Diesel dataset
The diesel dataset downloaded from the Internet at http://
www.eigenvector.com/data/SWRI/index.html contained 401 NIR
spectral points with a range from 750 nm to 1550 nm. Two
properties of diesel including density with 395 samples and cetane
number (CN) with 381 samples,respectively,were set as vectors of
y. For each property,the samples were sorted by y values,then the
third one in each contiguous five samples were set aside as the
prediction set while the remaining samples as the calibration set.
Thus for the properties of density and cetane number,the size
ratios of the calibration set to the prediction set were 316-79 and
305-76,respectively.
3.2. Wheat dataset
The wheat dataset with 150 data points (1004-2494 nm) was
downloaded from the Internet at http://www.wiley.com/legacy/
wileychi/chemometrics/datasets.html. The values of the protein
concentration with 183 samples and the hardness with 180 samples,respectively,were chosen and set as vectors of y. Similar to
the diesel dataset,for each property,one fifth samples were
selected as the prediction set whereas the remaining samples as
the calibration set. Thus,the calibration sets and prediction sets
were separated in proportions of 147-36 and 144-36,respectively.
3.3. Corn dataset
The corn dataset (m5) at the range of 1100-2498 nm
(700 points) was downloaded from the Internet at http://
www.eigenvector.com/data/Corn/index.html. The oil and starch
concentrations both containing 80 samples were set as vectors of
y. Hence,for the two properties,the sizes of the calibration set and
the prediction set were both in a ratio of 64:16 that was
constructed with the method described in Section 3.1.
4. Results and discussion
4.1. Results of the diesel dataset
4.1.1. Modeling to the property of density
In order to investigate the utility of FOSGD,PLS models
established using differentrvalues (with an interval of 0.01) were
evaluated in point of root mean square error of cross validation
(RMSECV),where a 5-fold cross validation was used and the
number of latent variable s(LVs) was set as 7 because the RMSECV
values at LVs number of 7 were the smallest in most cases.
Meanwhile,the effects ofp and mon RMSECV were also
investigated. In the study it is found that the case of n= 2 and
m= 9 often yields smaller RMSECV values,thus,for simplicity,n
andmwere set as 2 and 9,respectively. After optimizingnandm,
the value ofr,which is a key factor,should also be optimized and
the corresponding RMSECV values are shown in Fig. 1.
From Fig. 1,one can see that at the point ofr= 1.8,the RMSECV
reaches the lowest value,therefore it can be concluded that FOSGD
produces better results with smaller RMSECV than IOSGD. The
reason may be that the density of diesel is related to many
components rather than only one or a few components. Absorption
bands of a number of components must be severely overlapped,
thus the relationship between density and spectra must be very
complex. For IOSGD,smallr valuescannot identify the informative
signals related to the density from the uninformative signals,
whereas,the overlarge values ofrcan impair both informative and
uninformative spectra. However,FOSGD can use a decimal number
between two adjacent integral numbers as the order,which may
provide a better chance to identify (or resolve) informative and
uninformative signals due to density than IOSGD. Moreover,
fractional order calculus is always utilized to build models for the
density of liquid and semisolid [25, 26].
In order to further compare model performance between
FOSGD and IOSGD,an independent prediction set was used to
calculate the root mean error of the prediction (RMSEP) that was
listed in Table 1.]
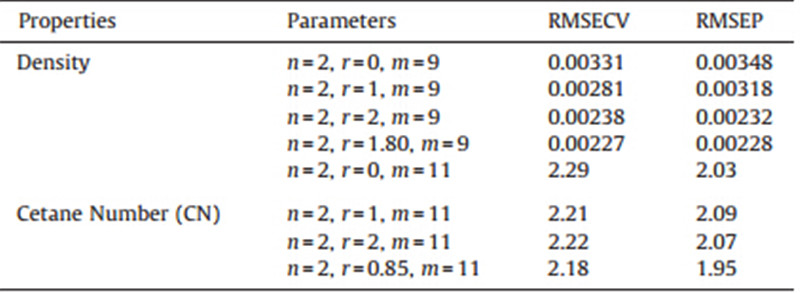
Table 1 shows that the values of RMSECV and RMSEP at
fractional order are both smaller than those at integral orders. The
RMSEP being 0.00228 at r= 1.8 is the lowest. The results further
confirm that for the density of diesel,FOSGD can achieve small
prediction errors compare to IOSGD.
4.1.2. Modeling to the property of cetane number
Similar to density,for the cetane number of diesel,the number
of latent variable was selected as nine,and values ofnandmwere
set as 2 and 11. A series of calculations with varying values ofr
from 0 to 2 revealed that the PLS model shows the best results at
r= 0.85. The results are given in Table 1. From Table 1 it is clear
that for the cetane property,fractional order differentiation still
produces smaller calibration and prediction errors than integral
order differentiation.
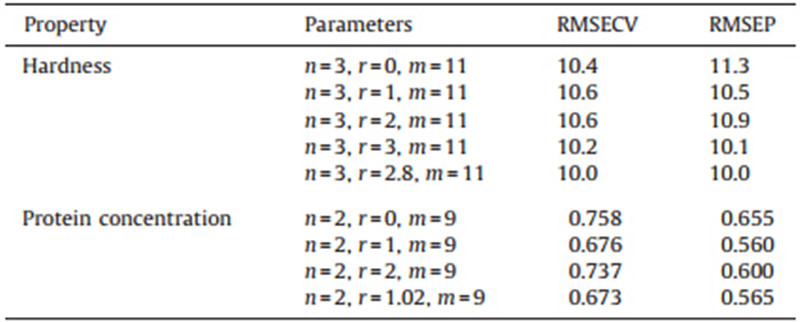
4.2. Results of the wheat dataset
With the same method to that used for the diesel dataset,the
parameters ofn,mandrwere optimized to be 3,11 and 2.8 for
the property of hardness,respectively,and to be 2,9 and 1.02,
respectively for protein concentration. The modeling results
obtained with the optimized parameters are shown in Table 2.
Table 2 shows that,for hardness as the property,the values of
RMSECV and RMSEPusing fractional order of 2.8 are the smallest,
but they are quite close to those using an integral number of three.
Whereas,for protein concentration as the property,the optimal
fractional order with the lowest RMSECV appears at r= 1.02,but
it is close to integer of one very much,and the RMSECV values
corresponding tor= 1.02 andr= 1 are quite close. Meanwhile,
RMSEP atr= 1 shows the smaller value comparing with any other
fractional orders. Therefore,for the property of protein concentration we think that IOSGD produces the better results than FOSGD.
4.3. Results of the corn dataset
In the corn dataset,the concentrations of oil and starch were
considered using FOSGD as the spectral pretreatment method.
Similarly,parameters ofnandmof oil were firstly optimized as
2 and 13,respectively,for the oil concentration while as 2 and 7,
respectively,for the starch concentration. The optimized parameters and the modeling results are shown in Table 3.
The results listed in Table 3 are similar to those of protein
concentration of the wheat dataset. For both properties of oil and
starch concentrations in the corn dataset,the optimal orders
are integer numbers of 2 and 1,respectively,althoughr values
corresponding to the lowest RMSECV and RMSEP are 1.98 and 1.01,
which are quite close to the integer numbers.
In summary,FOSGD provides more choices to pretreat NIR
spectra with differentiation than the ordinary derivatives,and
sometimes FOSGD clearly shows better performance of calibration
model than that of IOSGD. Comparing models of the three datasets,
it is very interesting that if the property of interest is a physical
property,such as density,hardness,cetane number,fractional order
Savitzki-Golay derivatives should be used,while if the property is
mainly related to chemical compositions,such as content or
concentration of chemical components,integral order Savitzki-
Golay derivatives are often better. The reason for these observations
is unclear. We hypothesize that when modeling to chemical
components,the related signals (informative signals) in the NIR
spectra to the chemical components is relatively simple and could
be identified with IOSGD,while to the physical properties,the
informative signals are severely overlapped with the uninformative
ones and could not be identified easily,and FOSGD may offer a better
chance to resolve them with a fractional number as the order
between two adjacent integral numbers (see Section 4.1.1).
5. Conclusion
Fractional order Savitzky-Golay differentiation (FOSGD) is the
generalization of integral order Savitzky-Golay differentiation
(IOSGD) while IOSGD is a special case of FOSGD. The FOSGD can
also be used to pretreat NIR spectra. Fractional order differentiation computation of the NIR spectra often improves the performance of the PLS model with smaller RMSECV and RMSEP numbers
than integral order ones,especially for physical properties,such as
density,cetane number and hardness. Furthermore,FOSGD can be
easily computed with the definition of Riemann-Liouville differentiation and applied as conveniently as IOSGD. Thus,FOSGD has
strong application potentials in spectral analyses.
This work was supported by Science and Technology Commission of Shanghai Municipality (No. 14142201400).
Appendix A. Supplementary data
Supplementary data associated with this article can be
found,in the online version,at http://dx.doi.org/10.1016/j.cclet.
2014.10.023.
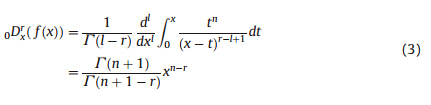

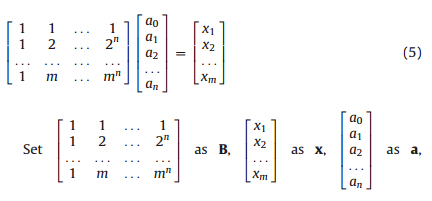
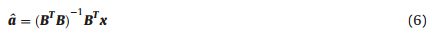

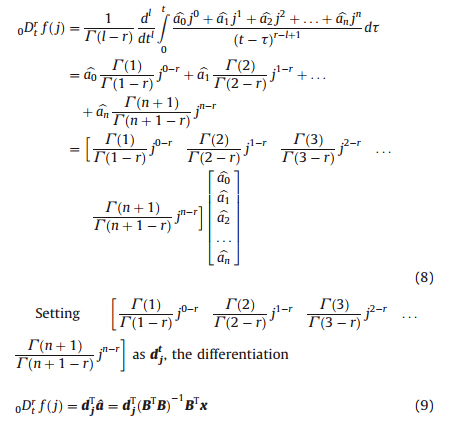

Fig. 1. Plots of RMSECVvs.r using fractional order Savitzky-Golay differentiation
(FOSGD) (n=2 and m= 9).
![]()
Table 1
Performance comparison between FOSGD and IOSGD for the diesel dataset
![]()
Table 2
Performance comparison between FOSGD and IOSGD for the wheat dataset
![]()
Table 3
Performance comparison between FOSGD and IOSGD for the corn dataset

| [1] | W.Q. Luo, S.Y. Huan, H.Y. Fu, et al., Preliminary study on the application of near infrared spectroscopy and pattern recognition methods to classify different types of apple samples, Food Chem. 128 (2011) 555-561. |
| [2] | H.Y. Mou, X.J. Wang, T. Lü, L. Xie, H.P. Xie, On-line dissolution determination of Baicalin in solid dispersion based on near infrared spectroscopy and circulation dissolution system, Chemom. Intell. Lab. Syst. 105 (2011) 38-42. |
| [3] | Z.Z. Wu, H. Lu, B. Zhang, et al., Studies on short tandem repeat genotyping and its expert system based on ultraviolet spectroscopy-principal discriminant variate, Chemom. Intell. Lab. Syst. 105 (2011) 181-187. |
| [4] | J.J. Liu, H. Xu, W.S. Cai, X.G. Shao, Discrimination of industrial products by on-line near infrared spectroscopy with an improved dendrogram, Chin. Chem. Lett. 22 (2011) 1241-1244. |
| [5] | Y.P. Du, X.M. Wei, H.P. Xie, Z.X. Huang, J.J. Fang, An enrichment device of silicabased monolithic material and its application to determine micro-carbaryl by NIRS, Chin. Chem. Lett. 20 (2009) 469-472. |
| [6] | Y.M. Xiong, X.Z. Song, C.Z. Chen, et al., The establishment and evaluation of near infrared universal model to determinate the effective ingredient content in pesticide rapidly, Chin. Chem. Lett. 23 (2012) 1047-1050. |
| [7] | H.H. Yang, F. Qin, Q.L. Liang, et al., LapRLSR for NIR spectral modeling and its application to online monitoring of the column separation of Salvianolate, Chin. Chem. Lett. 18 (2007) 852-856. |
| [8] | C.J. Cui, W.S. Cai, X.G. Shao, Near-infrared diffuse reflectance spectroscopy with sample spots and chemometrics for fast determination of bovine serum albumin in micro-volume samples, Chin. Chem. Lett. 24 (2013) 67-69. |
| [9] | Y.N. Ni, W. Lin, Near-infrared spectra combined with partial least squares for pH determination of toothpaste of different brands, Chin. Chem. Lett. 22 (2011) 1473-1476. |
| [10] | A. Savitzky, M.J.E. Golay, Smoothing and differentiation of data by simplified least squares procedures, Anal. Chem. 36 (1964) 1627-1639. |
| [11] | J.E.J. Staggs, Savitzky-Golay smoothing and numerical differentiation of cone calorimeter mass data, Fire Safety J. 40 (2005) 493-505. |
| [12] | H.H. Madden, Comments on the Savitzky-Golay convolution method for leastsquares-fit smoothing and differentiation of digital data, Anal. Chem. 50 (1978) 1383-1386. |
| [13] | T.K. Kalkandjiev, V.P. Petrov, J.B. Nickolov, Deconvolution versus derivative spectroscopy, Appl. Spectrosc. 43 (1989) 44-48. |
| [14] | Y. Mitsuka, J. Uozumi, T. Asakura, Error reduction in spectrum estimation by means of concentration-spectrum correlation, Appl. Spectrosc. 44 (1990) 695-700. |
| [15] | J.M. Schmitt, Fractional derivative analysis of diffuse reflectance spectra, Appl. Spectrosc. 52 (1998) 840-846. |
| [16] | S.S. Kharintsev, D.I. Kamalova, M.K. Salakhov, Resolution enhancement of composite spectra with fractal noise in derivative spectrometry, Appl. Spectrosc. 54 (2000) 721-730. |
| [17] | D.K. Buslov, Modification of derivatives for resolution enhancement of bands in overlapped spectra, Appl. Spectrosc. 58 (2004) 1302-1307. |
| [18] | G.H. Gao, Z.Z. Sun, H.W. Zhang, A new fractional numerical differentiation formula to approximate the Caputo fractional derivative and its applications, J. Comput. Phys. 259 (2014) 33-50. |
| [19] | C.C. Tseng, S.C. Pei, S.C. Hsia, Computation of fractional derivatives using Fourier transform and digital FIR differentiator, Signal Process. 80 (2000) 151-159. |
| [20] | Y. Chen, B.M. Vinagre, I. Podlubny, Continued fraction expansion approaches to discretizing fractional order derivatives-an expository review, Nonlinear Dyn. 38 (2004) 155-170. |
| [21] | Z. Gao, X.Z. Liao, Discretization algorithm for fractional order integral by Haar wavelet approximation, Appl. Math. Comput. 218 (2011) 1917-1926. |
| [22] | Y.L. Li, H.Q. Tang, H.X. Chen, Fractional-order derivative spectroscopy for resolving simulated overlapped Lorenztian peaks, Chemom. Intell. Lab. Syst. 107 (2011) 83-89. |
| [23] | D.L. Chen, Y.Q. Chen, D.Y. Xue, Digital fractional order Savitzky-Golay differentiator, IEEE Trans. Circuits Syst. II: Express Briefs 58 (2011) 758-762. |
| [24] | H.A. Jalab, R.W. Ibrahim, Texture enhancement based on the Savitzky-Golay fractional differential operator, Math. Probl. Eng. 2013 (2013) 1-8. |
| [25] | D. Bose, U. Basu, Unsteady incompressible flow of a generalised oldroyed-B fluid between two infinite parallel plates, World J. Mech. 3 (2013) 146-151. |
| [26] | N. Makris, G. Dargush, M. Constantinou, Dynamic analysis of viscoelastic-fluid dampers, J. Eng. Mech. 121 (1995) 1114-1121." |