


Flavin mononucleotide (FMN) is a very important biological molecule. On one hand,FMN can function as a photoreceptor to participate the light-induced signal conduction or electron transfer [1,2]. On the other hand,FMN exhibits three different redox states, i.e.,oxidized,one-electron reduced and two-electron reduced states,therefore FMN can be involved in redox reactions as either a one- or two-electron mediator [3,4].
In this paper we focus on one FMN-containing,NADH/NADPHdependent azoreductase fromE. coli(denoted as AzoR),where FMN acts as an electron mediator to catalyze the degradation of azo dyes containing N=N double bonds [5]. During the past several decades, in this research field people have paid much attention to the identification of new azoreductases [6,7,8,9],the resolution of new structures,the exploration of the catalytic mechanism [10,11],as well as protein engineering [12]. However,little useful information has been available regarding the effect of the dilution on the stability of azoreductases. Considering the fact that AzoR exists as a dimer,and that FMN molecule is noncovalently bound to the dimeric interface [10,11],here we attempted to gain some understanding on the effect of the dilution by detecting the spectral behavior changes of the bound FMN in AzoR. This is true for another FMN-containing protein (flavodoxin),in which the dilution-induced dissociation was reflected by the fluorescence intensity changes of the bound FMN in flavodoxin [13].
In this study,we chose the wild type AzoR (wt AzoR) and its R59G mutant. In our previous work,we found that R59G mutant exhibited higher enzymatic activity against methyl orange than AzoR did. In this work,the specific enzymatic activity assay revealed that both AzoR and R59G experienced no dissociation even when the concentration was below 1umol/L. Static fluorescence spectral results showed that unlike the case of free FMN,there was a nonlinear relationship between the maximum fluorescence intensity of the bound FMN and the concentration of both wt AzoR and R59G. We carried out a 2D fluorescence correlation analysis on concentration-dependent and excitation wavelength-dependent fluorescence emission spectra. The results showed that there coexisted a heterogeneous distribution of FMN in solution. Furthermore,it was also found that the mutation at site 59 affected the formation of the intermediates upon dilution. 2. Experimental
In this work we expressed the wt AzoR and R59G with pET-28(a) and BL21(DE3) PlysS as the expression plasmid and host cells,respectively. The expressed proteins were further purified using Ni2+-NTA affinity and Sephedex G25 desalting columns. Absorption and fluorescence spectra were recorded using a Hitachi U-2910 absorption photometer and Hitachi F4600 fluorescence photometer,respectively. For the fluorescence measurement,the excitation and emission slit widths were 10 nm for all the spectra,and the scan speed was 1200 nm/min. The 2D software was kindly provided by Professor Yi-Zhuang Xu from Peking University. 3. Results and discussion 3.1. Expression,purification and FMN measurement of AzoR and R59G mutant
Both the wt AzoR and R59G mutant could be expressed in anE. colisystem,and then purified using a Ni2+-NTA affinity column (data not shown). Next,we measured the absorption and fluorescence spectra of the purified proteins to confirm whether the purified proteins belonged to flavin proteins. Fig. 1A and B showed the UV-vis absorption spectra of the wt AzoR and R59G mutant dissolved in Tris-HCl buffer (pH 7.4). We observed two absorption peaks locating at 370 nm and 452 nm (solid lines), corresponding to the S0→S2 and S0→S1 transitions of the FMN molecule,respectively. The treatment of 1% (final concentration) SDS gave rise to the spectral blue-shift of S0→S1 band from 452 nm to 445 nm (dashed lines),mainly because the noncovalent bonds between FMN and the apoprotein was weakened or broken. As a result,FMN was released from the hydrophobic pocket to the aqueous solution. Additionally,we observed one shoulder peak at ~470 nm. The aforementioned spectral shift and the appearance of the shoulder peak are the characteristic signatures of flavin protein.

| Download: |
| Fig. 1. Absorption spectra of wt AzoR (A) and R59G mutant (B) with the absence (solid line) and the presence of 1% SDS (dashed line). (C) The fluorescence emission spectra of wt AzoR (dashed line),R59G (dotted line) and free FMN (solid line) dissolved in Tris-HCl (pH7.4) upon excitation at 450 nm at room temperature. | |
Apart from the absorption spectra,the fluorescence emission spectra gave additional evidence to support that FMN has been bound to the apoprotein. As shown in Fig. 1C,although both the bound FMN and free FMN shared the almost same maximum fluorescence emission peak at ~530 nm upon excitation at 450 nm, the relative fluorescence quantum yield dramatically decreased from free FMN (~21-fold) to the bound FMN in wt AzoR (~3.4 fold) and R59G (~1 fold). This phenomenon is common for FMNcontaining proteins [14,15]. It can be explained by the fact that when FMN is bound to the protein,its fluorescence might be quenchedviaelectron transfer from the adjacent Trp or Tyr to the excited-state FMN molecules. 3.2. Fluorescence emission spectral changes upon dilution
As shown in Fig. 2A and B,as the wt AzoR and R59G mutant was diluted by Tris-HCl buffer (pH 7.4),the fluorescence intensity of the FMN peak at 530 nm (denoted as F530) continuously decreased. Similar phenomenon was observed for free FMN (Fig. 2C). However, unlike the case of free FMN,where there was a linear relationship between F530 nm and the concentration of FMN (seen in Fig. 2F), F530 nm decreased nonlinearly with the decreased concentration of both AzoR and R59G mutant (Fig. 2D and E). Obviously,some changes happened for the bound FMN in the wt AzoR and R59G. Firstly,we suspected that the dilution might induce the dissociation of both AzoR and R59G. In order to test this hypothesis,we deduced the equation according to a Dimer→Monomer + FMN model. The procedure was shown as following:
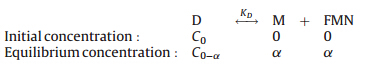
In this system,only D and FMN can emit fluorescence,so the total fluorescence intensity should be composed of the following two parts
where wD and wFMN represent the fluorescence intensity of the dimer and free FMN per 1 mol/L,respectively.KD denoted the dissociation constant.

| Download: |
| Fig. 2. Dilution-induced fluorescence emission spectral changes (A-C) and the changes of fluorescence intensity at 530 nm with the concentration (D-F) of wt AzoR (A and D), R59G mutant (B and E) and free FMN (C and F) in 20 umol/L Tris-HCl (pH 7.4) at room temperature upon excitation at 450 nm. | |
When we fitted the curves in Figs. 2D and 2E according to Eq. (1),the fitting results were not satisfactory. It indicated that the changes were not caused by what we expected. Additionally,we detected the specific activity of both AzoR and R59G,and found that their specific activity did not decrease significantly during the dilution (shown in Fig. 3A). These results showed that no dissociation reaction happened.

| Download: |
| Fig. 3. Specific enzymatic activity (A) of wt AzoR (solid line) and R59G mutant (dashed line) within the concentration below 1umol/L,as well as the intrinsic fluorescence emission spectra of wt AzoR (B) and R59G (C) upon excitation at 295 nm. | |
In addition,we found that there was a Trp residue in both AzoR and R59G mutant. It is well known that the maximum fluorescence peak (λmax) of Trp residue is strongly dependent on its surrounding microenvironment,therefore we also measured the fluorescence emission spectra from Trp to explore if the protein microenvironment experienced some changes. As demonstrated in Fig. 3B and C, the Trp residue in AzoR and R59G emitted fluorescence at 330 nm upon excitation at 295 nm. No remarkablelmaxchanges were observed upon diluting both AzoR and R59G. This phenomenon suggested that no remarkable structural movements on dilution occurred.
As described above,the dilution of neither AzoR nor R59G led to dissociation reactions. In order to gain deeper understanding on the effect of dilution,we carried out a 2D fluorescence correlation analysis using the fluorescence emission spectra of FMN shown in Fig. 2A-C. We observed that both free FMN and the bound FMN in wt AzoR or R59G shared a similar 2D synchronous correlation map, in which one strong,broad,structureless auto peak appeared at (530,530). When we compared the 2D asynchronous maps,we found that there was one weak cross peak at (600 nm,530 nm) in the R59G mutant,while we could distinguish one weak auto at (530 nm,490 nm) and another rather weak peak (580 nm,530 nm) in the wt AzoR. In contrast,free FMN contained no distinct cross peaks (Fig. 4F). The appearance of these cross peaks was indicative of a heterogeneous distribution of FMN. For example,we detected one FMN molecule emitting fluorescence at 530 nm in the R59G mutant. Meanwhile,there coexisted another FMN form that emitted fluorescence at longer wavelengths (~600 nm). In wt AzoR at least three different forms of FMN were detected,and they emitted fluorescence at 490 nm,530 nm and 580 nm,respectively.

| Download: |
| Fig. 4. Dilution-induced two-dimensional synchronic and asynchronic fluorescence emission spectral changes of wt AzoR (A and D),R59G mutant (B and E) and free FMN (C and F) in 20 umol/L Tris-HCl (pH 7.4) at room temperature upon excitation at 450 nm. | |
Apart from resolving the overlapped components,it is well known that 2D correlation methods can help to determine the sequence of the events [16]. From Fig. 4A and 4C,one can observe that φ(530,490)>0,ψ(530,490)<0,where the symbolfandc represent the intensity of synchronous and asynchronous peaks, respectively. Therefore it can be concluded that the FMN emission at 490 nm changed faster than the FMN emission at 530 nm upon dilution. In the same way,we detected that the FMN emission at 580 nm responded more quickly than the FMN emission at 530 nm in AzoR. In the R59G mutant,the FMN emission at 600 nm is more sensitive to dilution than the FMN emission at 530 nm.
To determine whether these intermediates occurred without dilution or they were formed upon dilution,we fixed the concentration of AzoR and R59G,and then measured the fluorescence emission spectra upon excitation at different excitation wavelength varying from 420 nm to 455 nm (data not shown). A 2D correlation analysis was performed using these spectra. From Fig. 5D and E,we observed that both wt AzoR and R59G contained one cross peak at (530,500), while no cross peaks were distinguished in free FMN (Fig. 5F). This result suggested that in wt AzoR and R59G there were at least two different types of FMN that emitted fluorescence at 500 nm and 530 nm,respectively. This phenomenon seemed contradictory to the X-ray crystallographic results,because X-ray structural data revealed that there existed two FMN cofactors that shared the completely identical microenvironment in the dimeric AzoR. It seemed that the solution environment gave rise to the heterogeneous distribution of FMN at high concentrations. Meanwhile,as discussed above,some intermediates were formed upon dilution,for example the intermediates emitting at 600 nm in the R59G mutant. In the future work, we will be interested in exploring how these FMN-containing intermediates were formed upon dilution.

| Download: |
| Fig. 5. Excitation wavelength-dependent two-dimensional synchronous and asynchronous fluorescence emission spectra wt AzoR (A and D),R59G mutant (B and E) and free FMN (C and F) in 20 umol/L Tris-HCl (pH 7.4) at room temperature upon excitation varying from 420 nm,425 nm,430 nm,435 nm,440 nm,445 nm,450 nm,455 nm, respectively. | |
In this study,2D fluorescence correlation methods had been used to analyze the dilution-induced spectral behaviors of the bound FMN in AzoR and R59G. It was found that there coexisted at least three FMN-containing components in the wt AzoR,i.e. FMN emitting at 490 nm,530 nm and 600 nm,respectively. In contrast, R59G contained only two types of FMN,emitting at 530 nm and 600 nm. We also conducted a 2D analysis on the excitation wavelength-dependent fluorescence emission spectra,and observed a heterogeneous distribution of FMN in solution. Further work needs to be done to investigate the heterogeneous distribution of FMN in solution.
Acknowledgment
This work was fund by sub-project of National Science and Technology Major Project on Water Pollution Prevention and Control (No. 2012ZX07203-003-Z04) and supported by the Fundamental Research Funds for the Central Universities (No. ZYGX2012J112).
| [1] | A. Losi, W. Gartner, The evolution of flavin-binding photoreceptors: an ancient chromophore serving trendy blue-light sensors, Annu. Rev. Plant Biol. 63 (2012) 49-72. |
| [2] | D. Immeln, A. Weigel, T. Kottke, J.L. Pé rez Lustres, Primary events in the blue light sensor plant cryptochrome: intraprotein electron and proton transfer revealed by femtosecond spectroscopy, J. Am. Chem. Soc. 134 (2012) 12536-12546. |
| [3] | M. Sugishima, H. Sato, Y. Higashimoto, et al., Structural basis for the electron transfer from an open form of NADPH-cytochrome P450 oxidoreductase to heme oxygenase, Proc. Natl. Acad. Sci. U.S.A. 111 (2014) 2524-2529. |
| [4] | F. Muller, The flavin redox-system and its biological function, Top. Curr. Chem. 108 (1983) 71-107. |
| [5] | M. Nakanishi, C. Yatome, N. Ishida, Y. Kitade, Putative ACP phosphodiesterase gene (acpD) encodes an azoreductase, J. Biol. Chem. 276 (2001) 46394-46399. |
| [6] | C.J. Wang, N. Laurieri, A. Abuhammad, et al., Role of tyrosine 131 in the active site of paAzoR1, an azoreductase with specificity for the inflammatory bowel disease prodrug balsalazide, Acta Crystallogr. 66 (2010) 2-7. |
| [7] | Y.Y. Yang, L.L. Lu, F. Gao, Y.H. Zhao, Characterization of an efficient catalytic and organic solvent-tolerant azoreductase toward methyl red from Shewanella oneidensis MR-1, Environ. Sci. Pollut. Res. 20 (2013) 3232-3239. |
| [8] | M.K. Johansson, A.C. Wong, E.S. Armstrong, et al., BTI1, an azoreductase with pHdependent substrate specificity, Appl. Environ. Microbiol. 77 (2011) 4223-4225. |
| [9] | O. Toshihiko, S. Takeshi, S. Reiko, et al., An azoreductase, aerobic NADH-dependent flavoprotein discovered from Bacillus sp.: functional expression and enzymatic characterization, Appl. Microbiol. Biotechnol. 75 (2007) 377-386. |
| [10] | K. Ito, M. Nakanishi, W.C. Lee, et al., Three-dimensional structure of AzoR from Escherichia coli. An oxireductase conserved in microorganisms, J. Biol. Chem. 281 (2006) 20567-20576. |
| [11] | K. Ito, M. Nakanishi, W.C. Lee, et al., Expansion of substrate specificity and catalytic mechanism of azoreductase by X-ray crystallography and site-directed mutagenesis, J. Biol. Chem. 283 (2008) 13889-13896. |
| [12] | V. Brissos, N. Gonçalves, E.P. Melo, L.O. Martins, Improving kinetic or thermodynamic stability of anazoreductase by directed evolution, PLoSONE 9 (2014) e87209. |
| [13] | Y.J.M. Bollen, A.H. Westphal, S. Lindhoud, W.J.H. van Berke, C.P.M. van Mierlo, Distant residues mediate picomolar binding affinity of a protein cofactor, Nat. Commun. 3 (2010) 1010. |
| [14] | F. Tanaka, H. Chosrowjan, S. Taniguchi, et al., Donor-acceptor distance-dependence of photoinduced electron-transfer rate in flavoproteins, J. Phys. Chem. B 111 (2007) 5694-5699. |
| [15] | H. Staudt, D. Oesterhelt, M. Gringinger, J. Wachtveitl, Ultrafast excited-state deactivation of flavins bound to dodecin, J. Biol. Chem. 287 (2012) 17637-17644. |
| [16] | Y. He, G.F. Wang, J. Cox, L. Geng, Two-dimensional fluorescence correlation spectroscopy with modulated excitation, Anal. Chem. 73 (2001) 2302-2309. |