


Naturally occurring arsenic (As) in groundwater has drawn great attention due to its hypertoxicity and extensive distribution [1, 2]. The World Health Organization (WHO) and the U.S. Environmental Protection Agency (EPA) have successively proposed a more restricted guideline for As in drinking water from 50 µg/L to 10 µg/L [3]. Thus,new technologies and materials for efficient removal of As from water are urgently demanded.
Since lanthanum (La)-impregnated silica gel was first designed as an adsorbent for water treatment in 1996 [4],extensive La loading materials have been widely studied for hazardous anion removal,especially for fluoride [5],phosphate [6],and arsenate (As(V)) [7],due to their selectivity and high removal efficiency without producing harmful by-products. While many La-based materials were synthesized for adsorption,however,research efforts have primarily focused on the promotion of anion removal efficiency,while studies on the adsorption mechanisms at the liquid/solid interface are still scarce,which has seriously limited the development of the adsorbents.
Due to the high sensitivity needed to reflect the molecular structure changes at interfaces without interferences by the signals from the liquid phase,in situ ATR-FTIR spectroscopy has been widely used to probe the liquid/solid interfaces at the molecular level [8, 9]. Besides,two-dimensional correlation spectroscopy (2D-COS) has been successfully applied to investigate the dynamics of adsorption,diffusion,and biological processes [10, 11]. One major advantage of 2D-COS is that it can probe the specific sequence of spectral intensity changes corresponding to external perturbations,such as the changes in pH,time,and concentration. Therefore,2D-COS is especially suitable for the data analysis following the in situ ATR-FTIR spectroscopy.
The objective of this work is to explore the adsorption process and mechanisms of As(V) on lanthanum impregnated,activated alumina (LAA) at the molecular level. The in situ ATR-FTIR technique and 2D-COS analysis are employed to gain important insights into the As(V) adsorption at different pH and then determine the surface As species and structures. The results would further improve our understanding of the interactions between As(V) and metal oxides. 2. Experimental 2.1. Materials synthesis
LAA was synthesized as reported in our previous study [5]. Briefly,14.5 g activated alumina (AA,Keyuan,China) was impregnated with 10 mL 0.9 mol/L La(NO3)3·6H2O solution. Then the synthesized material was calcinated at 300 °C for 4 h. After the material was cooled to room temperature,it was washed with deionized (DI) water and air-dried. The obtained LAA was powdered and characterized for surface morphology and element distribution using a high resolution transmission electron microscopy (HRTEM) and an Oxford energy dispersive X-ray spectroscopy (EDS) analyzer (Tecnai G2 F20,FEI,U.S.). X-ray powder diffraction (XRD,X’Pert PRO MPD,PANalytical,The Netherlands) data were recorded on a Rigaku D/Max-2500 diffractometer using a Cu-target tube (λ = 1.5418). Scans were made in the 2u range of 5-908 with a step size of 0.018 and a count time of 2 s per step. Analysis of the XRD patterns was performed using the PDF-2 reference database from the International Center for Diffraction Data (ICDD) database. 2.2. In situ ATR-FTIR experiments
ATR-FTIR measurements were performed using a Thermo- Nicolet Nexus 6700 FTIR spectrometer equipped with a horizontal attenuated total reflectance (HATR) cell (PIKE Tech) and a liquidnitrogen- cooled mercury-cadmium-telluride (MCT) detector. A multibounce ZnSe ATR crystal with 458 beveled faces (infrared angle of incidence,θ) was used and the infrared spectra were collected using 256 scans per spectrum at a resolution of 4 cm-1.
A 20 mg/L As(V) solution was prepared in 0.01 mol/L NaCl background electrolyte at the designed pH values. The FTIR measurements of As(V) sorption were similar to those described in our previous publications [12, 13]. Briefly,the film was deposited on the ZnSe crystal by applying 500 μL of the well-diffusion (using ultrasonic method) LAA suspension (5 g/L) and dried in the room temperature. Prior to use,the film was rinsed with DI water to remove loosely deposited particles. The 0.01 mol/L NaCl solution at a predetermined pH was passed through the flow cell at a rate of 0.4 mL/min until there was no further change in the spectra. A background spectrum comprised of the absorbance of the ZnSe crystal and deposited adsorbents was collected. Spectra were recorded as a function of time until the sorption reached equilibrium (at least 4 h). All of the samples were purged with N2 in dark during the spectra collection. 2.3. 2D-COS
After essential smoothing and baseline corrections performed using the Omnic 8.2 software,FTIR spectra collected with an increment of 8 min during adsorption process were selected for 2D correlation analysis using the 2Dshige software (Shigeaki Morita, Kwansei-Gakuin University,2004-2005). The method was detailed in the previous report [12]. 3. Results and discussion
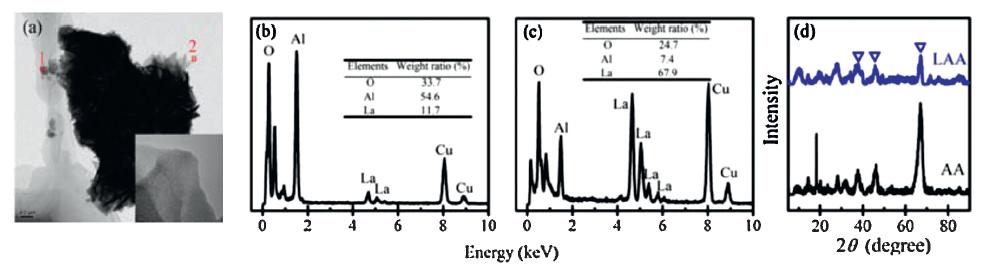
The surface morphology of synthesized LAA was characterized by HRTEM. As shown in Fig. 1a,nanosheets were found on the surface of particles,which was in agreement with our previous field emission scanning electron microscope (FE-SEM) results [9]. The element distribution of regions 1 and 2 (Fig. 1a) was further investigated by EDS. The main composition of region 1 was alumina and region 2 was lanthanum oxides (Fig. 1b and c, respectively). The appearance of a peak due to Cu in the EDS spectra was due to the drop of samples on Cu grid for HRTEM characterization. No obvious lattice was found in the highmagnification of region 2 (Fig. 1a inset),indicating the lanthanum oxides were in the amorphous phase. In addition,the XRD spectra of LAA showed no significant difference from those of AA. The only observation of x-Al2O3 phase in LAA indicated the formation of amorphous phase lanthanum oxides,which agreed well with our HRTEM results.

|
Download:
|
Fig. 1. High resolution transmission electron microscope image of LAA powder (a) with inset picture of high magnification of region 2; EDS of region 1a is shown in (b) and
region 2a is shown in (c); XRD patterns (d) of LAA (blue) and AA (black) ( : x-Al2O3,PDF No. 13-0373). : x-Al2O3,PDF No. 13-0373).
|
|
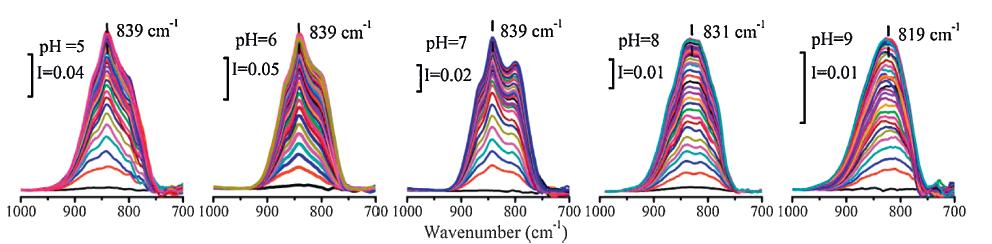
The ATR-FTIR spectra of adsorbed As(V) on LAA films at different pH values as a function of time are presented in Fig. 2. The striking spectral changes mainly occurred at 1000-700 cm-1 region,which was the focus in this study. With the increasing of time,the peak at ~830 cm-1,corresponding to the vibration of As- O bond adsorbed on LAA,was progressively increased. The peak position agreed well with our previous results [14] and the report of other researchers [15]. Meanwhile,the peak intensity,which correlated with the amount of As(V) adsorbed on LAA,changed over the pH values. Furthermore,the peak positions also shifted from 839 cm-1 to 819 cm-1 from pH 5 to 9. Because the spectroscopic method alone was not sensitive enough to reveal the dynamics of the sorption process,kinetics modeling and 2DCOS were employed for the further study.

|
Download:
|
| Fig. 2. In situ ATR-FTIR spectra of As(V) adsorbed on at LAA pH 5,6,7,8,and 9; arsenate concentration = 20 mg/L,ionic strength = 0.01 mol/L NaCl,room temperature. | |
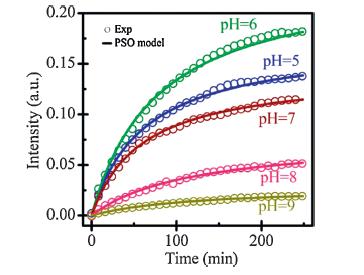
To further understand the processes of the As(V) adsorbed on LAA,the peaks centered at 839,831 and 819 cm-1 in spectra at pH 5-9 (the maximum peak in each spectrum) were selected as indexes of adsorbed As(V) on LAA,respectively. The increase in the peak intensity of those selected peak was further fitted using pseudo-second-order equation:

| Table 1 Parameters of pseudo-second-order model for arsenate adsorbed on LAA at different pH values. |


|
Download:
|
| Fig. 3. Kinetics of peak intensity as a function of time acquired at different pH values,As(V) concentration = 20 mg/L,ionic strength = 0.01 mol/L NaCl (839,839, 839,831,and 819 cm-1 at pH = 5,6,7,8,and 9,respectively). | |
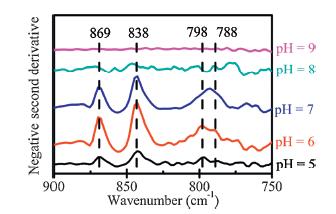
The second derivative spectra were always used to distinguish the overlapped IR sub peaks. In our study,as shown in Fig. 4,the IR spectra were further studied through their negative second derivative performances. The results showed peaks appeared at 869,838,798,and 788 cm-1,and peaks at lower peak positions (<780 cm-1) were also observed in the spectra. The appearance of more than four peaks in the IR spectra indicated that other than one species of As(V) adsorbed on the LAA surface. However,the ratio of signal/noise in this area was not adequate to acquire information of those As(V) species. This low resolution further motivated us to analyze the IR spectra using 2D-COS techniques.
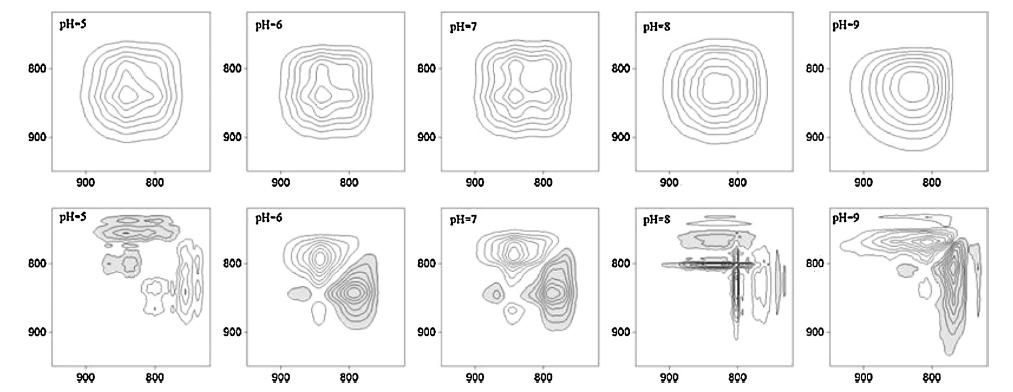
As mentioned above,2D-COS was also employed to discern the As(V) adsorption process at different pH,and the results are shown in Fig. 5. The synchronous spectra indicated the direction of variations in peak intensity during the adsorption. For example,the peak intensity of the 839 cm-1 bands at pH 5-9 increased with increasing time (Fig. 2),so a positive synchronous cross peak was resolved.

|
Download:
|
| Fig. 4. Negative second derivative FTIR spectra of As(V) adsorbed on LAA at different pH conditions. | |
As shown in Fig. 5,the prominent auto-peaks on the diagonal were observed at 839,839,839,831 and 819 cm-1 in synchronous spectra,respectively,suggesting the spectral intensities of As-O stretching bands have distinctly changed during the adsorption process. Similar to the results of ATR-FTIR spectra,with increasing pH,the peak positions markedly shifted toward lower wavenumbers, which was attributed to the change of incorporated proton number on the adsorbed AsO43- at different pH conditions [16]. Specifically,with the increasing of pH from 5 to 9,the dominate species of As(V) changed from H2AsO4- to HAsO42- (pKa2 = 6.76). Then,the same conversion from adsorbed H2AsO4- to HAsO42- occurred on the LAA surface and further caused the peak shift.

|
Download:
|
| Fig. 5. Synchronous (top) and asynchronous (bottom) contour plots obtained from the time dependent spectra of arsenate adsorbed on LAA at different pH values. The shaded and unshaded areas in the 2D spectra represent negative and positive peaks,respectively. | |
Furthermore,the peak shift followed a simple rule to determine the coordinate mode of arsenate. The transformation of amonodentate-coordinated metal-arsenate complex from two to one incorporated proton leads to the shift of the As-O stretching bands to lower frequency,while for a bridging bidentate complex, the result is the opposite [17]. The different band shift trends are caused by different symmetries and As-O band intensities of coordinated arsenate surface complexes. In our study,the peak position shifted from 838 cm-1 at pH 5 to 819 cm-1 at pH9,which was due to the increasing peak intensity at lower wavenumber from pH 5 to 9. Furthermore,the lower wavenumber at high pH indicated that the As-O stretch of HAsO42- was weaker than that of H2AsO4- adsorbed on LAA. This phenomenon agreed well with the monodentate configuration on metal oxide surfaces, indicating that the As(V) adsorbed on LAA in monodentate configurations in the pH range 5-9.
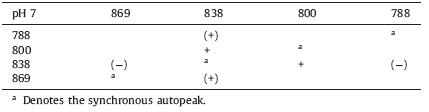
Two-dimensional asynchronous spectra could identify the specific order in surface interactions taking place under external perturbations [12]. An asynchronous cross peak arises when the intensity of two peaks change independently out of phase. The sequential order of intensity changes between band v1 and v2 could be obtained from the sign of synchronous correlation peak Φ (v1, v2) and asynchronous correlation peak ψ (v1,v2) under the wellestablished principles [11]. In brief,the change in the spectral intensity at v1 band occurs prior to that at v2 if Φ(v1,v2) and ψ (v1, v2) have the same sign,while the order is reversed if Φ (v1,v2) and ψ (v1,v2) have the opposite sign. The changes at v1 and v2 occur simultaneously if ψ (v1,v2) is zero. The order is indeterminate if Φ (v1,v2) is zero. On the basis of this rule,correlation analysis was performed for the spectra at pH 5-9 in this study. As shown in Fig. 5 and Table 2 (take pH 7 as an example),the analysis resolved several cross peaks at different pH. For example,the sub peaks at 869, 838,800,788 cm-1 were observed at pH 7,which were in agreement with our second derivative spectra. Furthermore,the positive Φ values of auto peaks in the synchronous indicated the arising As(V) amount in the adsorption processes. However,most cross peaks in asynchronous maps were not observed in the synchronous maps,indicating the specific order in surface interactions was indeterminate. It implied that the adsorption sequence of H2AsO4- and HAsO42- was irregular,depending on the solution condition. This result suggested that protons incorporated on As(V) played a negligible role on As(V) adsorption affinity to LAA.
| Table 2 The 2D-COS results on the assignment and sign of each cross-peak in synchronous (Φ) and asynchronous (ψ,in the parentheses) maps of arsenate adsorbed on LAA at pH 7. |
Both ATR-FTIR and 2D-COS were used to explore the adsorption process of As(V) on LAA in this study. The ATR-FTIR result and adsorption kinetics study confirmed that the electrostatic attraction between the positive surfaces of LAA and As(V) anions existed. The results of 2D-COS demonstrated that the As(V) was adsorbed on LAA as a monodentate configuration in the pH range 5-9. In addition,the coexistent adsorbed species,H2AsO4- and HAsO42-, were adsorbed on LAA surface without specific sequence at different pH,indicating a negligible role of the incorporated protons of As(V) on the adsorption affinity to LAA surface. The results of this study gained insights into LAA surface complexes on the molecular scale and provided theoretical support to new metal oxides design for efficient removal of arsenic.
AcknowledgmentsThis work is supported by the Strategic Priority Research Program of the Chinese Academy of Sciences (No. XDB14020201), the National Basic Research Program of China (No. 2014CB441102),the National Natural Science Foundation of China (No. 21477144),and the Young Scientists Fund of RCEES, RCEES-QN-20130017F.
| [1] | Y. Meng, J.N. Wang, C. Cheng, X. Yang, A.M. Li, Preparation of new base-aluminumchloride-loaded fiber as adsorbent for fast removal of arsenic(V) from water, Chin. Chem. Lett. 23 (2012) 863-866. |
| [2] | G.H. Zhu, Z.M. Li, X.H. Chen, et al., Determination of trace arsenic(V) by catalytic solid substrate-room temperature phosphorescence quenching method, Chin. Chem. Lett. 18 (2007) 711-713. |
| [3] | X.L. Wu, X.L. Tan, S.T. Yang, et al., Coexistence of adsorption and coagulation processes of both arsenate and NOM from contaminated groundwater by nanocrystallined Mg/Al layered double hydroxides, Water Res. 47 (2013) 4159-4168. |
| [4] | S.A. Wasay, J. Haron, S. Tokunaga, Adsorption of fluoride, phosphate, and arsenate ions on lanthanum impregnated silica gel, Water Environ. Res 68 (1996) 295-300. |
| [5] | Q.T. Shi, Y.Y. Huang, C.Y. Jing, Synthesis, characterization and application of lanthanum-impregnated activated alumina for F removal, J. Mater. Chem. A 1 (2013) 12797-12803. |
| [6] | W.Y. Huang, Y. Zhu, J.P. Tang, et al., Lanthanum-doped ordered mesoporous hollow silica spheres as novel adsorbents for efficient phosphate removal, J. Mater. Chem. A 2 (2014) 8839-8848. |
| [7] | M.R. Gandhi, S. Meenakshi, Preparation and characterization of La(III) encapsulated silica gel/chitosan composite and its metal uptake studies, J. Hazard. Mater. 203 (2012) 29-37. |
| [8] | F. Zaera, Probing liquid/solid interfaces at the molecular level, Chem. Rev. 112 (2012) 2920-2986. |
| [9] | E.J. Elzinga, R. Kretzschmar, In situ ATR-FTIR spectroscopic analysis of the coadsorption of orthophosphate and Cd(II) onto hematite, Geochim. Cosmochim. Acta 117 (2013) 53-64. |
| [10] | I. Noda, Two-dimensional infrared-spectroscopy, J. Am. Chem. Soc. 111 (1989) 8116-8118. |
| [11] | I. Noda, Two-dimensional correlation spectroscopy-biannual survey, 2007-2009, J. Mol. Struct. 974 (2010) 3-24. |
| [12] | W. Yan, J.F. Zhang, C.Y. Jing, Adsorption of enrofloxacin on montmorillonite: twodimensional correlation ATR/FTIR spectroscopy study, J. Colloid Interf. Sci. 390 (2013) 196-203. |
| [13] | Y.L. Yang, W. Yan, C.Y. Jing, Dynamic adsorption of catechol at the goethite/aqueous solution interface: a molecular-scale study, Langmuir 41 (2012) 14588-14597. |
| [14] | M. Pena, X.G.Meng, G.P. Korfiatis, C.Y. Jing, Adsorptionmechanismof arsenic on nanocrystalline titanium dioxide, Environ. Sci. Technol. 40 (2006) 1257-1262. |
| [15] | S.C.B. Myneni, S.J. Traina, G.A. Waychunas, T.J. Logan, Experimental and theoretical vibrational spectroscopic evaluation of arsenate coordination in aqueous solutions, solids, and at mineral-water interfaces, Geochim. Cosmochim. Acta 62 (1998) 3285-3300. |
| [16] | S.C.B. Myneni, S.J. Traina, G.A. Waychunas, T.J. Logan, Vibrational spectroscopy of functional group chemistry and arsenate coordination in ettringite, Geochim. Cosmochim. Acta 62 (1998) 3499-3514. |
| [17] | J.S. Loring, M.H. Sandstrom, K. Noreńn, P. Persson, Rethinking arsenate coordination at the surface of goethite, Chem.-Eur. J. 15 (2009) 5063-5072. |