


b College of Chemistry and Molecular Engineering, Peking University, Beijing 100871, China
Isotactic polypropylene is a semi-crystalline polymer with a typical polymorphic behavior. Isotactic polypropylene molecular chains adopt a 31 helical conformation and can be organized into several spatial arrangements giving rise to α,β,γ crystal forms or mesophase,depending on the crystallization conditions [1, 2, 3, 4, 5, 6]. Mesophase can be formed by quenching the quiescent melt [7],which is unstable at high temperature and will transform to aphase upon temperature increasing [8]. The phase transition of quenched mesophase in the heating process has been studied extensively [9, 10, 11]. However,there is no consistent mechanism of the mesophase-α phase transition. Especially,the structure change before 60 °C is still unclear [6, 12].
In the 1980s,Noda [13] proposed generalized two-dimensional IR (2D-IR) correlation spectroscopy. Since then 2D-IR spectroscopy gets wide applications in various research fields. Two-dimensional IR correlation spectroscopy has been used to study the order- disorder transition and subtle conformational adjustments of polymer chains in terms of temperature and time-dependent spectral changes [14, 15]. Meanwhile,2D-IR is also a powerful method to study melting and crystallization of polymers while considering the adjustment of molecular conformation [16]. However, the conformational changes during the mesophase-a crystal transition of iPP by using 2D-IR correlation spectroscopy have not been reported. In this study,2D-IR correlation analysis was utilized to shed light on the microstructure change of mesophase in the heating process from 25 °C to 60 °C. 2. Experimental 2.1. Materials
Isotactic polypropylene with MFR (melt flow rate) of 3.6 g/ 10 min at 230 °C/2.16 kg is a product of Sinopec Beijing Yanshan Company. The iPP film with thickness about 80 μm sandwiched between two polytetrafluoroethylene films was heated to 210 °C and held at that temperature for 5 min,and then was quickly immersed into ice water mixture to prepare mesophase film. 2.2. Instrument and measurement
The film of the mesophase iPP was heated from room temperature to 200 °C at a heating rate of 3 °C/min by using a Linkam FTIR 600 hot stage. Wide angle X-ray diffraction (WAXD) measurements were carried out at the beamline 1W2A-SAXS in the Beijing synchrotron radiation facility (BSRF). The wavelength of the radiation was 1.54A˚ . The sample to detector distance was 161 mm. Scattering patterns were collected by using a MAR CCD (MAR-USA) detector with a resolution of 2048 × 2048 pixels and pixel size of 79 μm × 79 μm. Image acquisition time was 30 s. FT-IR spectra were recorded on a Nicolet 6700 spectrometer. Each spectrum was obtained at a resolution of 4 cm-1 with 16 scans co-added. The 2D synchronous spectrum was generated via the FTIR spectra by using the software of MATLAB (The Math Works Inc.). DSC experiment was performed on a TA DSC-Q2000. The heating rate is 3 °C/min from 20 °C to 180 °C. 3. Results and discussion
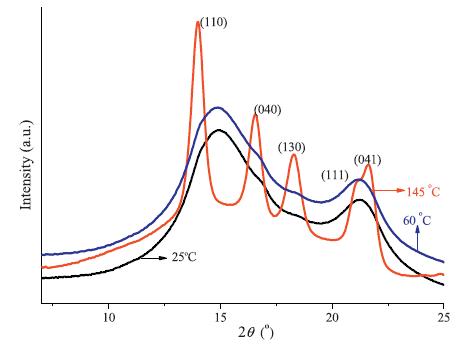
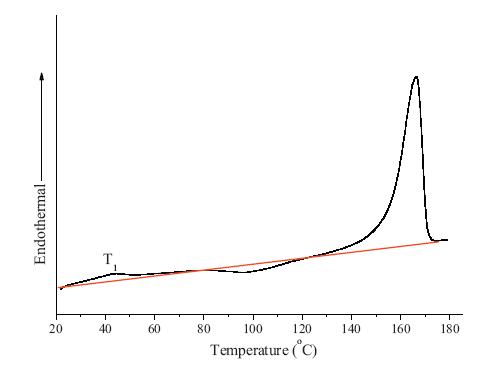
Fig. 1 displays the WAXD profiles of quenched iPP film at different temperatures. At room temperature,the iPP film turns out to be in mesophase with two broad peaks at ~15° and 21° [17]. When the temperature is above 60 °C,phase transition from mesophase to α phase takes place. Fig. 1 also provides WAXD pattern of iPP in α phase when the sample is heated to 145 °C. In this case,five characteristic diffraction peaks of α phase [18] can be observed at 148 (1 1 0),178 (0 4 0),18.68 (1 3 0),21.28 (1 1 1) and 22.28 (0 4 1). It should be pointed out that the diffraction patterns of the iPP film remain in mesophase when the temperature is below 60 °C. However,the DSC result provides a totally different picture. A weak endothermic peak was observed between 25 °C and 60 °C in the DSC curve of an iPP mesophase sample (Fig. 2). This result indicates that changes with observable latent enthalpy but no variations of X-ray diffraction pattern occur on the iPP sample in mesophse. Wang et al. [6] ascribed this phenomenon to the ‘melting’ of mesophase. Asakawa et al. [12] suggested the iPP sample underwent a glass transition-like change. In this report,in situ IR experiment [11, 19, 20] coupled with 2D-IR analysis was applied to study the microstructure changes of iPP in mesophase when the temperature was elevated from 25 °C to 60 °C. The study has led us to propose an alternative explanation of the above phenomenon.

|
Download:
|
| Fig. 1. WAXD profile of quenched iPP at different temperature with a heating rate of 3 °C/min. | |

|
Download:
|
| Fig. 2. DSC curve of quenched iPP in the heating process at a rate of 3 °C/min. | |
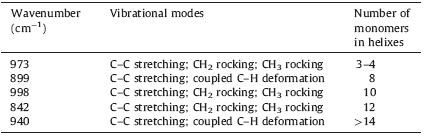
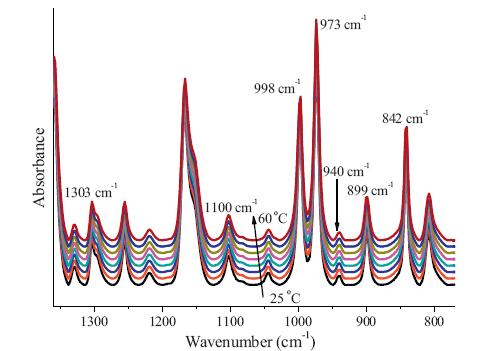
Typical temperature variable FTIR spectra of quenched iPP film are shownin Fig.3.Aseries ofbands that are relevant toiPP in regular helical conformation with different lengths (Table 1) [20, 21] can be observed between 1350 and 700 cm-1. Upon elevating the temperature,these bands exhibit subtle but observable changes. To enhance our understanding on the spectral behavior of these bands,2D correlation spectroscopic analysis was conducted and the corresponding 2D synchronous spectrum is shown in Fig. 4.
| Table 1 Assignment of regular helical conformation bands of iPP. |

|
Download:
|
| Fig. 3. Temperature variable infrared spectra of quenched iPP sample,the temperature range is between 25 °C and 60 °C. | |

|
Download:
|
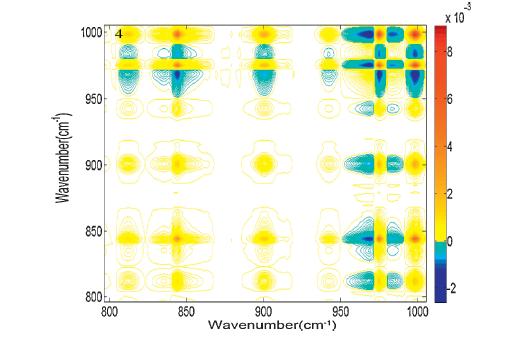
| Fig. 4. Synchronous two-dimensional (2D) infrared correlation spectrum of quenched iPP in the range of 1000-800 cm-1. | |
For any two peaks of the four peaks at 998,940,899,842 cm-1, the corresponding cross peak is always positive in 2D synchronous spectrum. According to Noda’s rules [22],these results suggest that the variation of the intensities of these bands is along the same direction during the heating process. As a matter of fact, the intensities of the four bands decrease when the temperature increases from 25 °C (data not shown).
However,the spectral behavior of the 973 cm-1 band is different fromthat of the above four bands. Althoughthe 973 cm-1 bandis the strongest band in FTIR spectra (Fig. 3),the corresponding autopeak at (973,973) in 2D synchronous spectrum is much weaker than the auto-peak at (998,998). This result suggests that the variation of the intensity of the 973 cm-1 band is much less than that of998 cm-1 bandwhenthetemperature increases from25 °Cto 60 °C. Thus,we examined the variation of the 973 cm-1 band at a function of temperature. In fact,the intensity of the 973 cm-1 band exhibits an oscillation whose average value decreases extremely slowly (data not shown). Thus 842,899,940,973 and 998 cm-1 bands can be classified into two groups. The 842,899,940,and 998 cm-1 bands belong to the first group and the 973 cm-1 band belongs to the second group. The bands in the first group undergo observable decreases in intensity upon elevating the temperature, while the intensity of the 973 cm-1 band is almost invariable during the heating process.
The above results provide us a clue to explain the observation of the endothermic peak between 25 °C and 60 °C in DSC experiment. The bands in the first group are relevant to helix segment with different number of monomers. As the temperature increases,the fact that the intensity of the first group of peak decreases indicates that the contents of the corresponding helix segments decreases. That is to say,considerable amount of helix segments are destroyed during the heating process. The energy consumption to destroy the helix segments constitutes the main part of the endothermic peak in the DSC experiments. Concerning the 973 cm-1 band that is relevant to helix segment with 3-4 monomers,two processes should be considered. (1) The destruction of the helix segment with 3-4 monomers makes the intensity of the 973 cm-1 band decrease. (2) The formation of helix segment with 3-4 monomers via the destruction of long helix segments, which make the intensity of the 973 cm-1 band increase. The above two processes form a dynamic balance. Consequently,the intensity of the 973 cm-1 band remains nearly unchanged during the heating process. 4. Conclusion
Two-dimensional FT-IR correlation spectroscopy was used to study the structural changes of isotactic polypropylene (iPP) mesophase during the heating process. The 5 helix conformation relevant bands at 842,899,940,973 and 998 cm-1 can be classified into two groups. The 842,899,940 and 998 cm-1 band,which are related to longer helix segments belong to the first group and their intensities decrease upon elevating the temperature. The 973 cm-1 band,assigned to helix with 3-4 monomers,belongs to the second group. The formation and destruction of the helix segment with 3-4 monomers co-occur and form a dynamic balance. As a result,the intensity of the 973 cm-1 is almost unchanged during the heating process. The above result is helpful to understand the observation of an endothermic peak between 25 °C and 60 °C in the DSC experiment.
AcknowledgmentThis project is financially supported by the National Natural Science Foundation of China (No. 51373003). The BSRF is acknowledged for kindly providing the beam time.
| [1] | S. Brü ckner, S.V. Meille, V. Petraccone, B. Pirozzi, Polymorphism in isotactic polypropylene, Prog. Polym. Sci. 16 (1991) 361-404. |
| [2] | B. Lotz, J.C. Wittmann, A.J. Lovinger, Structure and morphology of polypropylenes: a molecular analysis, Polymer 37 (1996) 4979-4992. |
| [3] | J. Varga, Review supermolecular structure of isotactic polypropylene, J. Mater. Sci. 27 (1992) 2557-2579. |
| [4] | G. Natta, P. Conrradini, Structure and properties of isotactic polypropylene, II Nuovo Cimento 15 (1960) 40-51. |
| [5] | S.V. Meille, D.R. Ferro, S. Brueckner, A.J. Lovinger, F.J. Padden, Structure of betaisotactic polypropylene: a long-standing structural puzzle, Macromolecules 27 (1994) 2615-2622. |
| [6] | Z.G. Wang, B.S. Hsiao, S. Srinivas, et al., Phase trandformation in quenched mesomorphic isotactic polypropylene, Polymer 42 (2001) 7561-7566. |
| [7] | R. Androsch, M.L. Di Lorenzo, C. Schick, B. Wunderlich, Mesophases in polyethylene, polypropylene, and poly(1-butene), Polymer 51 (2010) 4639-4662. |
| [8] | D. Mileva, R. Androsch, E. Zhuravlev, C. Schick, B. Wunderlich, Isotropization, perfection and reorganization of the mesophase of isotactic polypropylene, Thermochim. Acta 522 (2011) 100-109. |
| [9] | C. Marega, V. Causin, A. Marigo, A SAXS-WAXD study on the mesomorphic-a transition of isotactic polypropylene, J. Appl. Polym. Sci. 109 (2008) 32-37. |
| [10] | R. Androsch, In situ atomic force microscopy of the mesomorphic-monoclinic phase transition in isotactic polypropylene, Macromolecules 41 (2008) 533-535. |
| [11] | J.C. Zhao, Z. Peng, J.M. Zhang, G.C. Li, In situ FT-IR spectroscopy study on the conformational changes of quenched isotactic polypropylene during stepwise heating, Polym. Bull. 67 (2011) 1649-1659. |
| [12] | H. Asakawa, K. Nishida, J. Yamamoto, R. Inoue, T. Kanaya, Heating rate effects on the crystallization behavior of isotactic polypropylene from mesophase-a depolarized light transmission study, Polymer 53 (2012) 2777-2782. |
| [13] | I. Noda, Generalized two-dimensional correlation method applicable to infrared, raman,and other types of spectroscopy, Appl. Spectrosc. 47 (1993) 1329-1336. |
| [14] | T. Zhou, Z.Y. Wu, Y.Y. Li, et al., Order-order, lattice disordering, and order-disorder transition in SEBS studied by two-dimensional correlation infrared spectroscopy, Polymer 51 (2010) 4249-4258. |
| [15] | J.M. Zhang, H. Tsuji, I. Noda, Y. Ozaki, Structural changes and crystallization dynamics of poly(L-lactide) during the cold-crystallization process investigated by infrared and two-dimensional infrared correlation spectroscopy, Macromolecules 37 (2004) 6433-6439. |
| [16] | K. Zheng, R.G. Liu, Y. Huang, A two-dimensional IR correlation spectroscopic study of the conformational changes in syndiotactic polypropylene during crystallization, Polym. J. 42 (2010) 81-85. |
| [17] | P.B. Mcallister, T.J. Carter, R.M. Hinde, Structure of the quenched form of polypropylene, J. Polym. Sci.: Polym. Phys. 16 (1978) 49-57. |
| [18] | R.L. Miller, On the existence of near-range order in isotactic polypropylenes, Polymer 1 (1960) 135-143. |
| [19] | X.Y. Li, Z. Ma, F.M. Su, et al., New understanding on the memory effect of crystallized iPP, Chin. J. Polym. Sci. 32 (2014) 1224-1233. |
| [20] | C. Wang, T.C. Hsieh, Y.W. Cheng, Solution-electrospun isotactic polypropylene fibers: processing and microstructure development during stepwise annealing, Macromolecules 43 (2010) 9022-9029. |
| [21] | H.N. An, B.J. Zhao, Z. Ma, et al., Shear-induced conformational ordering in the melt of isotactic polypropylene, Macromolecules 40 (2007) 4740-4743. |
| [22] | I. Noda, Two-dimensional infrared (2D-IR) spectroscopy:theory and applications, Appl. Spectrosc. 44 (1990) 550-561. |