


Xanthates are widely used collectors in the flotation of sulfide minerals [1, 2]. In the flotation process,xanthate may interact with metal ions on mineral surfaces and increase the hydrophobicity. Compared with extensive studies of the adsorption of xanthate at the surface of sulfide minerals,the studies on xanthate adsorption at the surface of oxide minerals are much fewer with only a limited number of studies dealing with this aspect. Rao and Finch [3], presented the results of flotation characteristics of Ni,Cu(II),Zn and Fe(III) oxides with xanthates,and their selective separation by controlling solution pH. Lead oxide,as a very important semiconductor,has been widely used as catalysts [4],storage batteries and gas sensors [5]. To effectively separate oxide minerals and improve the selectivity,the flotation of lead oxide minerals using xanthate,as a collector,is an alternative to the recovery of lead oxide. Thus the understanding at the molecular level of the reaction mechanism of xanthate with pure lead oxide minerals like α-PbO is helpful to increase flotation efficiency of lead oxide minerals.
One of the most versatile techniques for measuring adsorption is continuous,online in situ attenuated total reflectance Fourier transform infrared (ATR-FTIR) technique. Thus,ATR-FTIR can be used to study the orientation of functional groups attached or near the surface,and characterize various adsorption behaviors. Inspired by Mielczarski [6],Roonasi and Holmgren [7],Fredriksson and Holmgren [8],the studies of the xanthate adsorption at sulfide mineral surfaces using in situ ATR-FTIR spectroscopy,we studied the orientation and the adsorption kinetics of butyl xanthate adsorbed onto the surface of α-PbO using continuous online in situ ATR-FTIR technique in this paper.
Two-dimensional (2D) correlation analysis proposed by Noda [9, 10, 11] is used in this work to evaluate the adsorption data. As we know that 2D correlation spectra consist of two orthogonal components,the synchronous and asynchronous correlation spectrum,which can improve the spectral resolution,detect the interaction of functional groups among intrα- or inter-molecules and distinguish multiply overlapped bands commonly encountered in vibrational spectroscopy [12]. Two-dimensional correlation spectroscopy is also utilized to identify the number of surface complexes and to assign peaks which belong to each surface complex [13, 14]. One of the highlight of this work is to provide evidence of the formation of xanthate micelles at the surface of α- PbO by using 2D-IR techniques. 2. Experimental
Reagents and materials: All the chemical reagents were of analytical grade and used without further purification. All solutions were prepared in deionized water (18 MΩ cm) obtained from a Milli-Q purification system. High purity potassium butyl xanthate (KEX) was synthesized following the method described by Rao [15]. The purity of obtained KEX was more than 99% by recrystallization from acetone/petroleum ether. The preparation of α-PbO was described in the Supporting information. The synthesized nanocrystals were characterized by XRD.
ATR-FTIR kinetic experiments: ATR-FTIR spectra were collected as a function of time on a freshly prepared α-PbO film (described in the Supporting information) at 25 8C using a Bruker VERTEX-70 FTIR spectrometer equipped with a DTGS detector. A trapezoidal ZnSe crystal (50 mm × 10 mm × 4 mm) with a 458 bevel was used for the ATR measurements. The deionized water was passed through the flow cell first until there was no further change in the spectra. A background spectrum was collected that consisted of the absorbance of the ZnSe crystal and deposited α-PbO. Butyl xanthate solution (1.0 × 10⁻³ mol L-1) was allowed to flow at the rate of 3.00 mL min-1 across the α-PbO film when the signal was stable. The spectra were collected at a resolution of 4 cm-1 with 32 scans in the 4000-400 cm-1 region,and all spectra were normalized. Collection of adsorption spectra started as soon as butyl xanthate entered the ATR flow cell and maintained for up to 150 min. After that,deionized water entered the ATR-FTIR flow cell to rinse for 30 min,and then NaOH solution (pH 12) entered for 60 min.
Two-dimensional correlation analysis: The software for twodimensional correlation analysis was 2D Pocha. In synchronous spectra,a positive cross peak represented that these two peaks increased,or decreased simultaneously. A negative cross peak indicated that the intensity of one band was increasing while that of the other was decreasing. Asynchronous spectra showed positive or negative cross peaks,which indicated that these two peaks changed independently and may arise from different functional groups of the same surface complex [9, 16]. In 2D maps, unshaded regions were defined as the positive correlation intensities,while shaded regions were defined as negative correlation intensities [17]. The adsorption spectra at equal time intervals were chosen for 2D correlation analysis. 3. Results and discussion 3.1. XRD analysis of α-PbO
The XRD pattern of the sample α-PbO is shown in Fig. S1 in Supporting information. All of the reflections could be indexed to the orthorhombic lattice of PbO (α-PbO,JCPDS No. 35-1482). No other impurity peaks were observed,indicating that pure α-PbO was obtained. 3.2. ATR-FTIR spectroscopy analysis
The FTIR spectra of butyl xanthate adsorbed at the surface of α-PbO is showed in Fig. 1. We also studied the butyl xanthate adsorbed on uncoated ZnSe crystal (shown in Fig. S2 in Supporting information),the results indicated that the amount of butyl xanthate adsorbed on ZnSe crystal was negligible. Only the 1300-1000 cm-1 region is shown in Fig. 1,where most of the important vibrations of the xanthate functional groups are observed. According to literatures [18, 19, 20],the main features of adsorbed xanthate molecules were around 1203-1198 cm-1, 1140-1124 cm-1,and 1033-1028 cm-1. The broad bands at 1203 cm-1 were attributed to the asymmetric stretching vibrations of C-O-C and S-C-S groups,1124 cm-1 was due the asymmetric stretching vibrations of S-C-S groups and the deformation vibration of C-O-C/O-C-C/C-C-C groups,while those at 1033 cm-1 were due to the stretching vibrations of the S-C-S groups [21]. The spectrum of adsorbed xanthate shows a typical band from dixanthogen around 1256 cm-1 [22]. We found the intensities at 1226 cm-1,1198 cm-1 and 1140 cm-1 together with 1033 cm-1 increased,the 1203 cm-1 band shifted to 1198 cm-1 and 1033 cm-1 band shifted to 1028 cm-1 as the adsorption progresses,which suggested that lead xanthate was formed on the surface [8].

|
Download:
|
| Fig. 1. ATR-FTIR spectra of butyl xanthate adsorbed on the surface of α-PbO surface in the range of 1300-1000 cm-1 at variable time. | |
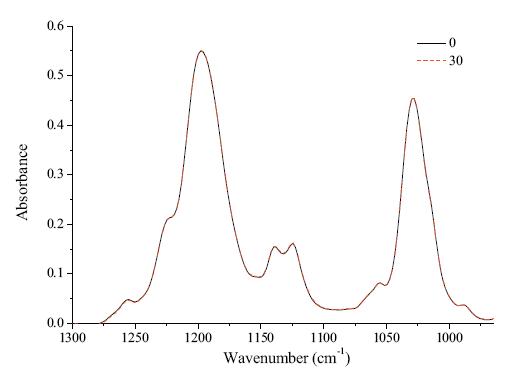
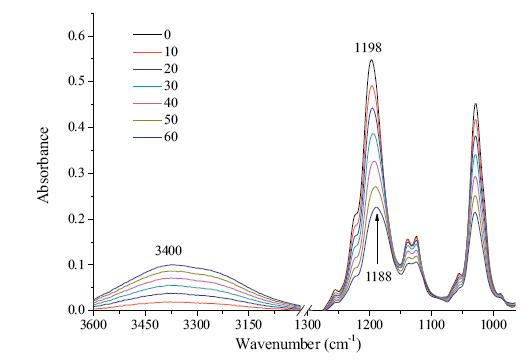
After the adsorption experiment,the ATR-FTIR spectra of deionized water and NaOH solution,as the desorbing agents shown respectively in Figs. 2 and 3,were collected as a function of time. The peak intensities had no obvious change when rinsing with deionized water,indicating that the adsorption of butyl xanthate at the surface of α-PbO represented chemisorption. Chemisorption was characterized by a strong bonding to the surface. Fig. 3 shows that the 1198 cm-1 band shifted to higher frequency after rinsing with NaOH solution,meanwhile the peak intensity around 3400 cm-1 increased gradually,indicating that OH- progressively replaced the xanthate at the surface site.

|
Download:
|
| Fig. 2. ATR-FTIR spectra of butyl xanthate after 30 min desorption using deionized water in the range of 1300-1000 cm-1(the curves correspond to 5,10,20,30,50,70, 90,110,130,150 min from min to max absorbance). | |

|
Download:
|
| Fig. 3. ATR-FTIR spectra of butyl xanthate after variable desorption time using NaOH in the range of 3600-3000 cm-1 and 1300-1000 cm-1. | |
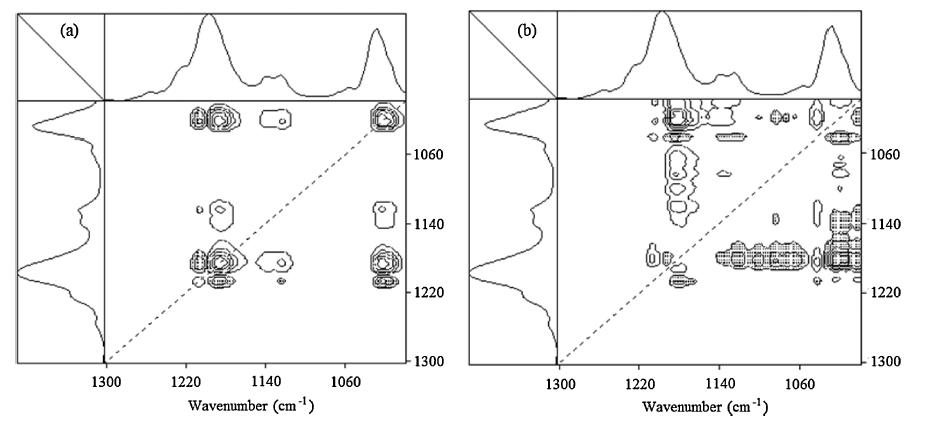
In order to further study the adsorption and desorption process, we use 2D-Pocha software for two-dimensional correlation analysis. The time interval between two successive spectra in Fig. 4 is about 20 min,and the time range is 0-150 min. In Fig. 4(a), auto peaks (1207/1207 cm-1),(1184/1184 cm-1) and (1024/ 1024 cm-1) have strong disturbance,which indicate obvious changes in surface xanthate morphologies as adsorption progresses. The positive,synchronous cross peaks at (1184/ 1024 cm-1) in the left upper triangle indicate the vibrations of 1184 cm-1 and 1024 cm-1 change in the same direction. The negative cross peaks (1207/1186 cm-1) and (1207/1124 cm-1) indicate that the peaks at 1207 cm-1,1186 cm-1,and 1124 cm-1 have changed directions. Fig. 4(b) indicates the 2D asynchronous correlation spectra of the butyl xanthate adsorbed at α-PbO. The positive cross peaks of (1207/1184 cm-1),(1184/1124 cm-1) and (1184/1024 cm-1) mean that the intensities of the two spectral features change out of phase with each other as the adsorption progresses [16]. The positive synchronous cross peaks at (1184/ 1124 cm-1),(1184/1024 cm-1) and the negative synchronous cross peaks at (1207/1184 cm-1) indicate that the band at 1184 cm-1 changes slightly prior to the bands at 1024 cm-1, 1207 cm-1,1124 cm-1. The positive asynchronous bands at (1041/ 1024 cm-1),and (1207/1041 cm-1) and the negative asynchronous bands at (1184/1041 cm-1) and (1124/1041 cm-1) at the left upper triangle indicate the band at 1041 cm-1 is hidden in 1D FTIR. The band 1041 cm-1 is the C=S asymmetric stretching vibrations. We deduce this peak is probably evidence of surface micelles (surface aggregates) formation. The hydrophobic interactions between butyl xanthate chains may lead to the formation of micelle structures on the surface [23].

|
Download:
|
| Fig. 4. Synchronous 2D correlation spectra (a) and asynchronous 2D correlation spectra (b) of butyl xanthate adsorpted at the surface of α-PbO. | |
According to the concentration of butyl xanthate determined using a UV monitor after the adsorption and desorption experiment, the maximum adsorption was 281 mg g-1 and the desorption efficiency of xanthate was 42.5%,which showed that xanthate molecules at the α-PbO surfaces were replaced substantially by OH- ions.
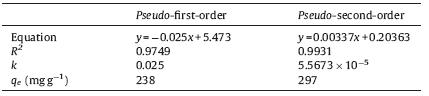
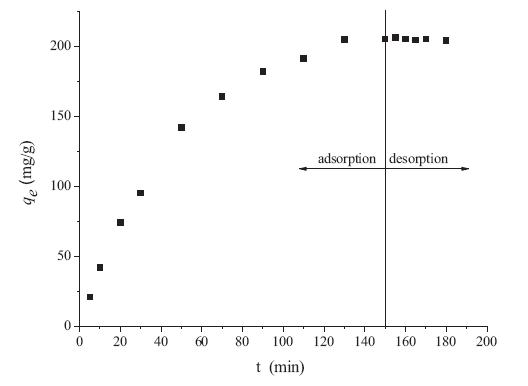
Baseline-corrected ATR-FTIR absorbance at 1200 cm-1 was used to generate kinetic curves (showed in Fig. 5). The intensity of adsorbed butyl xanthate increased rapidly during the first 60 min, then increased slowly and eventually reached an equilibrium plateau value. We used kinetic equations of the first and second orders to analyze the experimental data. The equation may be written as

|
Download:
|
| Fig. 5. Adsorption capacity of α-PbO for butyl xanthate as a function of time. | |

| Table 1 Pseudo-first-order and pseudo-second-order kinetic equations and parameters. |
The adsorption of butyl xanthate on a particle film of α-PbO had been studied using continuous online in situ ATR-FTIR. The rate of adsorption was rapid during the first 60 min and reached an equilibrium plateau value after about 110 min. The peak intensity had no obvious change after rinsing with deionized water,which showed that butyl xanthate adsorbed at the surface of α-PbO resulted by a chemisorption process. The peak intensity was weakened substantially using NaOH solution as the desorption agent,which proved that OH- competed with butyl xanthate molecular and replaced butyl xanthate partly on the surface of α- PbO. The results of 2D correlation spectroscopy analysis also indicated that xanthate micelles were formed at the surface. We used kinetic equations to analyze the experimental data,and the results revealed that the process of butyl xanthate adsorbed in α- PbO surface was in conformity with pseudo-second-order kinetics.
AcknowledgmentsThis work was supported by the National Nature Science Foundation of China (Nos. 51274104,50874052) and National Key Basic Research Program of China (973,No. 2011CB933700).
Appendix A. Supplementary dataSupplementary material related to this article can be found,in the online version,at http://dx.doi.org/10.1016/j.cclet.2014.07.003.
| [1] | B. Bag, B. Das, B.K. Mishra, Geometrical optimization of xanthate collectors with copper ions and their response to flotation, Miner. Eng. 24 (2011) 760-765. |
| [2] | P.H. Fu, S. Ewen, D.G. Senior, Spectroscopic characterization of ethyl xanthate oxidation products and analysis by ion interaction chromatography, Anal. Chem. 72 (2000) 4836-4845. |
| [3] | S.R. Rao, J.A. Finch, Base metal oxide flotation using long chain xanthates, Miner. Process. 69 (2003) 251-258. |
| [4] | S.K. Pasha, V.S.V. Satyanarayana, A. Sivakumar, K. Chidambaram, L.J. Kennedy, Catalytic applications of nano b-PbO in Paal-Knorr reaction, Chin. Chem. Lett. 22 (2011) 891-894. |
| [5] | P. Veluchamy, M. Sharon, M. Shimizu, H. Minoura, Electrosynthesis of lead oxide film on a lead electrode in alkaline solution by a potentiodynamic method: Its characterization and photoelectrochemical properties, Electroanal. Chem. 371 (1994) 205-217. |
| [6] | J. Mielczarski, In situ ATR-IR spectroscopic study of xanthate adsorption on marcasite, Colloids Surf. 17 (1986) 251-271. |
| [7] | P. Roonasi, A. Holmgren, An ATR-FTIR study of sulphate sorption on magnetite; rate of adsorption, surface speciation, and effect of calcium ions, Colloid Interface Sci. 333 (2009) 27-32. |
| [8] | A. Fredriksson, A. Holmgren, An in situ ATR-FTIR investigation of adsorption and orientation of heptyl xanthate at the lead sulphide/aqueous solution interface, Miner. Eng. 21 (2008) 1000-1004. |
| [9] | I. Noda, A.E. Dowrey, C. Marcott, Recent developments in two-dimensional infrared (2D IR) correlation spectroscopy, Appl. Spectrosc. 47 (1993) 1317-1323. |
| [10] | I. Noda, Two-dimensional infrared-spectroscopy, J. Am. Chem. Soc. 111 (1989) 8116-8118. |
| [11] | I. Noda, Two-dimensional infrared (2D IR) spectroscopy: theory and applications, Appl. Spectrosc. 44 (1990) 550-561. |
| [12] | D.L. Elmore, R.A. Dluhy, Application of 2D IR correlation analysis to phase transitions in Langmuir monolayer films, Colloids Surf. A 171 (2000) 225-239. |
| [13] | K. Noren, P. Persson, Adsorption of monocarboxylates at the water/goethite interface: the importance of hydrogen bonding, Geochim. Cosmochim. Acta 71 (2007) 5717-5730. |
| [14] | A.A. Simanova, J.S. Loring, P. Persson, Formation of ternary metal-oxalate surface complexes on a-FeOOH particles, J. Phys. Chem. C 115 (2011) 21191-21198. |
| [15] | S. Rao, Xanthate and Related Compounds, Marcel Dekker, Inc., New York, 1971. |
| [16] | I. Noda, Y. Ozaki, Two-Dimensional Correlation Spectroscopy: Applications in Vibrational and Optical Spectroscopy, John Wiley & Sons, Chichester, England, 2004. |
| [17] | Y. Shen, P.Y. Wu, Two-dimensional ATR-FTIR spectroscopic investigation on water diffusion in polypropylene fime: water bending vibration, J. Phys. Chem. B 107 (2003) 4224-4226. |
| [18] | P. Hellstroöm, S. Ö berg, A. Fredriksson, et al., A theoretical and experimental study of vibrational properties of alkyl xanthates, Spectroch. Acta Part A 65 (2006) 887-895. |
| [19] | W.H. Jang, J.D. Miller, Verification of the internal reflection spectroscopy adsorption density equation by Fourier transform infrared spectroscopy analysis of transferred Langmuir-Blodgett films, Langmuir 9 (1993) 3159-3165. |
| [20] | R. Woods, G.A. Hope, G.M. Brown, Spectroelectrochemical investigations of the interaction of ethyl xanthate with copper, silver and gold: II. SERS of xanthate adsorbed on silver and copper surfaces, Colloids Surf. A 137 (1998) 329-337. |
| [21] | J.O. Leppinen, C.I. Basilio, R.H. Yoon, In-situ FTIR study of ethyl xanthate adsorption on sulfide minerals under conditions of controlled potential, Int. J. Miner. Process. 26 (1989) 259-274. |
| [22] | M.L. Larsson, A. Holmgren, W. Forsling, Xanthate adsorbed on ZnS studied by polarized FTIR-ATR spectroscopy, Langmuir 16 (2000) 8129-8133. |
| [23] | Q. Shen, Y.J. Fan, L. Yin, Z.X. Sun, Two-dimensional continuous online in situ ATR-FTIR spectroscopyic investigation of adsorption of butyl xanthate on CuO surfaces, Acta Phys. Chim. Sin. 30 (2014) 359-364. |